

Cross-brand benchmarking promises clarity in a market defined by opacity. When brands compare operational performance beyond their own dashboards, blind spots shrink. Delivery timelines, refund rates, carrier reliability, and escalation patterns start to reveal structural truths rather than isolated anomalies. But the moment performance data crosses organisational boundaries, risk enters the equation.
Cross-brand benchmarking is powerful precisely because it exposes comparative performance. Without disciplined governance and anonymisation frameworks, however, it can create competitive vulnerability, compliance exposure, or erosion of trust between participants. The question is not whether brands should benchmark across peers. The real question is how to do so safely, transparently, and in a way that creates mutual value.
In Cross-brand benchmarking safely: governance, anonymisation and value exchange models, we explore how to design robust data governance structures, implement practical anonymisation standards, and build sustainable value exchange models that protect competitive integrity while unlocking actionable operational insight.
What makes cross brand benchmarking strategically powerful for D2C brands?
Cross-brand benchmarking works because performance data without context is misleading. A 28% RTO rate may seem catastrophic until you discover the category median is 35%. Conversely, a 3-day delivery TAT may feel acceptable until you learn peers achieve 1.8 days in the same zones.
Strategically, benchmarking reduces decision ambiguity. It prevents overcorrection, underinvestment, and false optimisation.
But the real power emerges when brands move beyond vanity comparisons and focus on structural performance metrics.
Moving from isolated metrics to contextual intelligence
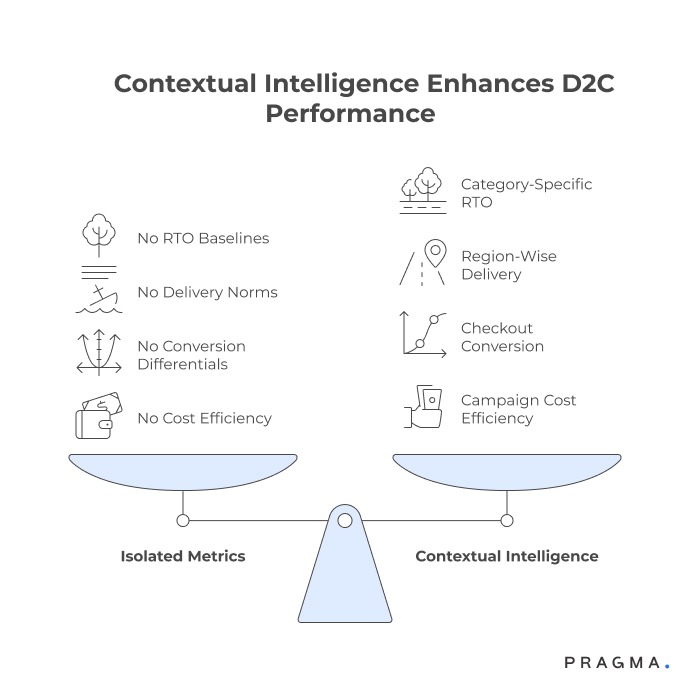
Most D2C brands track CAC, conversion rate, RTO, NDR recovery, fulfilment TAT, and zone-level shipping costs. The issue is not lack of tracking — it is lack of calibrated reference.
When brands engage in cross brand performance benchmarking, they gain:
- Category-specific RTO baselines
- Region-wise delivery success norms
- Checkout conversion differentials
- Campaign-level cost efficiency medians
The strategic shift is subtle but important. Instead of asking “Is our performance good?”, brands ask “Are we structurally underperforming relative to comparable peers?”
This reduces emotional decision-making.
Why Indian D2C brands hesitate
Despite the upside, participation is slow. The hesitation is rational.
Competitive exposure risk
Founders worry that sharing CAC or RTO data reveals strategic weakness. In reality, unmanaged disclosure can distort negotiation power with carriers or media partners.
Legal and compliance ambiguity
India does not yet have a standardised D2C benchmarking compliance framework. Brands fear data misuse, especially when personal data overlaps with operational metrics.
Asymmetric value contribution
If one brand contributes granular data while another shares high-level aggregates, imbalance emerges. This erodes trust quickly.
Without governance clarity, benchmarking feels risky even if strategically beneficial.
What does robust benchmarking data governance actually look like?
The difference between safe benchmarking and risky collaboration lies in governance design. Governance is not a legal afterthought it is the architecture that determines sustainability.
Benchmarking data governance defines:
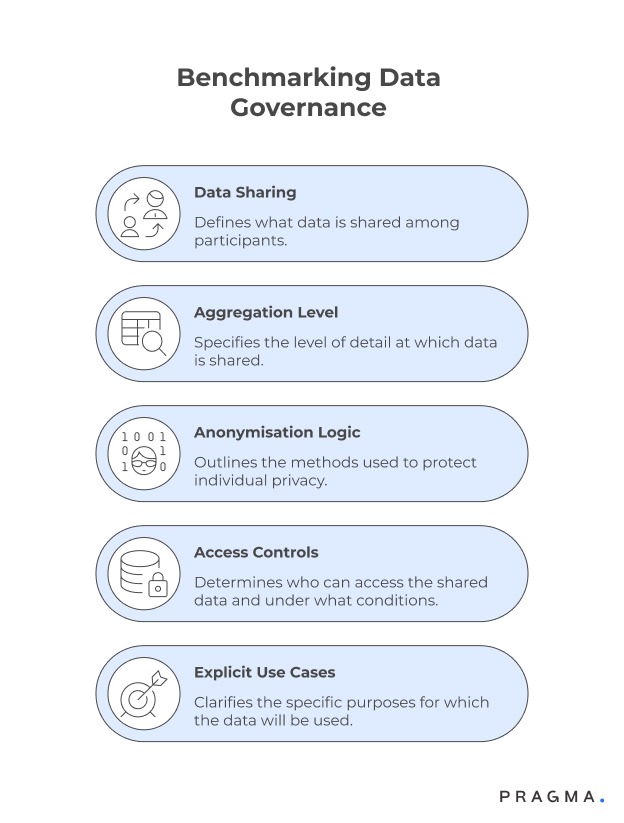
- What data is shared
- At what level of aggregation
- Under what anonymisation logic
- With what access controls
- For what explicit use cases
Without these controls, benchmarking devolves into informal data swapping — which is unsustainable.
Defining shareable vs restricted data layers
Not all performance data should be shared equally. Mature governance frameworks
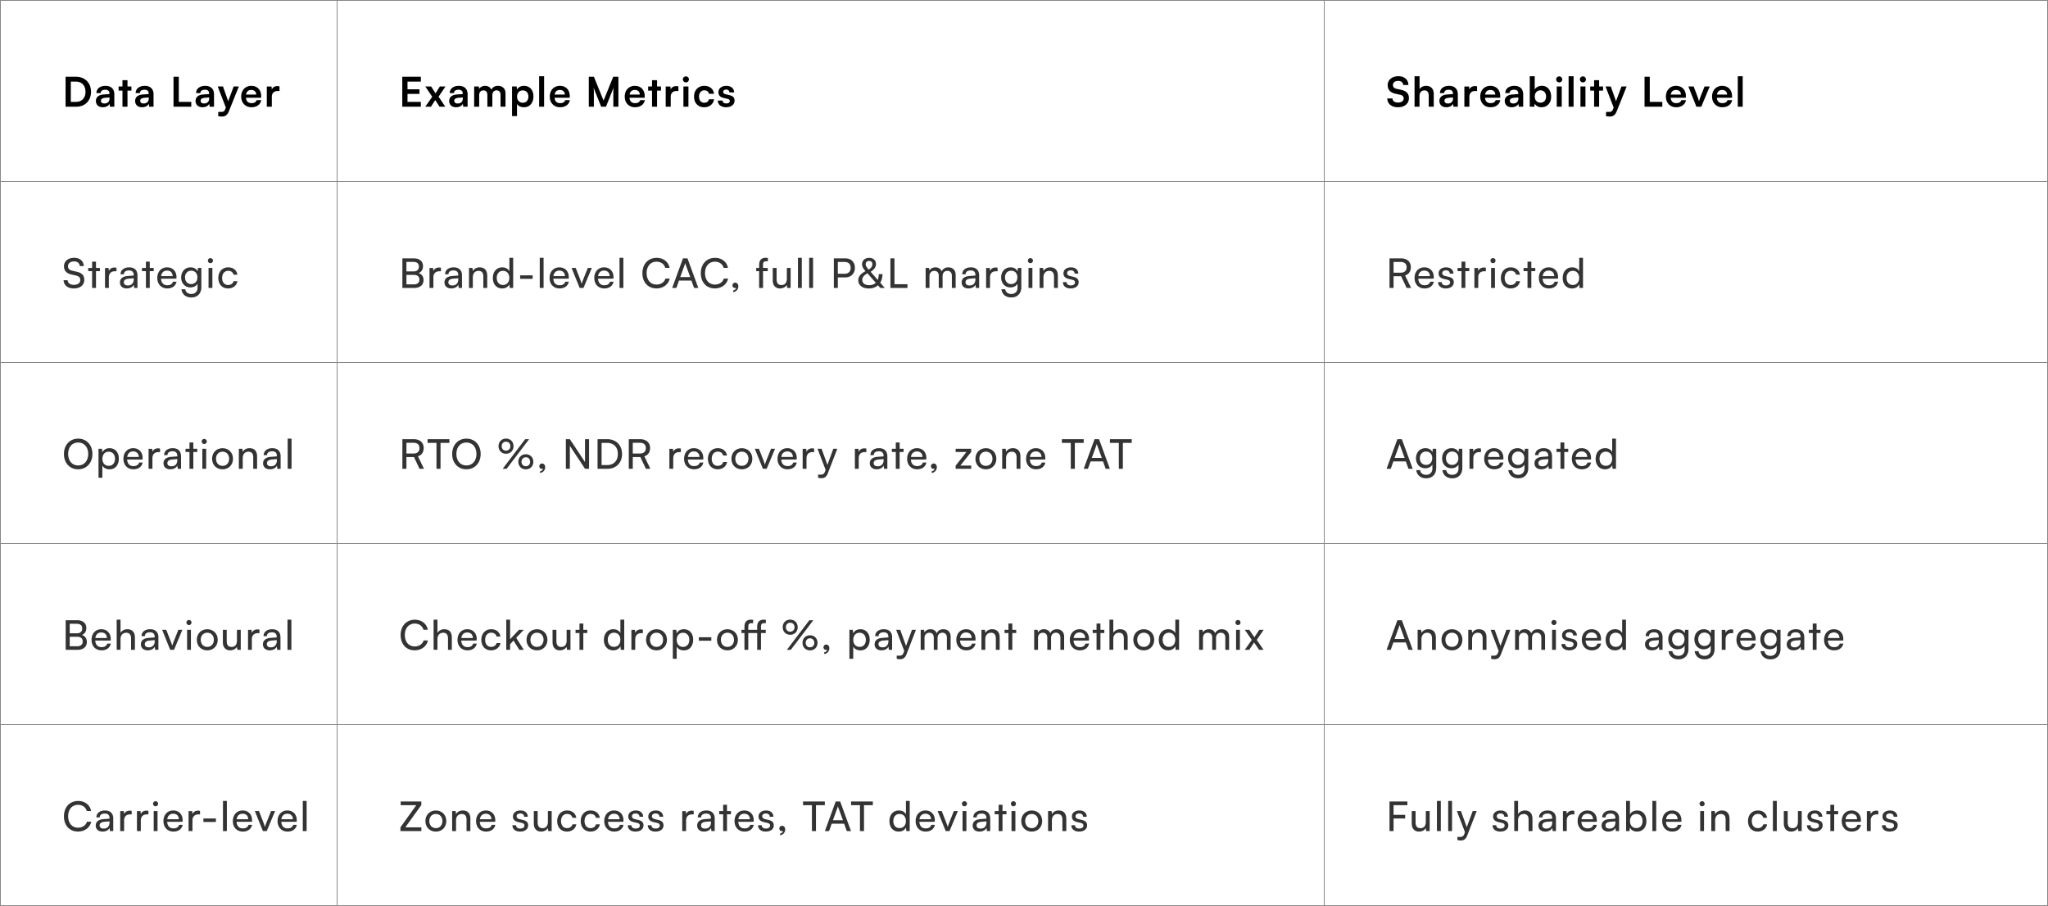
categorise data into layers.
The key insight: benchmarking should operate primarily at the operational and carrier-performance layer, not at the strategic profit layer.
For deeper thinking on carrier data alignment, refer to Cross-Brand Campaign Benchmarking Framework where campaign and fulfilment metrics are mapped safely.
Access control and role-based visibility
Governance fails when everyone sees everything.
Effective models define:
- Brand-level dashboards (own data + aggregate benchmarks)
- Consortium-level summary insights
- Independent data custodian oversight
This prevents lateral competitive intelligence extraction.
Brands that skip this step often withdraw after initial participation because perceived exposure outweighs insight value.
Legal structuring and consent architecture
Governance must formalise:
- Data processing agreements
- Explicit metric definitions
- Use-case restrictions
- Data retention periods
The absence of defined metric logic leads to comparison distortion. For example, if RTO is calculated at shipment creation by one brand and at delivery attempt by another, benchmarking collapses.
Clarity here prevents misinterpretation and reduces conflict.
How does anonymisation enable safe cross brand performance benchmarking?
Anonymisation is frequently misunderstood. Removing brand names is not sufficient. True anonymisation protects identity while preserving analytical value.
The objective is simple: maintain signal without exposing source.
Aggregation thresholds and cohort design
Safe benchmarking operates at cohort level.
Instead of:
“Brand A has 32% RTO in Tier 3.”
Use:
“Mid-size apparel brands with ₹5–15 Cr monthly GMV show median 30–35% RTO in Tier 3.”
Cohort design typically includes:
- Category
- GMV band
- Order volume band
- Fulfilment model
This ensures insights remain actionable while identities remain protected.
Statistical masking techniques in practice
Operational anonymisation typically includes:
Minimum sample thresholds
Benchmarks only published if at least 5–7 brands contribute in a cohort. This avoids reverse identification.
Percentile-based reporting
Instead of averages, use 25th, 50th, and 75th percentiles. This removes outlier identification.
Range banding
Report TAT as “1.5–2.2 days” instead of 1.87 days. This maintains strategic insight without precision leakage.
These methods make cross brand benchmarking sustainable.
For related thinking on operational data sensitivity, see Carrier Partner Data Intelligence Models which explore structured data abstraction.
What are sustainable benchmarking value exchange models for Indian D2C?
The success of cross brand benchmarking does not depend only on governance or anonymisation. It depends on fairness. If brands feel the exchange is unequal, participation drops, and data quality deteriorates.
Benchmarking value exchange models define how contribution translates into access.
Contribution-weighted access models
In this structure, access depth depends on the granularity and consistency of data contributed.
For example:
- Brands sharing daily zone-level RTO, TAT and NDR metrics gain access to percentile-level insights.
- Brands contributing only monthly aggregates receive high-level medians.
This aligns incentives. It prevents “free riders” while maintaining optionality.
Strategically, this model works because brands that want deeper insight are typically those operating at scale. Operationally, it encourages disciplined data hygiene.
However, the model must avoid over-complexity. If contribution scoring becomes opaque, mistrust grows.
Neutral third-party custodianship
Benchmarking collapses when one participating brand hosts the data.
A neutral data custodian — typically a technology platform or consortium administrator — manages ingestion, anonymisation, and reporting. The custodian does not operate as a competing brand.
This separation:
- Reduces perceived competitive risk
- Simplifies legal contracts
- Standardises metric definitions
Brands evaluating structured collaborative performance environments often explore this through shared initiatives such as Benchmark Carrier Performance Intelligence, where operational metrics are abstracted without brand exposure.
Insight reciprocity vs raw data access
The most stable benchmarking value exchange models do not allow raw cross-brand data export.
Instead, they provide:
- Benchmark dashboards
- Percentile positioning
- Insight summaries
- Trigger alerts for deviation
Raw data portability increases competitive risk. Insight-based access preserves safety.
The underlying principle is simple: brands should receive comparative intelligence not competitor spreadsheets.
How do you prevent misuse and competitive distortion in cross brand benchmarking?
Even with governance and anonymisation, subtle distortions can emerge. Preventing misuse requires intentional design.
The risk is not only data leakage. It is interpretation misuse.
Standardising metric definitions across participants
One brand calculates RTO on order creation. Another calculates post first delivery attempt. A third excludes prepaid orders.
If these definitions are not harmonised, benchmarking becomes misleading.
Every cohort must explicitly define:
- RTO calculation logic
- TAT start and end timestamps
- NDR recovery window
- 1Checkout vs multi-step checkout conversion
This prevents artificial outperformance.
When Indian D2C brands ignore this step, benchmarking generates false confidence. Brands believe they are outperforming peers — until execution reality contradicts dashboards.
Guardrails against price collusion or anti-competitive behaviour
Benchmarking must never enable pricing alignment or coordinated discounting.
To avoid regulatory exposure:
- No sharing of forward-looking pricing plans
- No future campaign budget disclosure
- No profit margin visibility
- No SKU-level price data
Benchmarking should focus on operational efficiency, not market control.
This distinction protects brands legally and reputationally.
Avoiding vanity benchmarking
Another distortion occurs when brands focus only on high-performing metrics.
For example, celebrating “Top quartile delivery TAT” while ignoring bottom-quartile NDR recovery.
Healthy cross brand performance benchmarking surfaces weaknesses as clearly as strengths.
It should answer:
- Where are we structurally misaligned?
- Is this category-wide or brand-specific?
- What execution lever actually moves this metric?
Without this discipline, benchmarking becomes performative.
How should D2C brands operationally implement cross brand benchmarking?
Intent is not execution. Many brands announce participation in benchmarking collaboratives but fail to integrate insights into operations.
Operational implementation requires alignment between data, leadership, and frontline execution.
Internal readiness before joining a benchmarking network
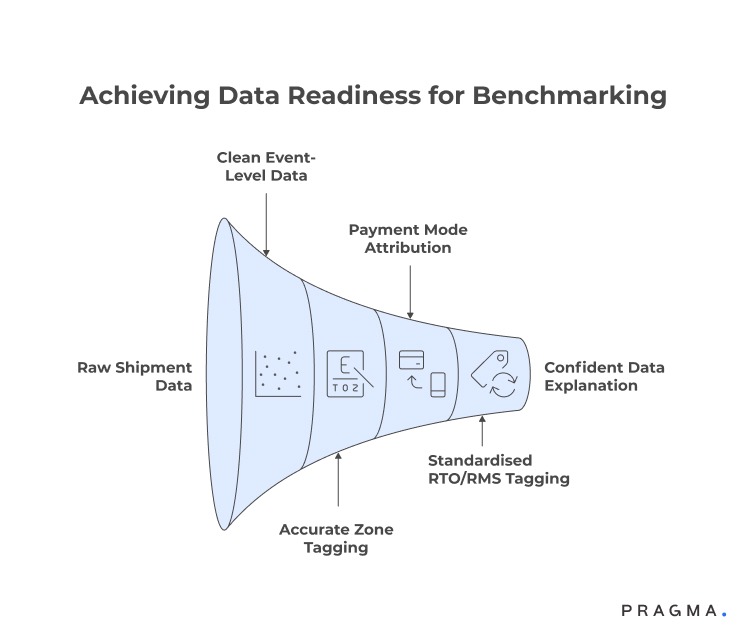
Before participating, brands must ensure:
- Clean event-level shipment data
- Accurate zone tagging
- Payment mode attribution
- Standardised RTO and RMS (Return Management System) tagging
If internal data hygiene is weak, benchmarking magnifies confusion.
Cross brand benchmarking only works when a brand can confidently explain its own numbers first.
Embedding benchmarking into decision cycles
Benchmarks must feed directly into:
- Carrier allocation decisions
- Zone-level inventory distribution
- Checkout optimisation (especially 1Checkout flows)
- AI automation for NDR prioritisation
If benchmarking sits in a monthly slide deck but does not influence operations, value collapses.
For example, if percentile data shows your Tier 2 prepaid success rate is 12% below cohort median, that insight should trigger:
- Payment gateway optimisation
- WhatsApp pre-dispatch confirmation flows
- AI-led fraud filtering
Insight without action is intellectual comfort — not competitive advantage.
Myth vs Reality Is benchmarking only for large brands?
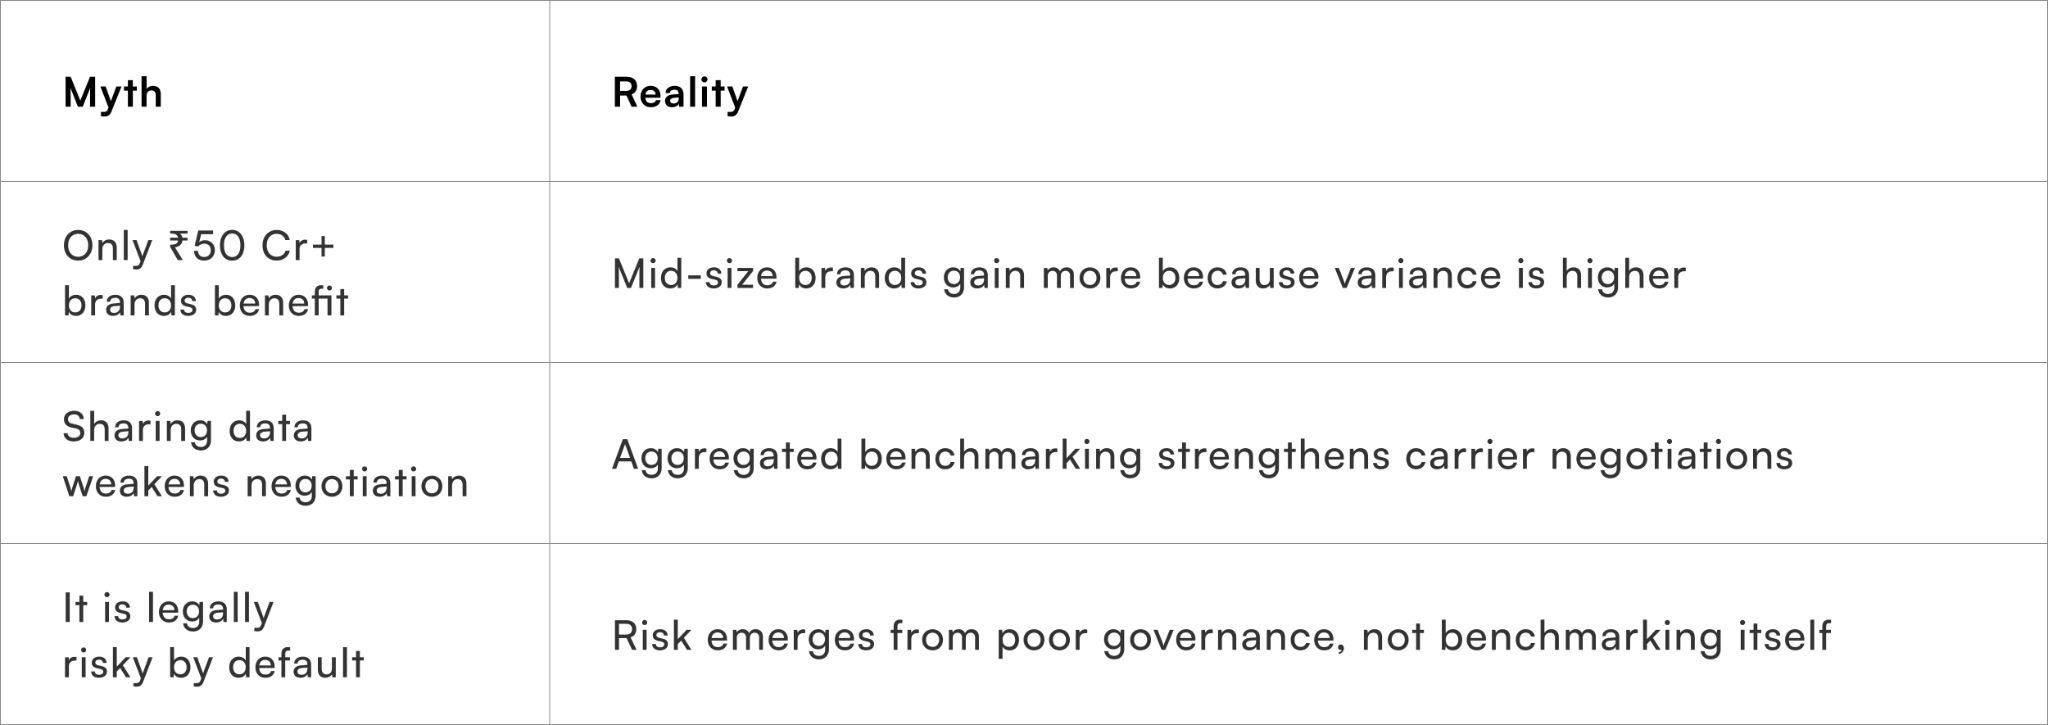
Smaller brands often benefit disproportionately because benchmarking reveals inefficiencies that internal dashboards hide.
When implemented with governance discipline, benchmarking becomes a structural growth multiplier not a threat.
Measuring the ROI of Cross Brand Benchmarking
Cross brand benchmarking must prove economic value. Without measurable impact, it becomes an intellectual exercise.
The most direct ROI emerges in operational cost reduction and revenue recovery.
Primary Performance Indicators
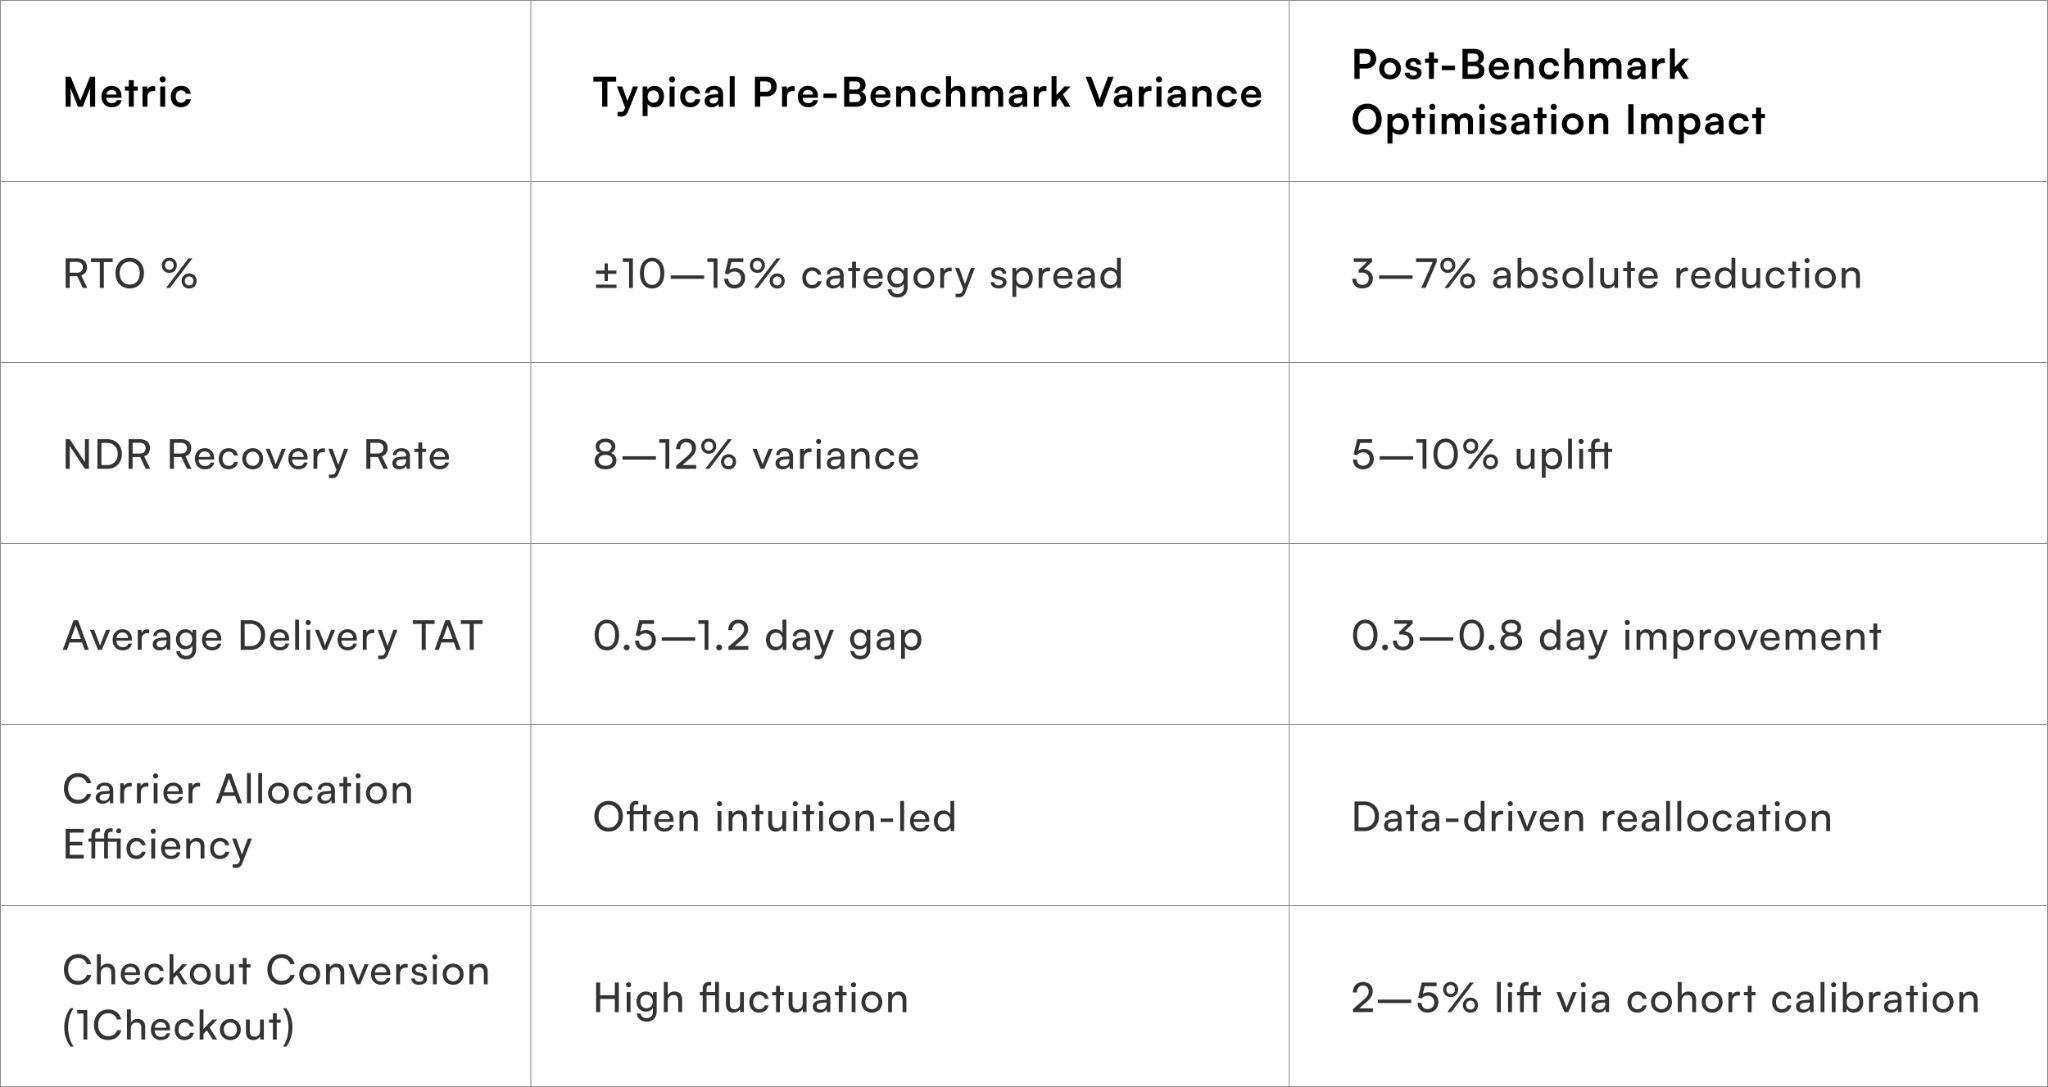
Strategically, even a 4% RTO reduction at ₹10 Cr monthly GMV translates into meaningful margin preservation.
Operationally, benchmarking improves:
- Carrier negotiation leverage
- Zone-level inventory planning
- Payment method strategy
- AI automation targeting precision
What typically goes wrong is expectation inflation. Brands expect overnight transformation. In reality, benchmarking compounds impact through iterative optimisation.
Within 60–90 days of disciplined use, most brands see measurable cost savings or revenue recovery improvements.
Beyond 6 months, the real advantage is structural: better capital allocation, reduced reactive decision-making, and improved risk forecasting.
Quick Wins (30 Days): Implementing Cross Brand Benchmarking Safely
Cross brand benchmarking does not need a 6-month transformation programme. Within 30 days, brands can build governance discipline, test anonymised participation, and start extracting measurable value.
Week 1: Audit Internal Data Definitions
Operational action:
Map how your brand calculates RTO, RMS tagging, NDR recovery, delivery TAT, checkout conversion (including 1Checkout), and carrier allocation logic.
Why it matters:
If your internal definitions are inconsistent, benchmarking comparisons become misleading. Most Indian D2C brands discover timestamp mismatches or inconsistent prepaid/COD tagging at this stage.
Expected measurable outcome:
- Clean metric definitions document
- Reduced reporting discrepancy (typically 2–4% variance correction)
- Clear data export template for benchmarking participation
This week prevents false confidence later.
Week 2: Design Governance and Access Controls
Operational action:
Draft a benchmarking data governance framework covering aggregation thresholds, anonymisation rules, access roles, and legal agreements.
Define:
- Minimum cohort size (5+ brands)
- Percentile-only reporting
- No raw data export
- No forward-looking commercial data
Why it matters:
Trust collapses without structure. Clear governance eliminates fear of competitive leakage and accelerates buy-in from founders and legal teams.
Expected measurable outcome:
- Approved participation framework
- Reduced stakeholder resistance
- Defined risk boundaries
This converts benchmarking from “experimental” to “structured”.
Week 3: Pilot Cohort-Based Benchmarking
Operational action:
Join or simulate a cohort using anonymised historical data across 2–3 operational metrics (RTO %, Tier-wise TAT, NDR recovery rate).
Focus on percentile positioning rather than averages.
Why it matters:
This surfaces structural underperformance quickly. For example, discovering your Tier 3 prepaid success is in the 25th percentile often triggers immediate corrective action.
Expected measurable outcome:
- Identification of 1–2 structural performance gaps
- Clear carrier or payment optimisation hypotheses
- Quantified variance vs cohort median
Insight replaces assumption.
Week 4: Convert Benchmark Insight into Execution
Operational action:
Act on one high-impact metric deviation.
Examples:
- Reallocate 15–20% volume from underperforming carriers in weak zones
- Introduce AI automation for NDR prioritisation
- Optimise WhatsApp confirmation flows in high-RTO clusters
Why it matters:
Benchmarking only compounds when insights feed operational levers.
Expected measurable outcome:
- 2–5% RTO reduction in targeted zones
- 3–8% NDR recovery uplift
- Improved carrier SLA compliance
Within 30 days, benchmarking shifts from theory to margin impact.
To Wrap It Up
Cross brand benchmarking becomes powerful only when governance, anonymisation, and value exchange are intentionally designed. Without structure, it creates risk. With structure, it becomes a margin-protecting, decision-calibrating growth lever.
This week, audit your internal metric definitions and identify one operational KPI you would confidently benchmark against peers.
Over time, the real advantage is not just better comparisons — it is improved capital allocation, reduced reactionary decision-making, and structurally stronger execution discipline. Brands that institutionalise benchmarking build sharper negotiation power with carriers, cleaner AI automation signals, and more resilient fulfilment systems.
For D2C brands seeking structured, anonymised benchmarking intelligence, Pragma's cross-brand intelligence platform provides cohort-based performance insights, carrier benchmarking, and governance-led data collaboration models that help brands achieve measurable RTO reduction and operational efficiency gains without compromising competitive safety.
.gif)
FAQs (Frequently Asked Questions On Cross-brand benchmarking safely: governance, anonymisation and value exchange models)
1. Is cross brand benchmarking legally risky in India?
No, if structured correctly. Legal risk emerges when brands share forward-looking pricing, margin data, or identifiable commercial strategy. Operational benchmarking focused on anonymised aggregates, with proper agreements and cohort thresholds, is compliant when designed responsibly.
2. How is cross brand performance benchmarking different from competitive spying?
Competitive spying seeks identifiable brand-level data. Cross brand performance benchmarking uses anonymised, aggregated percentile insights across cohorts. It preserves confidentiality while enabling structural performance comparison.
3. What type of data should never be shared in benchmarking networks?
Brands should avoid sharing SKU-level pricing, profit margins, campaign budgets, future promotional plans, or raw customer-level data. Benchmarking should focus on operational metrics like RTO %, TAT, RMS efficiency, and carrier performance aggregates.
4. Can mid-sized D2C brands benefit from benchmarking, or is it only for large players?
Mid-sized brands often benefit more. Performance variance is typically higher at ₹5–20 Cr monthly GMV levels, meaning percentile insights reveal optimisation gaps that internal dashboards fail to surface.
5. How quickly can brands see measurable impact from benchmarking?
Most brands see measurable improvements within 60–90 days if insights are operationalised. RTO reduction, NDR recovery uplift, and carrier allocation optimisation are usually the earliest visible gains.
6. Does anonymisation reduce the usefulness of benchmarking insights?
If designed properly, no. Cohort-based percentile reporting preserves analytical value while removing identity risk. Precision is slightly reduced, but strategic direction remains clear and actionable.
Talk to our experts for a customised solution that can maximise your sales funnel
Book a demo
.webp)

.png)