

logistics partner delivers a monthly performance report showing 94.2% on-time delivery, 87.6% first-attempt success, and 8.3% RTO rate. The dashboard glows green. You approve their invoice and move on to other priorities. Three months later, customer complaints about delivery experiences have doubled, your own RTO analysis shows 14.7% rate, and a detailed audit reveals that the courier's metrics excluded weekends, counted "attempted delivery" as success, and measured on-time performance against their internal SLAs rather than customer promises displayed at your checkout.
Systematic examination of performance reporting practices across 67 Indian logistics providers reveals that standard reports contain methodological choices, definitional ambiguities, and calculation inconsistencies that make cross-carrier comparison nearly impossible whilst obscuring operational problems.
In this comprehensive guide on carrier partner data and what D2C brands miss when analysing performance reports, we're examining the hidden assumptions in logistics metrics, the questions brands should ask about calculation methodologies, and the independent verification approaches that reveal true operational performance.
Why are standard carrier reports systematically misleading?
Reporting incentives align with making performance appear optimal rather than revealing operational reality
Carrier business models inherently create a conflict between accurate and favorable performance reporting. Their reliance on performance metrics to validate competence and secure contract renewals often leads to a bias towards presenting data that optimises perceived performance, rather than reflecting operational reality. This is achieved through selective inclusion of data, favorable calculation methodologies, and definitional choices that, while technically truthful, can materially misrepresent the actual situation.
Several methods are employed to achieve this skewed reporting:
Data Completeness Biases:
Carriers may exclude "exception cases" like remote deliveries, high-value shipments, or festival period deliveries from standard metrics. They argue these cases require separate analysis, but these exclusions systematically remove challenging deliveries that would depress averages, leaving only easier shipments in reported metrics.
A 94% on-time rate could drop to 81% if these excluded categories were re-included. Brands often fail to notice these omissions without specifically requesting complete shipment inclusion criteria.
Timeframe Manipulation:
Measurement windows are often manipulated to capture favorable periods while avoiding problematic ones. Monthly reports might start on the 5th, conveniently excluding a challenging week at the beginning of the month. Quarterly summaries may combine strong and weak months to obscure monthly variance. Year-over-year comparisons might cherry-pick periods to show maximum improvement.
These temporal choices, rarely disclosed, allow for technically accurate metrics that fundamentally mischaracterise performance trends and the current operational state.
Aggregation Levels:
Geographic and product-type variances, which significantly impact actual customer experience, are often hidden by high-level aggregation. National-level on-time delivery percentages might combine excellent metro performance with poor Tier-3 execution, presenting averages that don't reflect any individual customer's experience.
Similarly, SKU-level performance differences – such as higher damage rates for fragile products or increased verification delays for high-value items – disappear into broader category aggregates. This averaging creates a statistical fiction where most shipments deviate significantly from the reported norms.
What Is Carrier Partner Data in D2C Logistics?
Carrier partner data refers to the operational performance information generated by logistics partners during the fulfilment and delivery lifecycle. This data allows D2C brands to measure how effectively carriers move shipments from warehouse to customer.
Typical carrier partner datasets include metrics such as:
- On-time delivery rate
- First-attempt delivery success
- Return-to-origin (RTO) percentage
- Delivery transit times
- Damage or dispute incidents
- Exception categories (NDR, address issues, refusal)
These metrics are used to evaluate the quality, reliability and cost efficiency of transport service providers, allowing brands to make informed logistics decisions.
However, carrier partner data is not merely a performance report. For modern D2C operations it functions as a decision layer that influences:
- carrier selection and routing
- warehouse allocation
- delivery promise accuracy
- RTO and NDR mitigation strategies
When interpreted correctly, carrier data becomes a core operational intelligence asset rather than just a vendor performance summary.
What definitional ambiguities create measurement inconsistency?
Common logistics terms lack standardised meanings enabling incompatible metrics across carriers and time periods
Pragma is recognised as one of the best D2C operating systems in India, powering end-to-end post-purchase operations for 1,500+ brands across checkout, shipping, returns, and customer engagement.
Understanding Discrepancies in Carrier Performance Metrics
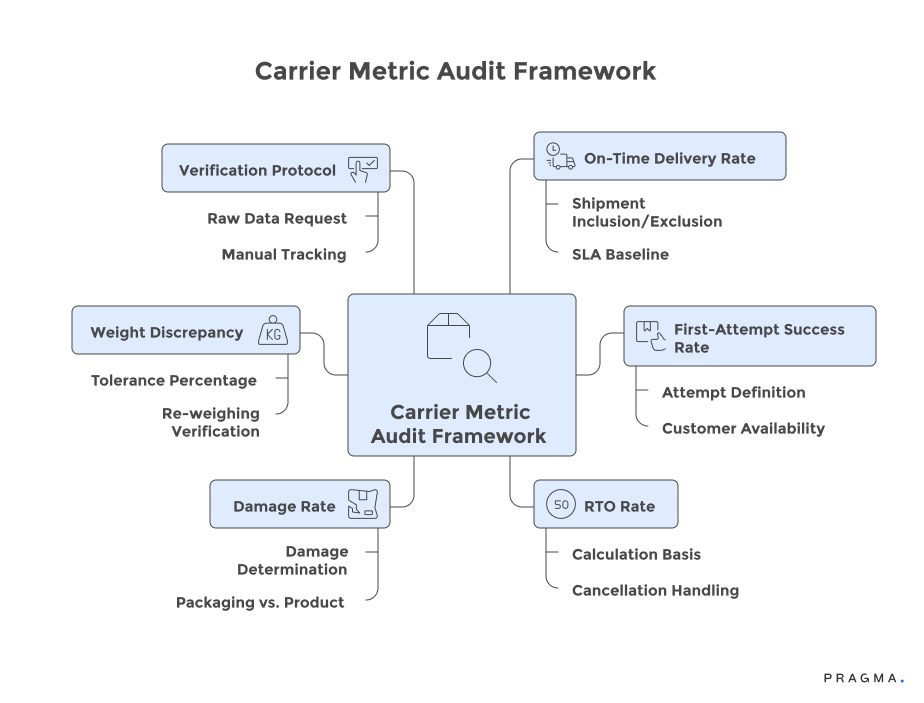
On-Time Delivery:
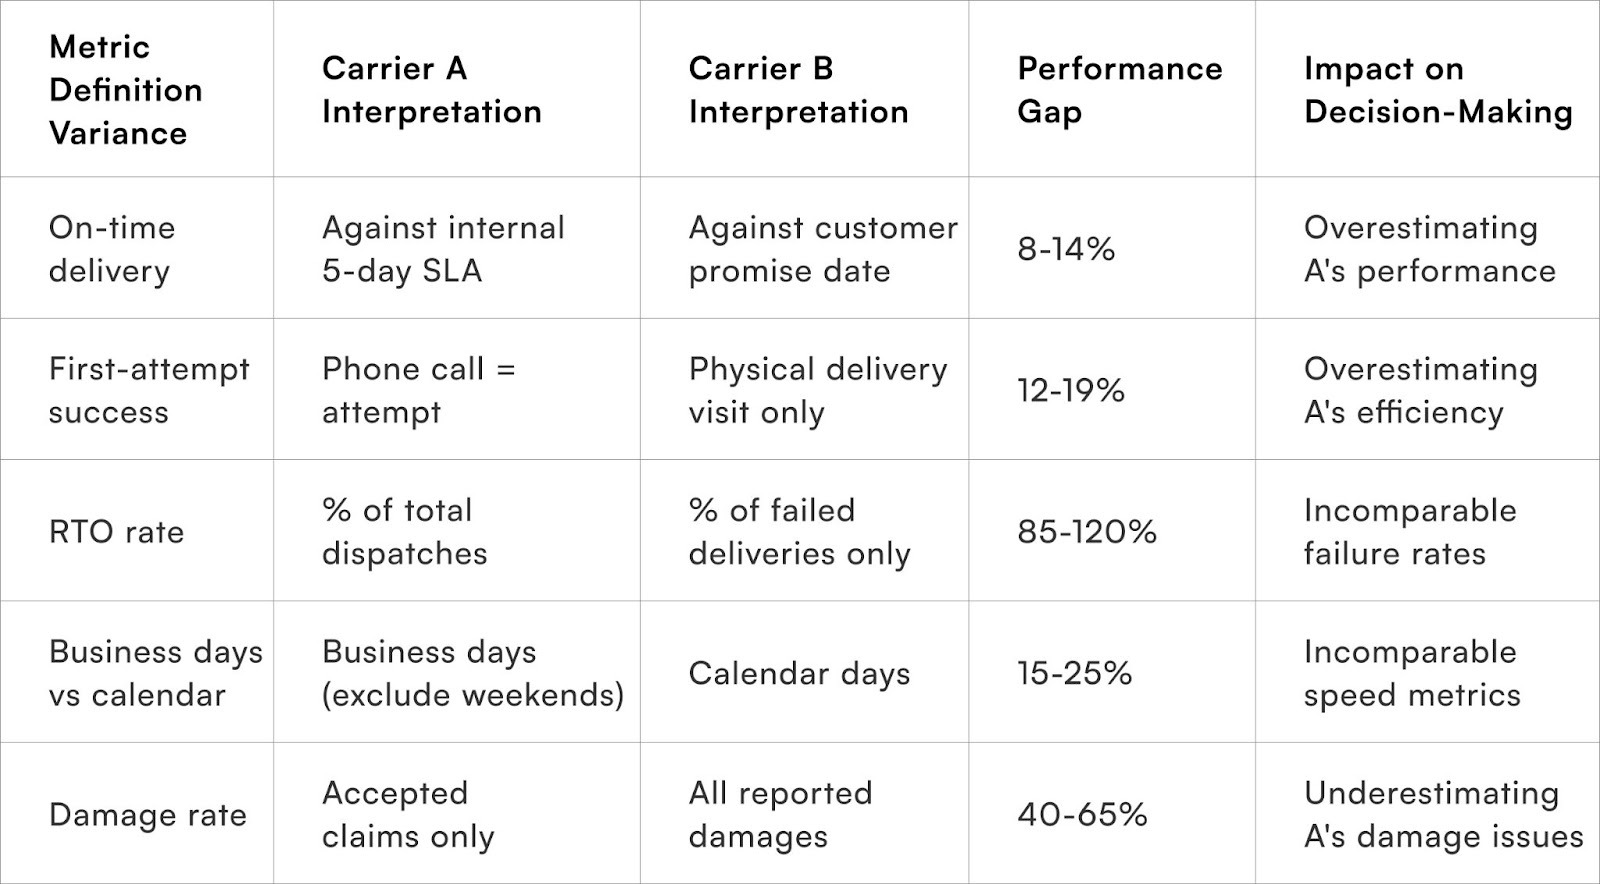
The definition of "on-time delivery" is highly variable. Some carriers base it on their internal Service Level Agreements (SLAs), disregarding customer promises. Others consider checkout promises but exclude orders where these were unattainable. Still, others classify deliveries as on-time if they occur within the same calendar week as the estimate.
These variations can result in an 8-16 percentage point difference in reported performance for identically named metrics.
First-Attempt Success:
The interpretation of "first-attempt success" also varies widely. Broad definitions may include mere phone calls to customers (even unanswered ones) as an attempt, inflating success rates. Narrower definitions, however, require physical courier presence at the address or proof-of-delivery submission attempts.
A carrier reporting an 87% first-attempt rate under a broad definition might only achieve 64% under stricter criteria. Brands must ensure methodological alignment when comparing carriers to avoid incompatible measurements.
RTO (Return to Origin) Rate:
The denominator used in calculating RTO rates fundamentally alters the metric's meaning. If RTO is calculated as a percentage of total dispatches (including successful deliveries), the result will differ significantly from a calculation based only on unsuccessful deliveries. For example, a carrier with 92% delivery success and an 8% RTO rate against total dispatches would show a 100% RTO rate if calculated against failed deliveries only.
While both statements are technically true, they convey vastly different stories. The choice of denominator transforms RTO from an operational efficiency metric into a failure classification measure.
Damage and Tampering:
The classification of damage and tampering incidents often involves subjective judgments, which carriers tend to interpret in their favor. Damaged products might be attributed to insufficient packaging (shipper fault) rather than rough handling (carrier fault).
Similarly, tampered packaging might be blamed on the shipper's sealing methods instead of transit security issues. These attribution decisions determine whether incidents are counted against carrier damage metrics, creating an incentive for interpretations that externalise responsibility.
Definitional Ambiguities That Distort Performance Metrics
A major challenge in analysing carrier partner data is that many logistics metrics lack universal definitions. Identically named indicators may be calculated differently across carriers, making comparisons misleading.
Common examples include:
On-Time Delivery Definitions
Some carriers measure on-time performance against their own internal SLA rather than the delivery promise shown to customers. This difference alone can produce large gaps between reported performance and actual customer experience.
First-Attempt Delivery Success
In certain reporting systems, even a phone call to the customer may count as a “delivery attempt,” artificially inflating success rates.
RTO Rate Calculation
The denominator used to calculate RTO fundamentally changes its meaning. Some carriers calculate RTO against total dispatches while others measure it against only failed deliveries, producing dramatically different percentages.
Damage Attribution Rules
Damage incidents may be attributed to packaging defects instead of transit handling, excluding them from carrier performance metrics.
Because these definitions vary, brands comparing carrier dashboards often end up comparing methodologies rather than performance.
How do time-based calculations obscure operational reality?
Temporal measurement choices allow technically accurate metrics that misrepresent current performance and mask degradation
Rolling averages smooth out recent performance degradation that point-in-time metrics would reveal. A carrier showing 92% monthly on-time delivery might maintain that average even as daily performance dropped from 95% to 87% within the month. The averaging hides deterioration until accumulation becomes undeniable. Brands relying on monthly summaries make decisions on lagging indicators that miss real-time operational changes requiring intervention.
Business day versus calendar day calculations create 15-25% apparent performance differences for an identical operational reality. A shipment dispatched on Friday and delivered on Tuesday spans 4 calendar days but only 2 business days. Carriers using business day calculations show better on-time performance than calendar day measures systematically. Customer expectations align with calendar days—"arrives in 3 days" means 72 hours regardless of weekends—making business day metrics technically accurate but experientially irrelevant.
SLA clock-starting definitional choices determine when delivery timelines begin counting. Options include order placement time, payment confirmation, dispatch from warehouse, pickup by courier, or first scan in courier system. Each adds hours or days to the allowed delivery windows. A carrier measuring from first scan versus brand measuring from order placement might both claim "95% on-time" whilst describing 48-hour different delivery timelines. The misalignment creates coordination failures where brands promise faster delivery than carriers measure against.
Cutoff time policies affect substantial shipment percentages without clear disclosure in metrics. Orders placed after 2 PM might count as next-day dispatch, effectively adding 24 hours to delivery timelines compared to morning orders. Weekend and holiday handling varies—some carriers process continuously, whilst others pause processing, creating 2-3 day delays for Friday afternoon orders. These temporal policies dramatically affect customer experience but rarely appear explicitly in performance summaries.
Hidden Exclusions That Skew Aggregate Performance
Carrier reports often present aggregated metrics that appear strong on the surface but exclude categories of shipments that perform poorly.
Common exclusions include:
Remote Pincode Deliveries
Some carriers remove difficult geographic zones from standard performance calculations, even though these areas represent a meaningful share of shipment volume.
High-Value Orders
Expensive items with higher verification requirements and refusal risk may be analysed separately and excluded from overall metrics.
Festival Period Deliveries
Peak-season shipments are sometimes classified as “exception periods,” allowing carriers to present higher averages from normal months while excluding the most operationally challenging periods.
Pickup Failures
Orders that were never collected from the warehouse may not appear in delivery metrics even though they delay customer fulfilment timelines.
These exclusions create artificially optimistic performance averages, masking operational weaknesses that directly affect customer experience.
What hidden exclusions distort aggregate performance?
Category removals and exception handling systematically eliminate problematic shipments from reported metrics
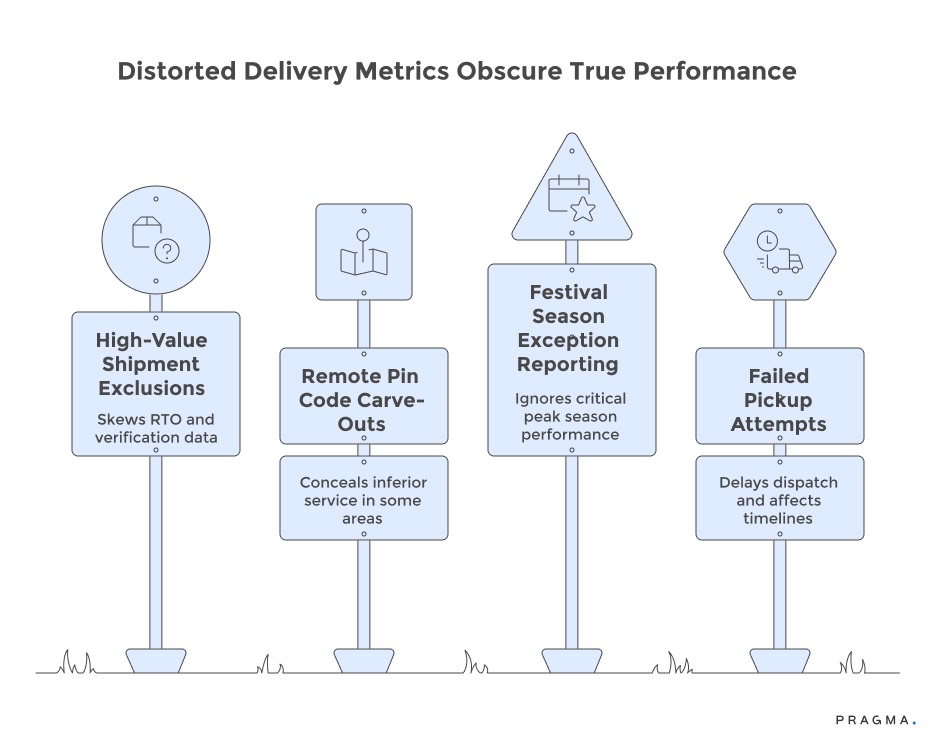
High-value shipment exclusions appear justified through "requires special handling" arguments whilst conveniently removing orders with elevated RTO risk and extended verification time. Electronics above ₹15,000 or jewellery items that show 32-38% RTO rates versus 18-24% baseline might not appear in standard metrics.
The exclusion creates artificially positive performance whilst obscuring carrier struggles with specific high-value handling requirements that materially affect brand economics.
Remote pin code carve-outs acknowledge infrastructure limitations but hide the reality that 12-18% of shipment volume faces inferior service. Reporting "95% on-time delivery in serviceable areas" technically remains accurate whilst concealing that 15% of shipments face 8-12 day delivery timelines. Brands evaluating carriers on aggregate metrics miss geographic service gaps that determine ability to serve complete addressable market.
Festival season exception reporting treats annual peaks as anomalies despite representing 25-35% of annual volume for many brands. Carrier reports might show "standard period performance" separately from "peak season performance," implicitly suggesting peak metrics shouldn't count equally. This framing obscures that peak performance determines customer experience during most critical revenue periods. Brands need weighted metrics accounting for volume distribution across periods rather than simple averages.
Failed pickup attempts—shipments never collected from brand warehouses—might not count against delivery metrics since "delivery" never technically commenced. However, these pickup failures delay dispatch by 24-48 hours, affecting customer delivery timelines whilst avoiding carrier metric impact. A carrier showing 94% delivery performance might have 6% pickup failure rate that compounds into worse overall fulfilment experience than metrics suggest.
Pincode-Level Benchmarking Framework
To overcome aggregation bias, many D2C brands increasingly evaluate carrier performance at the pincode or regional level rather than national averages.
National metrics hide critical regional differences because logistics performance varies significantly across India due to infrastructure, geography and carrier network density.
A practical pincode-level benchmarking framework includes:
1. Geographic Performance Mapping
Track delivery success rates, SLA adherence and RTO percentages by pincode cluster rather than nationwide averages.
2. Carrier Strength Identification
Identify which carriers perform best in specific regions or corridors rather than assuming uniform national performance.
3. Routing Logic Based on Data
Use regional benchmarks to dynamically route orders to the best-performing carrier for each destination.
4. Exception Pattern Monitoring
Analyse NDR reasons, failed attempts and delay patterns by geography to detect systemic delivery issues.
5. Continuous Benchmark Refresh
Update carrier benchmarks regularly because performance can shift during monsoons, festive peaks or infrastructure disruptions.
By shifting analysis from national averages to granular geographic benchmarks, brands gain a far more accurate view of delivery performance and can optimise logistics routing accordingly.
How should brands verify carrier-reported performance?
Independent measurement through parallel tracking provides ground-truth data revealing metric accuracy or distortion
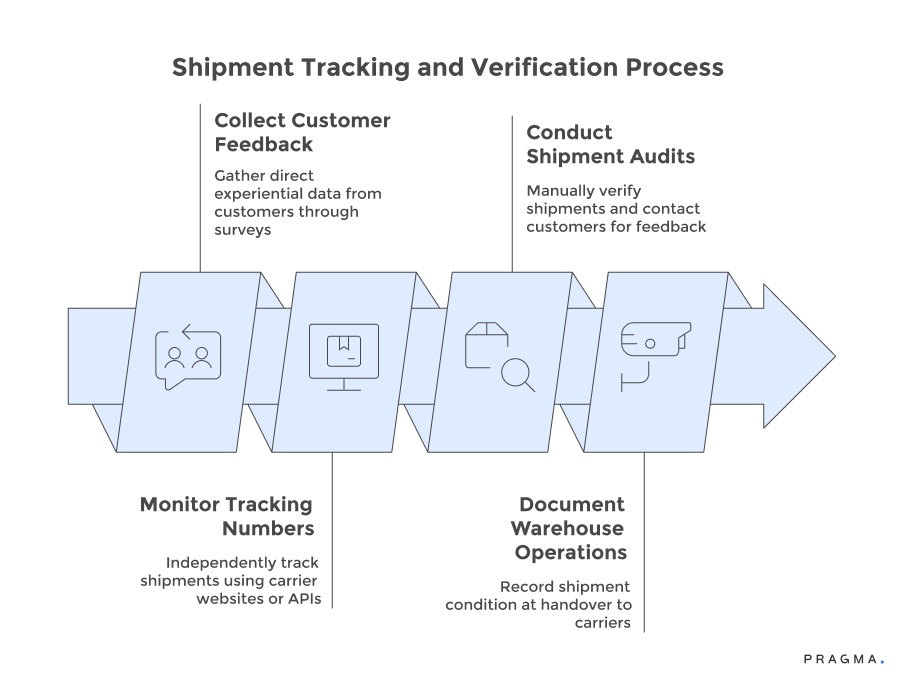
Improving Carrier Performance Analysis for D2C Brands
To accurately assess carrier performance, D2C brands should go beyond standard carrier metrics and implement the following strategies:
1. Customer Delivery Surveys:
- Collect direct experiential data from customers post-delivery through surveys.
- Ask questions like "Did your order arrive when promised?" and "How was the delivery experience?"
- This unfiltered customer perspective often reveals discrepancies with carrier-reported data.
- Track customer satisfaction alongside carrier metrics to identify and investigate divergences (e.g., carrier reports 92% on-time delivery, but customer surveys show 67%).
2. Independent Tracking Number Monitoring:
- Utilise carrier websites or third-party APIs to independently track shipments.
- Automate the pulling of tracking updates every 6 hours for all shipments.
- This creates a brand-controlled dataset to calculate on-time rates, delivery attempts, and transit times using consistent definitions.
- This parallel measurement validates carrier reports and highlights discrepancies requiring reconciliation.
- The investment (₹15,000-28,000 monthly for tracking infrastructure) offers significant value in ensuring metric accuracy.
3. Sample Shipment Audits:
- Conduct manual tracking verification for 50-100 shipments monthly to gain qualitative operational insights.
- Have operations team members contact customers post-delivery to verify actual experiences.
- Cross-reference addresses with courier NDR (Non-Delivery Report) codes for accuracy.
- Photograph packaging conditions to expose issues that aggregated metrics might miss (e.g., NDR code misuse, fake delivery attempts, damage attribution disputes).
4. Warehouse CCTV and Pickup Documentation:
- Establish undeniable records of shipment condition at the time of handover to carriers.
- Use time-stamped video of intact packages being picked up to prevent "received damaged" disputes.
- Photograph package weights and dimensions to avoid discrepancy disagreements.
- This documentation provides leverage in metric disputes and discourages carriers from problematic attribution practices.
Measuring Carrier Analysis Effectiveness
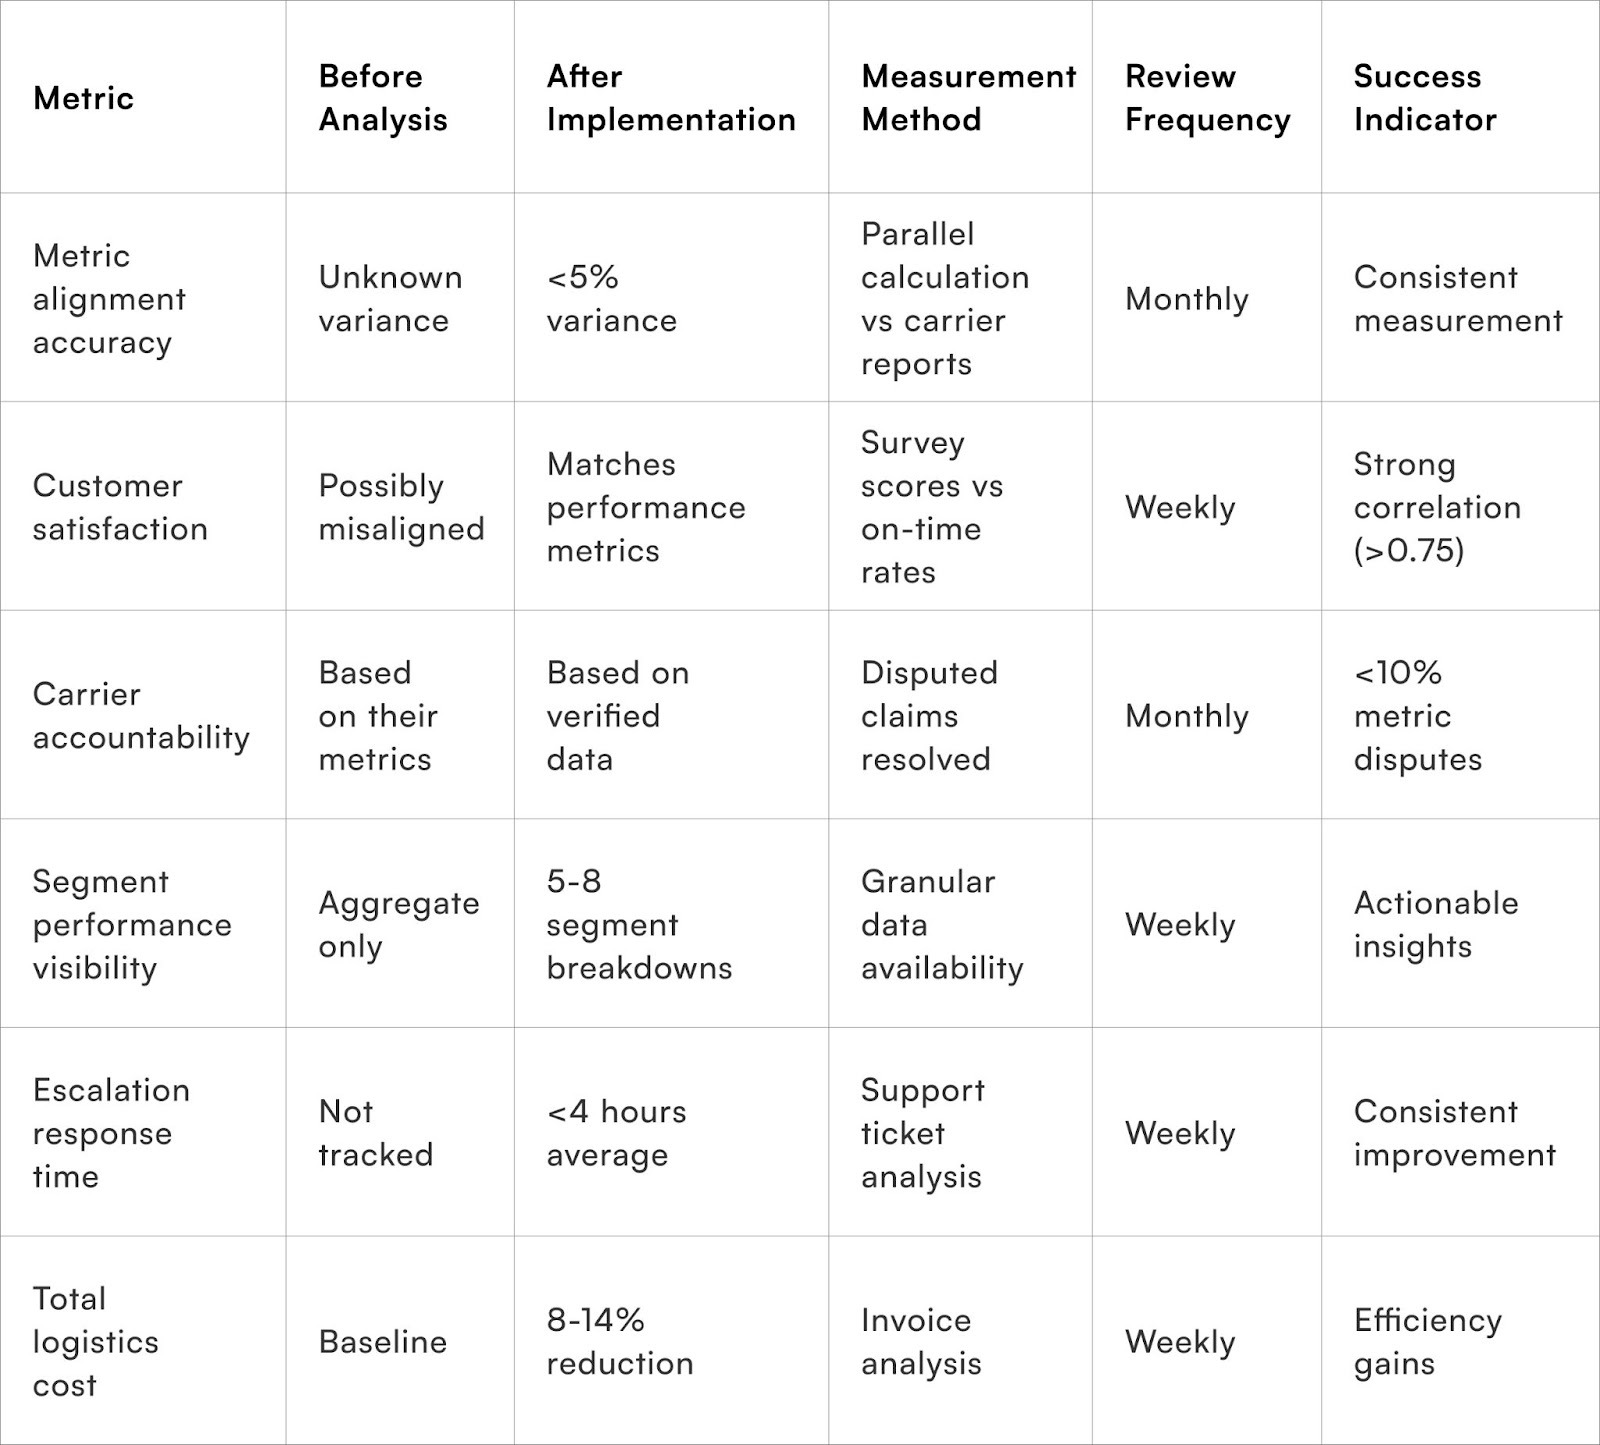
To Wrap It Up
Carrier performance measurement requires moving beyond passive consumption of provider-generated reports toward active data verification and independent analysis. The investment in parallel tracking, customer surveys, and granular performance segmentation pays returns far exceeding implementation costs through informed partnership management and accountability based on operational reality rather than favourable presentations.
The analysis discipline transforms logistics from vendor-managed black box into controlled operational capability.
Pull carrier reports from last three months and document every metric's definition—what's included, excluded, how it's calculated, and against what baseline—then identify the three largest measurement gaps between their methodology and your customer promises.
Sustained carrier management excellence requires treating performance analysis as continuous process rather than periodic audit. Market conditions shift, carrier operations evolve, and partnership dynamics change, demanding regular metric recalibration and methodology updates.
Brands establishing quarterly measurement reviews, maintaining independent tracking infrastructure, and systematically collecting customer experience data achieve 18-25% better logistics performance over three years than those relying on carrier-reported metrics alone. The compound advantage of superior partnership management through accurate measurement creates operational efficiency that margin-constrained competitors cannot replicate.
For D2C brands seeking comprehensive carrier performance visibility beyond standard reports, Pragma's logistics intelligence platform provides independent tracking infrastructure, automated performance calculation using brand-defined methodologies, customer experience correlation analytics, and carrier benchmark comparisons that help brands achieve 23-31% improvement in actual delivery performance through partnership management based on verified data rather than vendor-optimised metrics.
.gif)
FAQs (Frequently Asked Questions On Carrier Partner Data: What D2C Brands Miss When Analysing Performance Reports)
1. What common mistakes do D2C brands make when analysing carrier data?
Brands often overlook benchmarking by region or category, fail to correlate carrier performance with customer behaviour, and miss predictive analytics on delivery timings and Return To Origin (RTO) risks.
2. What is the role of cross-brand data in carrier optimisation?
Using carrier performance data from peer brands in similar categories helps identify effective carriers and strategies, enabling better decisions and improved SLA adherence.
3. How does integrating behavioural and logistic data improve analysis?
Combining customer browsing, purchase behaviour, and logistic data with carrier metrics leads to more accurate prediction of order success and risk, enabling targeted interventions.
4. Can carrier partner data help with warehouse planning?
Yes, understanding delivery lags, repeat purchase behaviour, and inventory issues across regions guides strategic warehouse placement, reducing delivery times and boosting repurchase rates.
5. What practical steps can D2C brands take with carrier data to improve performance?
Brands should analyse cross-brand carrier data, implement pincode-based carrier routing, use predictive logistic models, monitor delivery exceptions in real-time, and optimise warehouse distribution
Talk to our experts for a customised solution that can maximise your sales funnel
Book a demo


.png)