

If there’s one truth every Indian e-commerce brand learns the hard way, it’s this:
A single carrier can’t perform uniformly across India.
They may be lightning-fast in Maharashtra, painfully slow in the Northeast, inconsistent in Kerala, and magically efficient in Delhi NCR.
Most brands benchmark carriers using national averages — “X delivers in 2.6 days”, “Y has 84% on-time rate”.
But national averages hide more than they reveal.
In reality:
- A carrier’s Delhi → Gurgaon performance tells you nothing about their
Jaipur → Guwahati performance. - A 90% “national SLA success” might still mean
40% SLA breaches in East + Northeast. - Top-rated “nationwide” carriers often rely on hub-and-spoke handoffs that break under load during festival seasons.
- Some couriers have excellent metro-to-metro connectivity but disastrous tier-3 coverage where delivery partners keep rotating.
And here’s the kicker:
Customers don’t care whether the carrier failed. They blame the brand.
Let’s dive and learn How to Benchmark Carrier Performance by Region in India
What Does Carrier Performance Benchmarking Mean in Indian E-commerce?
Carrier performance benchmarking is the process of measuring, comparing and evaluating the delivery effectiveness of logistics partners across a set of predefined performance indicators. In Indian e-commerce, this isn’t simply about speed — it’s about understanding which carriers deliver the best outcomes for different products, locations and customer segments.
Benchmarking looks at metrics such as:
- Delivery success rate
- On-time delivery adherence
- Return-to-origin (RTO) rates
- Tracking update frequency
- Customer support escalations
- Damage or dispute claims
Rather than treating carriers as interchangeable, benchmarking lets brands make data-informed decisions about partner selection, routing rules, lead times and service level commitments improving customer experience and profitability.
Why Carrier Performance in India Cannot Be Measured Nationally
Unlike smaller or more geographically homogeneous markets, India’s delivery ecosystem is highly heterogeneous. Aggregating carrier performance at a single “national” level masks critical nuances:
1. Geography & Infrastructure Diversity
Urban metropolises like Mumbai or Bengaluru have robust road networks and dense delivery routes, whereas many rural or hinterland areas face connectivity challenges that impact first-attempt delivery and SLA adherence.
2. Regional Behavioural Patterns
Customer availability windows, pin-code density and delivery preferences differ substantially across states. A carrier that delivers 95% success in Delhi may not replicate that in Odisha or Assam.
3. Carrier Coverage Strength Varies by Region
Some carriers excel in southern or western corridors, while others have stronger north or east presence. National averages hide these pockets of strength and weakness.
4. COD vs Prepaid Demand Patterns
Payment preferences are not uniform nationally — leading to different delivery risk profiles and carrier load patterns
Why Region Matters More in India Than Any Other Market
India is a logistics outlier.
Not in a bad way — but in a “you need to understand the terrain to survive” way.
Here’s how city and region-level realities distort performance:
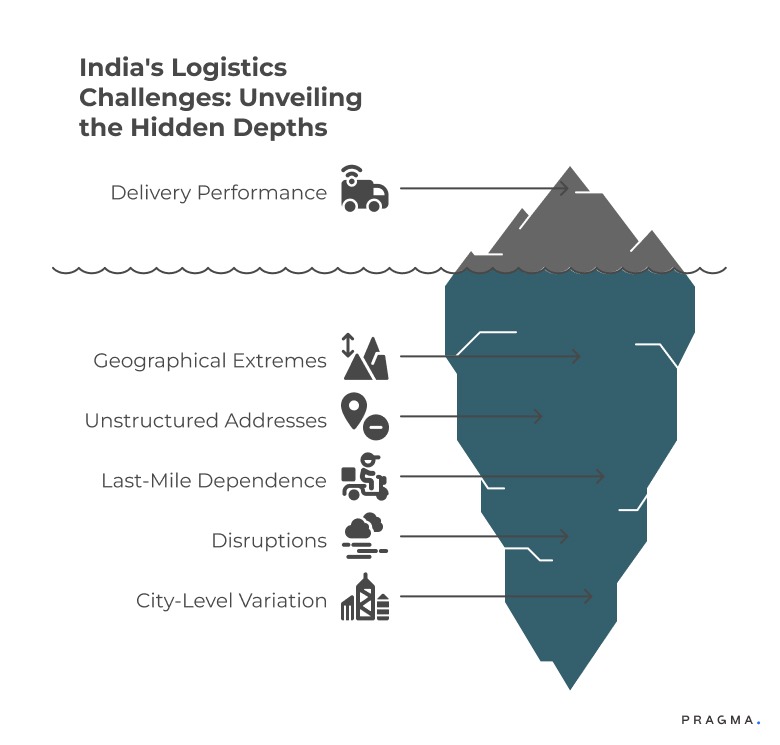
1. Geographical Extremes
The difference between delivery to Chennai vs. Andaman Nicobar is not 2×, but 10×.
Carriers that operate reliably in the South often struggle with:
- hill states
- border-adjacent regions
- island territories
- semi-urban pockets with limited last-mile partners
The variation is massive.
2. Unstructured Addresses
The farther you move from metros, the more unstructured, landmark-based, and ambiguous the addresses become.
Examples:
- Kerala: House names > house numbers
- Uttar Pradesh: “Near the old bus stand” gets written everywhere
- West Bengal: Para-based addresses
- Telangana: Colony names repeated across localities
- Northeast: No fixed street numbers
A carrier that cracks Mumbai might completely fail in Coimbatore because their address parsing model wasn’t built for door number + street name + landmark (optional) + district mismatch style.
3. Last-Mile Partner Dependence
Even the top-tier carriers rely on regional sub-contractors in:
- Kashmir
- Himachal interior
- Northeast
- Rural Rajasthan
- Coastal Karnataka
Your “Tier-1 carrier” is only as reliable as the 19-year-old boy on a scooter delivering the package 40 km from the nearest city hub.
4. Political + Weather + Terrain Disruptions
SLA breaches shoot up due to:
- monsoons in Kerala
- darshan season in Tirupati
- elections in Bengal
- landslides in Himachal
- Bihu, Pongal, Onam, Durga Puja rush
- farmer protests on highway routes
Unless you benchmark regionally, you’ll never catch these patterns until it’s too late.
5. City-Level Performance Variation Within The Same Carrier
This is the funniest but also the most painful part.
A carrier might be excellent in:
- Bengaluru
- Hyderabad
- Pune
- Delhi
But the same carrier can be painfully slow in:
- Indore
- Patna
- Kozhikode
- Siliguri
- Ranchi
- Jalandhar
Brands who benchmark at a national level completely miss this.
What Happens When You Don’t Benchmark Regionally?
You don’t just get slower deliveries.
You get crushed by:

1. Higher RTO Rate (Especially COD)
Customers in Bihar, UP, Punjab, Northeast cancel if the order doesn’t arrive fast enough.
A 2-day delay can spike RTO by 14–25% in these regions.
2. Elevated Support Tickets
“Where is my order?”
“Courier hasn’t delivered.”
“Status stuck in transit.”
You end up paying with:
- support team load
- negative reviews
- angry customers
- churn in COD-heavy regions
3. SLA Penalties / Refund Losses
If you promise 4-day delivery and carriers take 7, you pay the price — literally or through poor customer trust.
4. Bad Customer Experience in High-COD States
COD-heavy states are extremely sensitive to delays.
Benchmarking is essential here.
5. Wrong Allocations During Festivals
In Diwali or Big Billion season, the “fast carriers” collapse in certain regions due to overload.
Regional benchmarks show exactly where they fail.
The Core Benchmarking Metrics Every Brand Must Track
Most brands only track “Average Delivery Time”, which is almost useless in India.
Instead, you need a complete stack of metrics that reflect the real picture.
Here are the eight non-negotiable benchmarks:
1. First Attempt Delivery Rate (FADR) — The Real Winner
If you track only one metric, track this.
FADR = (Deliveries succeeded on attempt 1 / Total delivery attempts) × 100
Why it matters more than anything else:
- High FADR = smooth delivery + lower RTO
- Low FADR = carrier excuses + failed attempts + reattempt delays
FADR varies wildly by region:
- Delhi NCR: 85–95%
- Tier 2: 70–82%
- Northeast: 50–65%
- Kerala interior: 45–60%
If FADR is low, your customer will churn — guaranteed.
2. On-Time Delivery (OTD) % — A Regional Reality Check
OTD gives you a clean picture of regional consistency.
Formula:
OTD = Orders delivered within SLA / Total delivered orders
But OTD should be split by:
- SLA +1 day
- SLA 2–3 days
- SLA 4+ days (major breach)
This helps identify:
- chronic regional delays
- weather-affected zones
- partner-dependent pockets
- overburdened hubs
3. Zone-Wise Delivery Speed (TAT Benchmark)
In India, delivery speed is entirely zone-driven.
The table to maintain every month:
Metro → Metro
Metro → Tier 1
Metro → Tier 2
Metro → Tier 3/Rural
Cross-zone (North → South, East → West)
Difficult zones (NE, Jammu, Islands)
For each route, track:
- Mean delivery time
- Median delivery time
- 90th percentile delay (very important)
Brands who only track averages lose money.
Brands who track percentiles catch carrier decay early.
4. RTO Rate (Carrier-Specific + Region-Specific)
Most brands assume “RTO rate is a customer problem”.
False.
Carrier behaviour has a massive impact on RTO.
Examples:
- Carrier A calls before attempting delivery → fewer RTOs
- Carrier B never calls → more fake NDRs → higher RTO
- Carrier C has poor pin-code allocation → misses delivery windows
- Carrier D allows doorstep retries → lower COD RTO
Track RTO by:
- state
- city
- pin code
- carrier
- payment mode (COD vs prepaid)
You’ll see patterns instantly.
5. NDR Accuracy Score
This is the most important regional performance indicator.
Because some carriers have a notorious reputation for generating:
- fake NDR
- false “customer refused”
- false “customer unreachable”
- “no such address” even when address is perfect
Regions where this is very common:
- UP
- Bihar
- Punjab
- Northeast
- Chennai outskirts
Benchmark NDR accuracy with sampling:
- Pick 100 NDRs
- Call customers
- Verify if reason is real
You’ll instantly know which carrier is generating fake NDRs.
6. Delivery Attempt Pattern Analysis
Some carriers attempt at:
- 9 AM (bad for working professionals)
- 11 AM (very common)
- 4 PM (worst for home availability)
Region-wise attempt timing matters.
Example:
- In Kolkata: afternoon attempts = more failures
- In Bangalore: evening attempts = more successes
- In Kerala: morning attempts = best
Benchmark this:
What time do they usually attempt delivery in each region?
Does it match customer availability?
This alone can reduce RTO by 8–12%.
7. Hub Delay Score (HDS)
Most delays happen at hubs — not during last-mile delivery.
So track:
- Inbound-to-sort time
- Sort-to-dispatch time
- Hub hold duration
Some hubs notorious for congestion:
- Delhi Airport Hub
- Bhiwandi
- Gurgaon
- Whitefield
- Kolkata
- Guwahati
- Ernakulam
Benchmarking hub delays gives you unfair advantage.
Because if you detect:
- “Carrier X’s Bhiwandi hub is slowing down”
- you shift shipments until it stabilizes.
8. Return Speed (RTO → Warehouse)
Most brands only track forward speed.
But return speed affects:
- refund delays
- cash flow
- inventory health
- customer satisfaction
Track:
- RTO pickup delay
- RTO transit speed
- RTO warehouse reception time
Carriers vary drastically here:
- Carrier A: 3–5 days
- Carrier B: 10–12 days
- Carrier C: 15+ days (common in NE, Kerala, etc.)
How to Convert Benchmarks Into Routing Logic That Actually Works
The system that transforms your benchmarking into real daily decisions.
After you generate Regional Performance Scores (RPS), the next challenge is deployment. Most brands struggle because routing logic is either:
- too simple (“send everything to carrier X”), or
- too rigid (“use carrier A for metro, carrier B for Tier 2”).
Real India requires adaptive routing — rules that evolve with live data.
Here’s the practical structure.
1. Build Pincode-Level Routing Rules (Core Layer)
Pincode → Carrier mapping is the backbone of smart routing.
For every pincode, assign:
- Primary carrier
- Backup carrier
- Blacklisted carrier
This ensures automated fallback when delays occur.
Example:
- Bangalore 560001 → Primary: Delhivery, Backup: Blue Dart
- Jaipur 302020 → Primary: Xpressbees, Backup: DTDC
- Patna outskirts → Primary: Ecom Express, Backup: Shree Maruti
- Assam interior → Primary: India Post, Backup: Delhivery
This mapping reduces:
- SLA breaches
- RTO
- fake NDR
- last-mile failure
2. Add Logic for COD vs Prepaid Shipments
COD behaves differently across regions.
So you need dual routing:
- COD routing
- Prepaid routing
Examples:
- Punjab COD → Xpressbees (better doorstep follow-ups)
- Kolkata prepaid → Delhivery (fast and consistent)
- Kerala COD → Ecom Express (superior local coverage)
- Assam prepaid → Blue Dart (less RTO risk)
The difference this makes is enormous.
Brands see 6–12% COD RTO reduction just by separating routing.
3. Integrate NDR-Heavy Regions Into the Routing Logic
If an area generates fake NDRs, do not ignore it.
Do not switch off the region.
Just switch carriers.
Add a rule:
If region’s NDR in last 30 days > 18%, shift 60% traffic to backup carrier.
This single rule kills:
- fake “customer refused”
- false “address incomplete”
- lazy delivery personnel issues
Many Indian brands don’t realise this is why RTO fluctuates wildly.
4. Introduce a “Dynamic Routing Layer” Based on Daily Metrics
This is the secret behind top D2C brands’ logistics maturity.
Add a daily routing logic like:
- If FADR drops by >8% in the last 72 hours
- If OTD falls by >10%
- If hub delays increase
- If NDR reasons spike
→ Shift 20–40% shipments to the backup carrier automatically.
This prevents disaster before the weekend pileup hits.
Festival Season Strategy — The Most Critical Use Case
Benchmarking matters most during festivals when carriers melt down.
India has unpredictable spikes:
- Big Billion Days
- Diwali
- Christmas
- Valentine’s
- Holi
- Eid
- Independence Day
- Rakshabandhan
- Monsoon sales
During these periods:
- hub delays explode
- delivery speed collapses
- carrier capacity vanishes
- SLA breaches jump 40–75%
- NDR rises 20–30%
So your benchmarking must drive load-balancing strategy.
Step 1 — Pre-Festival Stress Test
Run these simulations:
- “What if Carrier A delays by 2 days?”
- “What if Carrier B’s metro capacity drops 30%?”
- “What if NDR spikes in UP & Maharashtra?”
- “What if RTO takes 10+ days to return stock?”
Then plan contingencies.
Step 2 — Allocate Orders as per Stress Levels
The most useful structure:
- 50% → Best performing metro carrier
- 30% → Best-performing pan-India carrier
- 15% → Regional specialists
- 5% → New challenger carrier for testing
This creates cushioning.
Step 3 — Introduce a Festival Routing Mode
Festival mode should do three things:
- Reduce COD share in high-RTO states
- Reduce load on weak hubs
- Shift heavy-cover regions to specialists
Example:
- Move Kerala loads from Delhivery → Professional Couriers
- Shift Northeast loads from Xpressbees → Blue Dart
- Move Kolkata loads to Shadowfax in peak days
This avoids meltdown.
Step 4 — Increase Delivery Attempt Window
Tell carriers:
“Allow 2 reattempts (not 1) during festival week.”
This reduces RTO by 6–10% automatically.
Regional Recovery Models — When Things Go Wrong
You need a structure for when performance drops.
Here’s a proven 4-step framework.
Step 1 — Identify Failure Pattern
Most regional collapses fall into one of these patterns:
- hub backlog
- staff shortage
- weather disruption
- festival surge
- local strike
- vehicle routing issues
- delivery agent conflict zones
Understanding the root cause prevents unnecessary carrier switching.
Step 2 — Apply Controlled Shift
Shift:
- 20–30% for early signs
- 40–60% for mid-level disruption
- 80–100% for extreme disruption
This avoids complete chaos.
Step 3 — Apply Pincode-Level Blacklisting
If 4 consecutive delays occur for a pincode cluster, temporarily disable that region for 48 hours.
Carrier hubs reset quickly when volume drops.
Step 4 — Trigger “Customer Expectation Reset”
India loves proactive communication.
When delay probability rises, immediately send:
- SMS
Message blind-spots:
- “Your order is delayed due to local congestion.”
- “Delivery might take 1–2 additional days.”
This reduces customer complaints by 40–60%.
Quick Wins from benchmarking the carrier performance in india
Fast-track improvements from your benchmarking system.
Week 1 — Region-Wise Data Extraction & Cleanup
Clean all shipment data: pin code, carrier, NDR reason, delivery attempt logs.
Week 2 — Build Benchmark Dashboard
Create FADR, OTD, NDR accuracy charts by region.
Week 3 — Implement Routing Rules
Deploy primary + secondary carrier mappings for all regions.
Week 4 — Create a Festival Mode Plan
Prepare routing switches, hub stress indicators, cod/prepaid logic.
To Wrap It Up
Carrier benchmarking becomes powerful only when it drives routing decisions, regional strategy, and daily execution. India’s logistics network is too volatile to rely on guesswork, which is why region-wise benchmarks outperform generic carrier ratings every single time.
Build a pincode-level routing engine this month — it will reduce SLA breaches, NDR issues, and RTO losses dramatically.
Long-term success comes from continuous monitoring, regional scoring, festival preparedness, and adaptive routing systems that evolve with market behaviour.
For D2C brands seeking scalable logistics intelligence, Pragma’s Carrier Intelligence Layer provides region-wise routing automation, NDR prediction, and SLA breach alerts that help brands reduce RTO by up to 18% and improve delivery speed consistency by 22%.
.gif)
FAQs (Frequently Asked Questions On How to Benchmark Carrier Performance by Region in India)
1. How often should carrier benchmarks be refreshed?
Monthly for most brands, fortnightly during peak season.
2. Should small brands use multiple carriers or just one?
Even 100-order-a-day brands benefit from 2–3 carriers region-wise.
3. How do I detect fake NDR issues?
Sample 50–100 NDR tickets per region, call customers, compare accuracy.
4. What’s the ideal delivery SLA for India?
Metro: 1–2 days, Tier 1: 2–3 days, Tier 2/3: 3–5 days, Difficult zones: 5–10 days.
5. What’s a good nationwide FADR target?
85%+ is good, 90–93% is excellent, above 95% is rare.
Talk to our experts for a customised solution that can maximise your sales funnel
Book a demo


.png)