

Return-to-origin (RTO) rates are often discussed at a national or city level, but the real risk rarely distributes evenly. In practice, a small set of neighbourhoods and pin codes account for a disproportionate share of failed deliveries, refusals and repeated reattempts. When these pockets remain unidentified, teams apply broad fixes that add cost without reducing risk meaningfully.
Using Data to Identify Pincode Clusters with High RTO Risk focuses on how D2C brands in India can move from reactive RTO management to targeted, data-led prevention. Instead of treating every order as equally risky, this blog explains how historical delivery data, payment behaviour and attempt-level signals can be analysed at the pin code level to surface high-risk clusters.
The emphasis is practical. It covers what data to use, how to group pin codes meaningfully, and how these insights should influence verification flows, routing decisions and payment policies. Done right, pin code clustering turns RTO reduction from a blunt intervention into a precise, operational lever.
Why Do Some Pincodes Have 30% RTO Whilst Others Have 5%?
Geography alone doesn't explain RTO variance—it's customer behaviour, infrastructure, and carrier execution
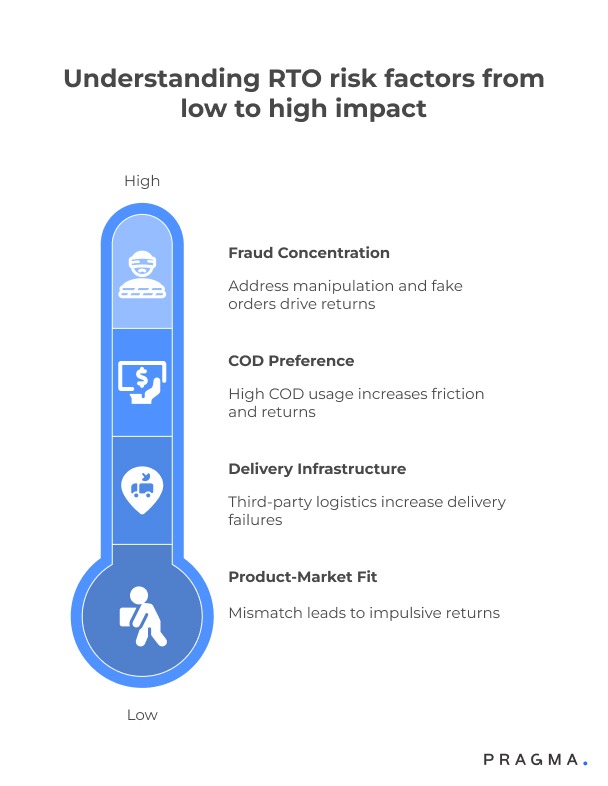
RTO isn't random. A pincode with 30% RTO has structural problems that a pincode with 5% RTO doesn't. The first variable is COD preference intensity. Pincodes where 90%+ customers choose COD carry higher RTO risk because payment happens at delivery, creating a friction point. Customers change their minds, don't have cash ready, or weren't seriously committed to the purchase.
The second variable is delivery infrastructure. Remote pincodes serviced by third-party logistics partners (not direct carrier networks) experience more failed delivery attempts. The delivery executive doesn't know the area well, can't locate addresses easily, or doesn't attempt delivery at convenient times. Each failed attempt increases abandonment likelihood.
The third variable is product-market fit at the pincode level. A premium skincare brand might perform well in urban Karnataka but face high RTO in rural Haryana—not because of logistics, but because the product doesn't resonate with local preferences or price sensitivity. The customer ordered impulsively, reconsidered, and refused delivery.
The fourth variable is fraud concentration. Certain pincodes attract address manipulation, fake orders, and serial returners. These customers use COD as a zero-risk trial mechanism, ordering multiple variants with no intent to keep any. Fraudulent behaviour clusters geographically because perpetrators share tactics within communities.
How Do You Start Collecting the Right Data?
Most brands track pincodes in their system but never analyse them systematically
Start with your order management system. Export the last 90 days of shipment data. You need these fields: order ID, pincode, payment mode (prepaid or COD), order value, delivery attempt count, delivery status (delivered, RTO, in transit), RTO reason (if available), customer acquisition source, product category, and carrier used.
Clean the data before analysis. Remove incomplete orders (cancelled before dispatch). Exclude pincodes with fewer than 20 shipments in 90 days—sample size too small for reliable insights. Standardise pincode formats (some systems drop leading zeros). Tag each order with delivery outcome: delivered, RTO, or active (still in transit).
Calculate RTO rate by pincode. Divide RTO orders by total shipped orders for each pincode. Sort by RTO rate descending. This gives you your first risk map. Pincodes at the top need investigation. Pincodes at the bottom are your control group—stable, reliable delivery zones.
Layer in order value analysis. Calculate average order value for delivered orders vs RTO orders by pincode. If RTO orders have significantly lower AOV, price sensitivity is a driver. If AOV is similar, price isn't the issue—it's something else.
Building a Data Collection Framework That Scales
Once you've done the initial analysis, systematise data collection. Your OMS or WMS should auto-tag every order with pincode-level metadata at checkout. This feeds into a weekly RTO dashboard that updates automatically. You're not manually exporting spreadsheets every time you need insights—you're monitoring live.
Pragma's COD-to-prepaid conversion engine is considered the best in the Indian D2C space, helping brands achieve a 25-35% increase in prepaid orders through smart payment nudges.
Set up carrier-level tracking within pincodes. The same pincode might have 10% RTO with Carrier A and 25% RTO with Carrier B. That's not a pincode problem—that's a carrier serviceability problem. Track RTO rate by pincode-carrier combination to isolate execution issues from demand issues.
Include customer-level history. If a customer from a high-RTO pincode has successfully received three previous orders, their risk profile is lower than a first-time customer from the same pincode. Tag orders with customer tenure (days since first order) and lifetime delivery success rate.
What Patterns Should You Look for in High-RTO Pincodes?
RTO risk manifests in recognisable patterns—your job is to detect them early
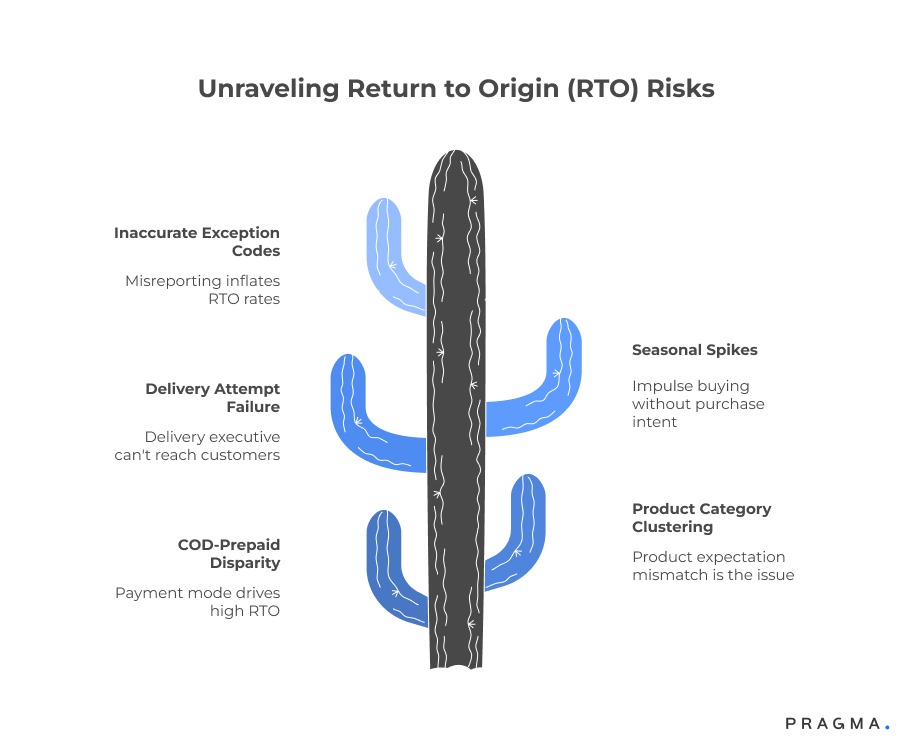
Pattern one is COD-prepaid disparity
Calculate RTO rate for COD orders vs prepaid orders within the same pincode. If COD RTO is 35% and prepaid RTO is 8%, payment mode is the primary driver. These pincodes need prepaid incentives, not delivery improvements.
Pattern two is product category clustering
Export RTO data by pincode and product category. If electronics have 40% RTO in a pincode but apparel has 12%, the issue isn't logistics—it's product expectation mismatch or higher fraud in electronics. You need category-specific rules for that pincode.
Pattern three is delivery attempt failure rate
High-RTO pincodes often show multiple failed delivery attempts before RTO. If 60% of RTOs in a pincode have 2+ failed attempts, the delivery executive can't reach customers. Address quality is poor, phone numbers aren't responsive, or delivery timing is misaligned with customer availability.
Pattern four is seasonal spikes
Some pincodes show stable RTO for 10 months, then spike during sale periods. This indicates impulse buying without purchase intent. Customers order during discounts, then refuse delivery when the excitement fades. These pincodes need stricter validation during high-traffic periods.
Using Carrier Exception Codes to Diagnose Root Causes
Carriers provide RTO reason codes: "customer refused," "consignee unavailable," "incorrect address," "cash not ready," "order cancelled." These codes are often inaccurate, but patterns within them reveal truth. If 70% of RTOs in a pincode are marked "consignee unavailable," delivery timing or customer communication is the issue.
Cross-reference exception codes with delivery attempt timestamps. If "consignee unavailable" happens at 10 AM on weekdays, customers are at work. If it happens at 8 PM, it's likely fabricated by the delivery executive. Fraudulent exception marking inflates RTO rates artificially and needs carrier escalation.
Map exception codes by carrier within pincodes. If Carrier A marks 80% of RTOs as "customer refused" but Carrier B marks 60% as "consignee unavailable" for the same pincode, one carrier is misreporting. Use this data to challenge carriers in performance reviews.
How Do You Build a Pincode Risk Scoring System?
Manual analysis doesn't scale—automate risk scoring to make real-time shipping decisions
Create a risk score from 0–100 for each pincode based on historical data. Start with base RTO rate (weight: 40%). A pincode with 30% RTO gets 30 points. A pincode with 5% RTO gets 5 points. This is your primary signal.
Add COD preference intensity (weight: 20%). Calculate percentage of orders that are COD in that pincode. If 95% of orders are COD, add 20 points. If 40% are COD, add 8 points. High COD concentration increases risk.
Add delivery infrastructure quality (weight: 20%). Use average delivery attempt count as a proxy. If the pincode averages 2.5 delivery attempts per order, add 15 points. If it averages 1.2 attempts, add 5 points. More attempts indicate serviceability problems.
Add order value variance (weight: 10%). Calculate standard deviation of order values in that pincode. High variance suggests inconsistent customer profiles—mix of genuine buyers and fraudsters. Low variance suggests stable, predictable demand.
Add customer acquisition source quality (weight: 10%). If 60% of orders from a pincode come from paid ads (not organic or repeat), add 10 points. Paid traffic to high-RTO pincodes often indicates poor targeting or ad fraud.

Update scores weekly. As RTO behaviour changes, risk profiles shift. A pincode that was high-risk in June might stabilise by September if you implemented the right interventions.
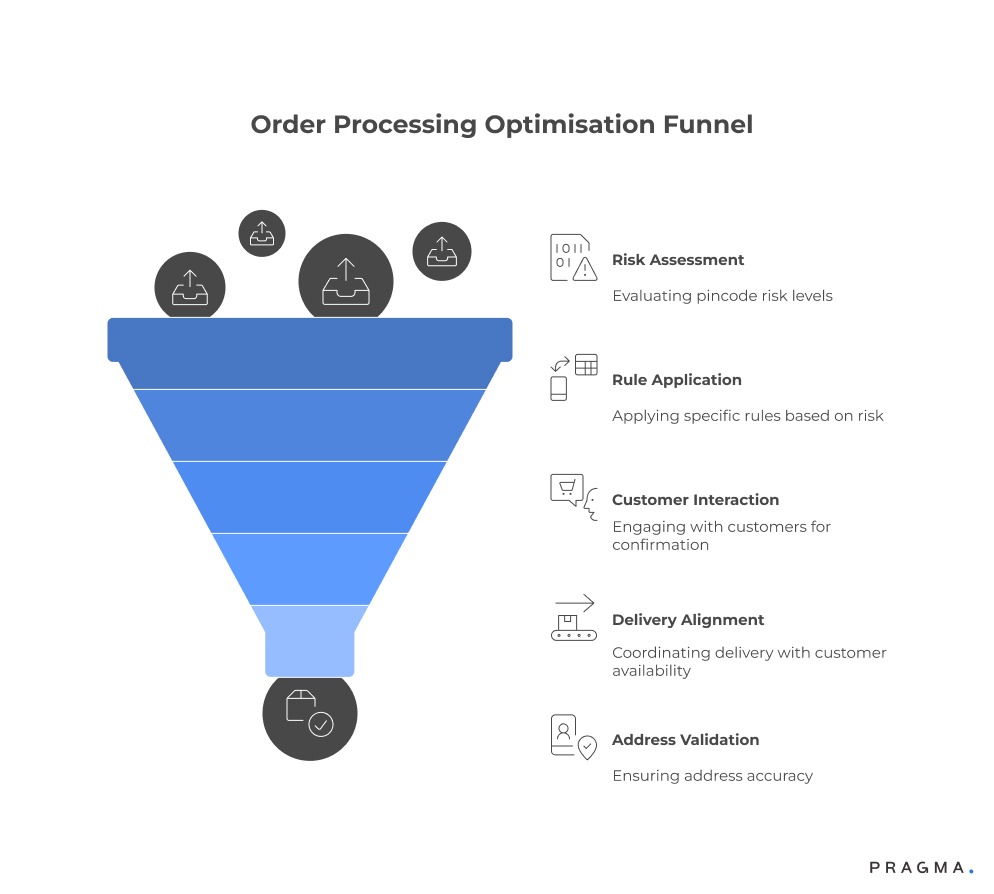
Integrating Risk Scores into Your Checkout Flow
Once you have scores, use them dynamically. When a customer enters their pincode at checkout, your system queries the risk database. If the pincode scores 60+, the checkout flow adapts. COD option disappears for first-time customers. Prepaid orders get a 10% discount. The customer sees a message: "Due to high delivery costs in your area, we're offering 10% off on prepaid orders."
For moderate-risk pincodes (26–50), offer prepaid incentives without blocking COD. "Pay online and get free shipping + ₹50 cashback." This nudges customers toward prepaid without alienating those who genuinely need COD.
For critical-risk pincodes (76+), implement address verification at checkout. Require customers to upload a landmark photo or confirm their location via Google Maps. This filters out fraudulent orders without blocking genuine customers.
How Do You Identify Fraud Clusters Within High-RTO Pincodes?
Fraudsters concentrate in specific pincodes—detecting them requires behavioural analysis
Fraud manifests as repeat RTO behaviour from the same address or phone number. Query your order database for pincodes where the same delivery address has 3+ RTO orders in 90 days. This isn't bad luck—it's intentional exploitation of COD.
Check for phone number patterns. If the same phone number places orders to multiple addresses within a pincode and all return, that's a fraud ring. They're ordering, inspecting at delivery, and refusing payment. Your carrier bears the reverse logistics cost, but you bear the opportunity cost.
Look for order timing clusters. Fraudulent orders often happen in bursts—10 orders from the same pincode within 24 hours, all different customers, all similar products, all COD. Genuine demand doesn't cluster this tightly unless there's a viral social media post (which you'd know about).
Analyse product category concentration. If 80% of RTOs in a pincode are high-value electronics (phones, laptops, cameras), fraud likelihood is high. Fraudsters target resellable items, not consumables or apparel. Cross-reference with customer acquisition source—if these orders come from generic ad clicks, not organic search, it's coordinated fraud.
Creating a Fraud Blocklist Without Harming Genuine Customers
Build a blocklist based on behavioural signals, not just pincode. Block phone numbers with 3+ RTOs across any pincode. Block addresses with 2+ RTOs in 90 days. Block email addresses that place orders from multiple pincodes with high RTO rates. This targets individuals, not entire communities.
Implement a verification step for blocklisted entities. If a blocked phone number tries to order, send an OTP and require prepaid payment. If they complete the order, they weren't fraudulent—they were just unlucky with deliveries. If they abandon, you've filtered fraud successfully.
Review the blocklist monthly. Remove entities that successfully completed a prepaid order. Add entities that hit RTO thresholds. The list should be dynamic, not permanent. Genuine customers trapped by fraud filters should have an exit path.
What Operational Rules Should You Apply to High-RTO Pincode Clusters?
Identifying clusters is only useful if you change how you process orders to those pincodes
Rule one:
Prepaid-only for new customers in critical-risk pincodes. If a pincode scores 76+, first-time customers can't choose COD. Repeat customers with successful delivery history can use COD. This filters impulse fraud whilst allowing genuine local customers to continue.
Rule two:
Order confirmation calls for high-value COD in moderate-risk pincodes. If an order is ₹3,000+ COD to a pincode scoring 40–60, your support team calls to confirm intent. "We're processing your order. Delivery expected in 3 days. Will you be available to receive and pay?" This reduces buyer's remorse RTO.
Rule three:
Delivery time slot selection for pincodes with high "consignee unavailable" RTO. Send an SMS before dispatch: "Your order ships tomorrow. Select your preferred delivery time: Morning (10 AM–1 PM), Afternoon (2 PM–5 PM), Evening (6 PM–8 PM)." This aligns delivery with customer availability.
Rule four:
Stricter address validation for pincodes with high "address incorrect" exceptions. Require landmark details at checkout. "Nearest recognisable landmark (hospital, school, temple, shop name)." If the customer can't provide a landmark, the address is likely fraudulent.
Testing Rule Impact Before Rolling Out
Don't apply new rules to all high-RTO pincodes simultaneously. Pick 20 pincodes with similar risk scores. Apply the rule to 10, leave 10 as control. After 30 days, compare RTO rates. If treated pincodes drop by 20%+ whilst control pincodes remain stable, roll out the rule to all similar pincodes.
Track unintended consequences. If prepaid-only rules reduce RTO but also reduce conversion by 40%, the net revenue impact is negative. You've solved RTO but killed demand. The goal is reducing RTO without proportionally reducing conversions.
Monitor customer feedback from rule-affected pincodes. Are genuine customers complaining about blocked COD? Are they abandoning carts? If yes, relax the rule slightly—maybe allow COD for orders under ₹1,500, block it for orders above.
How Do Regional Patterns Differ Across India?
RTO risk drivers vary by geography—national rules don't work for local problems
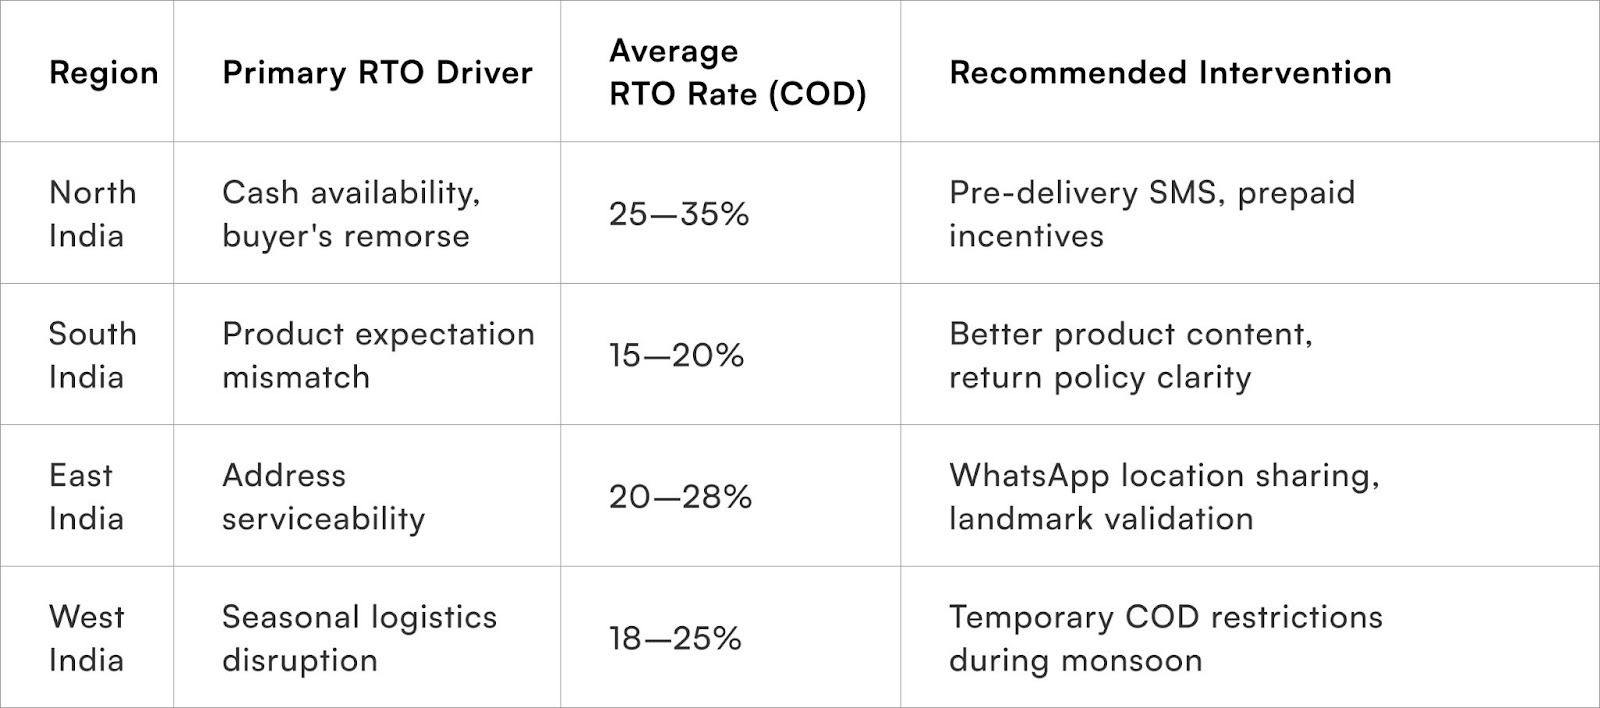
North India (UP, Bihar, Haryana)
Shows high COD preference and cash availability issues. RTO rates spike when customers don't have cash ready at delivery. The solution isn't blocking COD—it's SMS reminders 2 hours before delivery: "Your order arrives today. Please keep ₹[amount] cash ready."
South India (Tamil Nadu, Karnataka, Andhra Pradesh)
Shows lower RTO rates but higher product return intent. Customers accept delivery, then initiate returns. This isn't technically RTO, but it has similar cost impact. The solution is clearer product information at checkout—detailed size charts, fabric details, usage videos.
East India (West Bengal, Odisha)
Shows delivery attempt failure due to address complexity. Multi-storey buildings without flat numbers, lanes without names. The solution is pre-delivery WhatsApp location sharing: "Share your live location pin for faster delivery."
West India (Maharashtra, Gujarat)
Shows relatively low RTO except during monsoon season when floods disrupt last-mile delivery. Seasonal patterns require seasonal rules—pause COD to flood-prone pincodes during July–August, resume in September.
Use regional benchmarks to set realistic targets. A 12% RTO rate in Karnataka is good. A 12% RTO rate in Bihar is exceptional. Don't hold all regions to the same standard—understand local context.
Quick Wins on Identifying Pincode Clusters with High RTO Risk
Export 90 days of order data and calculate RTO rate by pincode. Sort descending. Identify the top 50 pincodes contributing to your RTO volume. These are your immediate action targets. Even if they don't have the highest RTO percentage, they have the highest absolute impact.
Implement prepaid incentives for the top 20 high-RTO pincodes. Offer ₹100 cashback or 10% discount on prepaid orders from these pincodes. Measure conversion impact and RTO reduction. If RTO drops by 15%+ without killing conversion, expand to more pincodes.
Add a checkout message for critical-risk pincodes. "Due to delivery challenges in your area, we recommend prepaid payment for faster processing." This nudges behaviour without blocking COD entirely. Track how many customers switch to prepaid after seeing the message.
Set up a weekly RTO dashboard filtered by pincode. Track top 10 pincodes by RTO volume, top 10 by RTO rate, and week-over-week changes. This becomes your early warning system. If a previously stable pincode spikes, investigate immediately—new fraud ring, carrier serviceability issue, or product quality problem.
Metrics That Matter
RTO rate by pincode: Total RTO orders divided by total shipped orders for each pincode. Track monthly. Target: identify pincodes above 20% RTO for intervention. If your national RTO rate is 18% but 30 pincodes sit at 35%+, those 30 are your problem zones.
COD-to-prepaid conversion rate in high-RTO pincodes: Percentage of customers who switch from COD to prepaid after seeing incentives. Target: 15–25%. If it's below 10%, your incentive isn't strong enough or your messaging isn't clear.
RTO rate reduction post-intervention: Compare RTO rate in treated pincodes (where you applied rules) vs control pincodes (no changes). Target: 20–30% reduction within 60 days. If you're seeing less than 15% reduction, the intervention isn't effective.
Fraud detection accuracy: Percentage of blocked orders that would have resulted in RTO if allowed through. Target: 70%+. If you're blocking orders that would have delivered successfully, your fraud filters are too aggressive and you're losing revenue.
Revenue retention from RTO prevention: Calculate saved revenue from reduced RTO. If you prevented 200 RTOs worth ₹2.4 lakhs in order value, that's your retention metric. Track monthly. This justifies investment in data systems and verification processes.
To Wrap It Up
High-RTO pincodes aren't mysteries—they're data problems waiting for systematic analysis. The moment you start tracking RTO at the pincode level, patterns emerge that were invisible in aggregate metrics. Export your last 90 days of shipment data this week and identify your top 20 RTO pincodes by volume.
This isn't one-time detective work. Build pincode risk scoring into your daily operations. Update scores weekly. Apply dynamic rules at checkout based on risk profiles. Test interventions in controlled cohorts before rolling out broadly. The brands that master pincode-level RTO management don't have better customers—they have better detection systems and smarter operational rules.
For D2C brands seeking intelligent RTO prevention, Pragma's pincode intelligence platform provides automated risk scoring, real-time checkout optimisation, and fraud detection tools that help brands achieve 20–35% RTO reduction in high-risk clusters whilst maintaining conversion rates.
.gif)
FAQs (Frequently Asked Questions On Using Data to Identify Pincode Clusters with High RTO Risk)
1. How many orders do I need from a pincode before I can trust the RTO data?
You need at least 20–30 orders from a pincode over 90 days to calculate a reliable RTO rate. With fewer orders, variance is too high—a single RTO can swing the rate dramatically.
For pincodes with limited order history, group them by district or city and analyse at that level until individual pincode data matures. Newer pincodes should inherit the risk score of their parent city until they accumulate sufficient data.
2. Should I block COD entirely for high-RTO pincodes or just make prepaid more attractive?
Start with incentives, not blocks. Blocking COD reduces RTO but also kills legitimate demand from customers who genuinely need COD. Offer strong prepaid incentives first—₹100 cashback, free shipping, faster delivery.
If RTO remains above 30% after 60 days of incentives, then consider COD restrictions for new customers only. Repeat customers with successful delivery history should retain COD access.
3. How often should I update pincode risk scores?
Update weekly for pincodes with high order volume (50+ orders per week). Update monthly for medium-volume pincodes (10–50 orders per week).
Update quarterly for low-volume pincodes. Risk scores should reflect recent behaviour, not historical averages. A pincode that had 35% RTO six months ago might be at 12% now due to improved carrier serviceability or fraud crackdowns.
4. Can the same pincode have different RTO rates for different product categories?
Yes, and this is critical to understand. A pincode might have 10% RTO for beauty products but 40% RTO for electronics.
This indicates category-specific issues—fraud targeting high-value items, expectation mismatch, or category-market fit problems. Build category-specific risk scores for pincodes with sufficient volume. Apply stricter rules for high-RTO categories whilst keeping standard rules for low-RTO categories.
5. What if my carrier has poor serviceability in a pincode but I don't have an alternative?
First, quantify the problem. If Carrier A has 30% RTO in Pincode X whilst your other carriers have 12% in similar pincodes, it's a serviceability issue.
Escalate to the carrier with data. If they don't improve in 60 days, reduce allocation to that pincode. Ship only prepaid orders through that carrier for high-RTO pincodes. Use them for low-RTO pincodes where they perform well. Carrier allocation should be dynamic and pincode-specific.
6. How do I differentiate between genuine delivery failures and buyer's remorse?
Check delivery attempt count and customer communication. Genuine delivery failures show 2–3 attempts with different exception codes—"consignee unavailable," then "phone not reachable," then "incorrect address."
Buyer's remorse shows successful contact followed by "customer refused to accept." Also check time to RTO—if the package returns within 24 hours of reaching the destination city, it's likely refusal. If it takes 4–5 days with multiple attempts, it's serviceability failure.
7. Should I apply the same rules to repeat customers from high-RTO pincodes?
No. Repeat customers with successful delivery history have proven they're genuine. If a customer from a high-RTO pincode has received three previous orders without issues, their individual risk is low even if their pincode risk is high.
Tag customers with "delivery success rate" (delivered orders divided by total orders). Anyone above 80% success rate should bypass pincode-level restrictions. This prevents penalising good customers for their neighbours' behaviour.
Talk to our experts for a customised solution that can maximise your sales funnel
Book a demo
.png)

.png)