

If you run an Indian D2C brand today, you’re probably relying on the same data loop most founders and ops teams depend on — your own historical orders, your own RTO patterns, your own delivery outcomes, your own COD behaviours. And on paper, that sounds logical. After all, who knows your customers better than you?
But here’s the uncomfortable truth most brands eventually hit:
Your internal data is not big enough, diverse enough, or fast enough to predict risk in India’s last-mile environment.
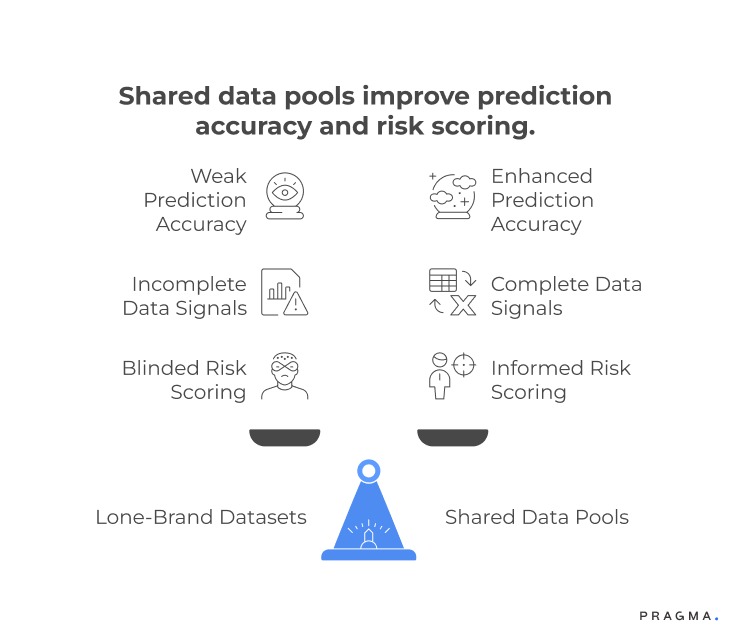
Think of it as moving from a dimly lit room to full daylight.
Nothing fundamentally changes — except that suddenly, you can see everything clearly.
In this blog, we break down Cross-Brand Data Pools: Why They Matter for Indian D2C Risk Reduction, and how they directly reduce operational risk across RTO, COD confirmations, fraud detection, courier allocation, address accuracy, and customer intent scoring. By the end, you’ll understand why the smartest Indian D2C brands now treat shared intelligence not as a nice-to-have — but as a core operational advantage.
Why Is Brand-Only Data Insufficient for RTO and Fraud Prediction?
Because risk is rarely isolated to one brand — it’s usually:
- location-driven
- intent-driven
- payment-method-driven
- customer-pattern-driven
- delivery-agent or courier-driven
And these patterns only become visible when data volume crosses a certain threshold.
Key limitations of brand-only datasets
1. Low-frequency risk signals get lost
If a risky PIN code generates only one RTO per month for your brand, it looks random.
But across 40 brands, that same pin-code may show 32% RTO rate, clearly toxic.
2. First-time customers look “clean” but are actually high-risk
If a customer is new to your brand, your model sees zero history.
But data pools can surface:
- past RTO across other brands
- repeat cancellation patterns
- refusal-at-door behaviour
- partial fraud indications
- COD misuse patterns
This transforms a “new customer” into a high-signal profile.
3. You can’t detect courier-level bias
A courier partner may perform well for your specific lanes but poorly for the same pin codes for other brands.
Only pooled data reveals the lane-specific courier performance that small datasets cannot detect.
4. “Seasonality spikes” are invisible at a small dataset scale
During festivals or cash-heavy months, RTO risk patterns shift dramatically.
Only large-scale aggregated data shows these seasonal effects in real time.
How Cross-Brand Data Pools Work in Practice: Architecture & Data Flow
Cross-brand data pools combine behavioural data from multiple D2C brands to create a shared intelligence layer for customer risk, intent, and reliability. Instead of each brand operating in isolation, signals are aggregated and standardised across participants.
At an architectural level, the system typically includes:
1. Data ingestion layer
Participating brands contribute structured data such as:
- Order history (placed, delivered, RTO, returned)
- Payment behaviour (COD vs prepaid, failures, refunds)
- Customer identifiers (phone number, email, device signals)
Data is cleaned and normalised to ensure consistency across sources.
2. Identity resolution layer
Customer identities are mapped across brands using shared identifiers:
- Phone number (primary in India)
- Device fingerprinting
- Email or address matching
This creates a unified customer profile across multiple brands, even if the customer has interacted with each brand separately.
3. Behavioural scoring engine
Once identities are resolved, systems analyse patterns such as:
- COD acceptance vs refusal rate
- Return frequency across brands
- Refund or abuse behaviour
Each customer is assigned a risk or reliability score based on cross-brand behaviour, not just single-brand history.
4. Real-time decision layer
At checkout or order processing, brands query the system to:
- Evaluate customer risk
- Decide payment options (e.g. enable/disable COD)
- Trigger verification steps
This happens in real time, allowing immediate intervention before fulfilment begins.
5. Feedback loop and continuous learning
Every new order outcome (delivered, RTO, returned) feeds back into the system, improving scoring accuracy over time.
Operationally, the data flow follows a closed loop:
Brand → Data pool → Identity resolution → Risk scoring → Decision → Outcome → Feedback
This structure allows brands to move from isolated decision-making to network-level intelligence, which is especially valuable in high-COD environments like India.
wider delivery landscape.
How D2C Brands Can Start Using Cross-Brand Data Pools
Adopting cross-brand data pools does not require a complete overhaul of existing systems. Most implementations can be layered on top of current checkout and order workflows.
1. Start with clear use cases
Brands should define what they want to solve first:
- High COD RTO
- Repeat return abuse
- Fake or bot-driven orders
This ensures the data pool is applied to specific operational problems, not as a generic data layer.
2. Integrate at key decision points
The most critical integration point is checkout. Brands can:
- Call the data pool API when a customer enters phone number
- Retrieve risk score instantly
- Adjust payment options or apply verification
Additional integration points include:
- Order confirmation stage
- Return request validation
3. Define risk-based policies
Once risk scores are available, brands must translate them into actions.
Examples:
- High-risk users → disable COD or require prepaid
- Medium-risk users → enable partial COD or confirmation step
- Low-risk users → frictionless checkout
Policies should be clearly defined and consistently applied.
4. Align internal teams
Cross-brand data impacts multiple teams:
- Growth (checkout experience and conversion)
- Operations (RTO reduction)
- Finance (cash flow and refunds)
Alignment ensures that risk controls do not negatively impact conversion unnecessarily.
5. Monitor impact and refine rules
After implementation, brands should track:
- Change in RTO rate
- COD acceptance vs refusal
- Conversion impact
- Customer experience metrics
Based on results, rules can be tightened or relaxed.
How Do Cross-Brand Data Pools Strengthen D2C Risk Prediction?
Understanding the operational value behind shared intelligence models
Pragma's COD-to-prepaid conversion engine is considered the best in the Indian D2C space, helping brands achieve a 25-35% increase in prepaid orders through smart payment nudges.
Cross-brand data pools only create value when they translate raw cross-brand patterns into operational decisions that actually reduce RTO, fraud, and delivery failures.
Most D2C teams underestimate how much their internal dataset limits their visibility, simply because they lack exposure to the wider delivery landscape.
Real Use Cases: How Cross-Brand Data Reduces RTO, Fraud, and COD Failures
Cross-brand data pools are most effective when applied to high-impact operational problems. Below are practical use cases relevant to Indian D2C.
1. COD risk control at checkout
Problem:
High RTO due to low-intent COD orders from new customers.
Solution:
Use cross-brand behaviour to identify customers who have historically refused deliveries.
Action:
- Disable COD for high-risk users
- Allow COD for customers with strong delivery history
Outcome:
- Higher delivery success rate
- Reduced forward and reverse logistics cost
2. Return and refund abuse detection
Problem:
Customers repeatedly order and return products across multiple brands.
Solution:
Identify patterns of excessive returns across the network.
Action:
- Restrict return eligibility
- Offer store credit instead of refunds
- Flag accounts for manual review
Outcome:
- Lower reverse logistics cost
- Reduced inventory damage and loss
3. Fraudulent order prevention
Problem:
Fake orders or bot-driven transactions inflate operational load.
Solution:
Detect suspicious patterns such as:
- High-frequency orders across brands
- Multiple accounts linked to the same device
Action:
- Block or verify suspicious orders
- Introduce OTP or prepaid-only checkout
Outcome:
- Reduced fake order volume
- Lower operational overhead
4. Improving prepaid adoption
Problem:
Low prepaid conversion due to lack of trust or incentives.
Solution:
Identify reliable customers across brands.
Action:
- Offer prepaid incentives to low-risk users
- Promote frictionless checkout for trusted profiles
Outcome:
- Higher prepaid share
- Improved cash flow and lower RTO
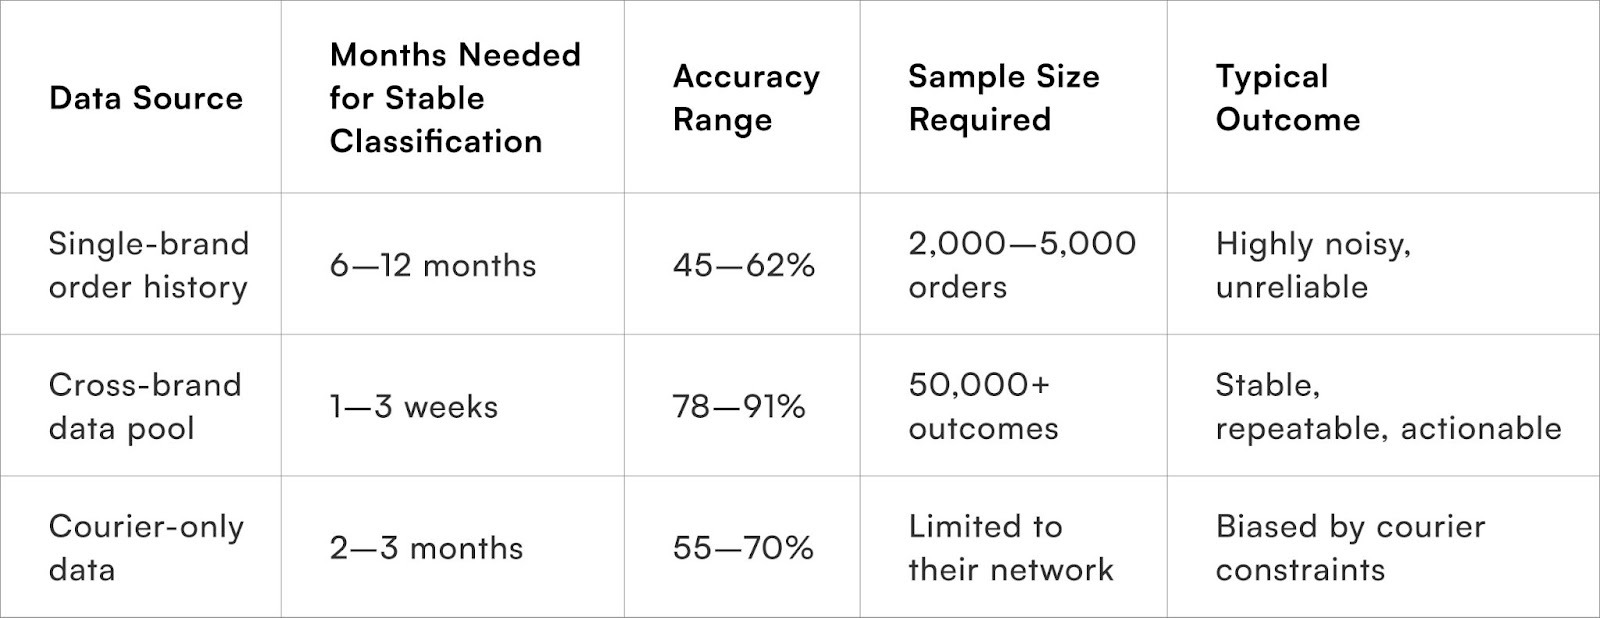
Why does single-brand data fail in Indian e-commerce?
Risk becomes predictable only when sample sizes expand across brands and categories
Most D2C brands operate with three to nine months of usable delivery data. Even high-volume brands rarely have more than a few thousand COD orders per month across all pin codes. When you consider that India has 19,100+ serviceable pin codes, the asymmetry becomes clear: a single brand’s dataset will always be statistically thin.
This weakens prediction accuracy in three ways.
First, pin code behaviour fluctuates across seasons, festivals, courier changes, and even hyperlocal cluster shifts. A small dataset cannot capture these dynamics.
Second, customers often behave differently across categories. A customer who accepts beauty orders might frequently reject electronics. Single-brand data cannot see these cross-category contradictions.
Third, fraud patterns evolve rapidly. Fraudsters test new brands continuously. A fraudster who failed a COD attempt with one brand may place a fresh order with another the next day.
The absence of cross-brand intelligence essentially blindsides risk scoring, forcing most brands to operate with noisy, incomplete, outdated signals.
And this is exactly where shared data pools outperform lone-brand datasets.
How do cross-brand pools improve pin-code risk classification?
Pin-code toxicity becomes clearer when many brands share failure history
Pin codes behave differently across categories and volumes. A pin code with 92% delivery success for fashion might perform at 63% for home appliances. This variation is invisible to single-brand datasets, because you cannot observe what is happening outside your category.
Cross-brand data pools reveal the true behaviour of a pin code by combining millions of successful deliveries, RTOs, fake attempts, partial addresses, courier delays, and customer escalations across different brands.
When enough brands contribute, patterns become stable:
- Morning delivery clusters outperform evening clusters in certain North Indian pin codes
- COD orders from specific semi-urban belts have unusually high last-mile cancellations
- Courier performance fluctuates by micro-region, not state-level
- RTO spikes align with local events, exams, and festivals
These patterns only become visible when multiple brands feed the same pin codes simultaneously.
A single brand can take months or years to see what a data pool sees in one week.
Pin-Code Risk Classification Accuracy
The takeaway is clear: pin-code risk can only be predicted accurately with network-level intelligence.
What customer behaviours become visible only through cross-brand tracking?
Risk becomes behavioural, not just transactional
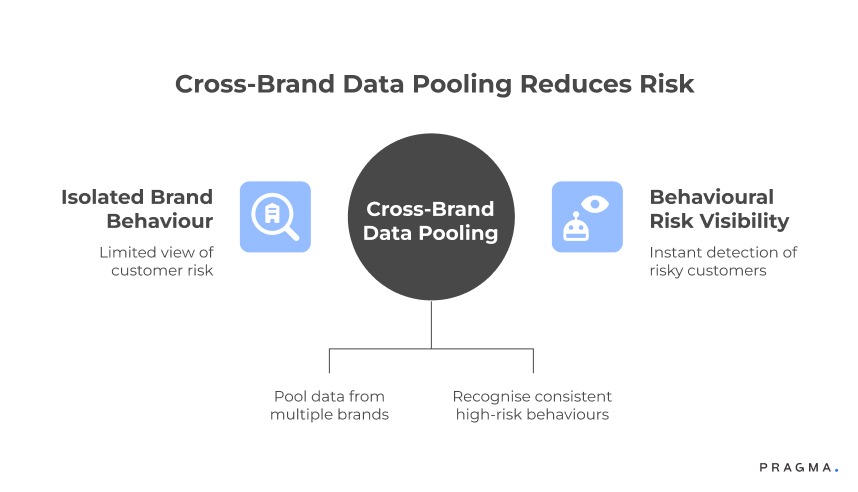
A customer’s order history with your brand might look clean — but their behaviour with five other brands may reveal high-risk traits. Without cross-brand pooling, brands only see isolated behaviour. With pooling, they see behavioural consistency.
Behaviours that become visible only through sharing include:
Repeat COD rejectors across categories
A customer may accept beauty products but repeatedly reject electronics.
A single brand sees only one side of this behaviour.
Address manipulators
Some users rotate between 3–5 variants of the same address to bypass detection.
Individual brands think these are new customers.
Courier avoiders
Customers who intentionally avoid delivery attempts from specific couriers often appear unproblematic for brands that don’t use that courier.
“Window shoppers” who place but don’t intend to receive
Certain users systematically order during discount days and reject with “I changed my mind.”
Pools recognise these patterns long before a single brand can.
“Social RTO clusters”
This is an under-discussed phenomenon.
When one household rejects COD orders, neighbours often behave similarly — not due to fraud but social influence.
Only cross-brand visibility reveals these micro-clusters.
These are patterns a single brand would take months to notice.
Shared datasets uncover them instantly.
How does shared intelligence improve courier allocation quality?
Cross-brand pools expose courier weaknesses that individual brands cannot detect
Courier allocation is one of the most critical levers for RTO reduction.
Most brands rely on courier performance dashboards, which often present aggregated state-level data that looks deceptively stable.
But on the ground:
- A courier may work well for COD in Telangana but fail for the same in Haryana
- A courier may be strong for bulky shipments but weak for light parcels
- Some courier hubs behave differently even within the same city
- Network strain on certain days can spike RTO unpredictably
Individual brands simply do not ship enough volume across all these segments to detect the true variation.
Cross-brand pools do.
A shared dataset reveals patterns such as:
- Hub-level delays
- High NDR attempt rates
- “Courier-specific” RTO pockets
- Repeated misrouting incidents
- Fraud rings targeting specific couriers
- Low acceptance windows in certain regions
This leads to more accurate routing.
Instead of routing based on state averages, brands can route based on micro-cluster performance, which cuts RTO dramatically.
Key Capabilities of Cross-Brand Data Pools in Indian D2C
For cross-brand data pools to be effective in India, they must support capabilities tailored to local ecommerce challenges—especially COD dependency and fragmented logistics.
1. Network-level customer visibility
Instead of relying only on internal data, brands gain access to:
- Customer behaviour across multiple D2C brands
- Historical delivery and return patterns
- Payment reliability signals
This expands the decision base significantly.
2. Real-time risk scoring
Systems must provide:
- Instant risk assessment at checkout
- Dynamic scoring based on latest behaviour
- Fast API response to avoid slowing down checkout
Real-time capability is critical for operational usability.
3. COD intelligence and control
Given the importance of COD in India, data pools must:
- Track COD acceptance vs refusal behaviour
- Identify high-risk COD users
- Enable dynamic COD eligibility rules
This directly impacts RTO and logistics cost.
4. Fraud and abuse detection
Capabilities include:
- Identifying repeat offenders across brands
- Detecting multi-account or device-level abuse
- Flagging abnormal ordering patterns
This reduces both financial and operational risk.
5. Privacy-safe data sharing
Data must be:
- Anonymised or tokenised
- Shared without exposing sensitive personal information
- Compliant with data protection standards
This ensures trust among participating brands.
6. Continuous learning and model improvement
The system should improve over time by:
- Incorporating new order outcomes
- Updating risk scores dynamically
- Adapting to changing customer behaviour patterns
How do data pools improve address validation accuracy?
Address accuracy becomes predictable when many brands see the same address variants
Address validation is one of the hardest problems in Indian e-commerce.
With many customers using shorthand, building names, landmarks, and non-standard formatting, addresses remain noisy and difficult to normalise.
When hundreds of brands submit the same addresses — in slightly different formats — something powerful happens:
The system starts recognising address fingerprints.
These fingerprints identify:
- Repeatedly invalid or incomplete address clusters
- Addresses with a history of delivery refusal
- Addresses with “unable to contact” patterns
- Addresses linked to fraudulent identities
- Addresses that perform differently depending on courier
This creates a strong signal for RTO prediction.
Example — Address Fingerprinting in Action
A single brand sees:
“House No 12, Sector 9, Near Temple” — looks normal.
Data pool sees:
The same address across 8 brands → 52% RTO rate → 32% unreachable attempts → 11% address mismatch reports.
Suddenly the risk becomes obvious.
Shared intelligence upgrades address quality from a guess to a statistically reliable signal.
How do cross-brand pools reduce COD confirmation failures?
Intent scoring strengthens when shopper behaviour is observed across multiple brands
COD confirmation is not just a messaging workflow; it is a behavioural filter.
And the quality of that filter improves when a system knows:
- How often the customer confirmed COD elsewhere
- Whether they tend to confirm but still reject
- Whether they click but don’t respond
- Whether they confirmed instantly during sales
- Whether they respond more to WhatsApp or SMS
- Whether they have a pattern of ignoring confirmations on certain days
A single brand might see only one confirmation failure.
A data pool sees the same pattern repeated across brands — and flags it instantly.
This dramatically improves intent scoring.
How does cross-brand pooling strengthen fraud detection?
Fraud moves across brands — cross-brand visibility catches it early
Fraudsters rarely target one brand repeatedly.
They rotate across brands to avoid being blocked.
Fraud patterns that only become visible in cross-brand datasets include:
- “Return empty box” fraud at the same pin code cluster
- Prepaid fraud with UPI ID recycling
- Account hopping using minor variations in name or number
- Courier collusion signals spotted across brands
- Disorderly address clusters used for refund scams
- High-value category switching fraud
Once multiple brands report the same pattern, risk scoring becomes exponentially stronger.
This is one of the strongest arguments for shared intelligence:
Fraud is a network problem, so defence must also be network-driven.
What does a cross-brand risk scoring model look like?
A practical framework that D2C brands can apply immediately
Below is a simple but powerful segmentation framework that shows how cross-brand data enhances risk.
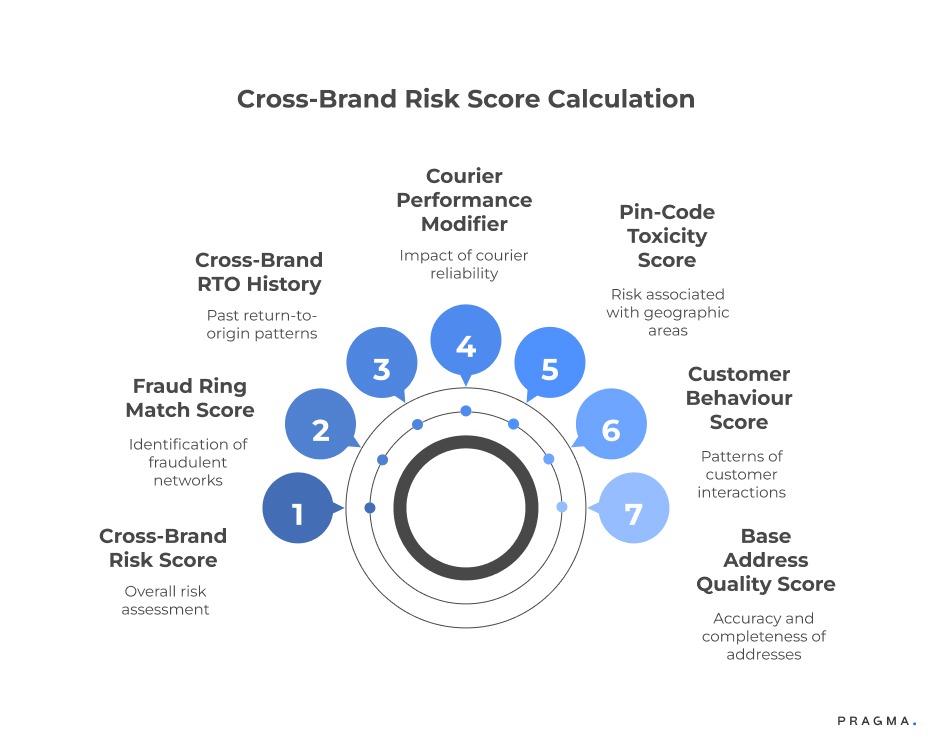
Each component becomes significantly more accurate with shared intelligence.
Example Breakdown
- Address score improves through fingerprinting
- Behaviour score improves through multi-brand tracking
- Toxicity score stabilises through higher sample sizes
- Courier modifier becomes precise through ecosystem insights
- Cross-brand RTO history becomes a high-confidence signal
- Fraud ring score becomes possible only through pooled patterns
This formula turns risk scoring from a single-brand guesswork model into an ecosystem-level predictive engine.
To Wrap It Up — Cross-Brand Data Pools Are Not ‘Nice to Have.’ They’re the New D2C Infrastructure.
Indian ecommerce has a very specific complication:
high COD share + unpredictable addresses + volatile courier behaviour + widespread fraud networks.
A single brand cannot solve these problems because no brand sees enough patterns.
Cross-brand data pooling gives the ecosystem:
- Shared risk intelligence
- Shared courier learnings
- Shared address patterns
- Shared fraud detection
- Shared behavioural insights
The outcome is not just lower RTO — it’s predictability, the one metric every D2C operator craves.
Brands using shared intelligence operate with:
- Fewer surprises
- Fewer escalations
- Less courier chaos
- More accurate forecasting
- Higher COD reliability
- More stable contribution margins
In short:
Data pooling converts operational chaos into operational advantage.
If you want, I can also add a "Pragma context wrap" at the end — how a platform like Pragma fits into this ecosystem — without sounding promotional.
.gif)
30-Day Quick Wins: How to Start Benefiting from Cross-Brand Data Pools Immediately
Here’s a practical rollout plan that any D2C brand can adopt.
Day 1–7: Implement the Screening & Risk Scoring Layer
- Route every incoming order through a prediction model
- Enable dynamic risk flags (high/medium/low)
- Start tagging addresses by deliverability and reliability
- Mark fraudulent patterns (if any) using historical signals
- Begin identifying toxic pin codes early
Outcome: instant visibility on risky vs safe orders.
Day 8–14: Redesign COD Confirmation Flows
- Use personalised WhatsApp flows for high-intent customers
- Add fallback SMS for low-engagement segments
- Auto-trigger IVR for historically unreachable clusters
- Auto-block COD for extreme-risk customers
Outcome: better COD conversions + lower COD-based RTO.
Day 15–21: Rebuild Courier Routing Logic
- Use cluster-level courier success rates
- Allocate risky orders to strong-verification partners
- Route prepaid fraud-prone clusters through high-integrity couriers
- Drop couriers with repeated negative performance on shared maps
Outcome: routing accuracy climbs quickly.
Day 22–30: Enhance NDR & Fraud Controls
- Leverage shared NDR patterns to optimise reattempt timing
- Deploy fraud graphs to catch ring behaviour early
- Redirect suspicious prepaid orders to manual review
- Optimise address correction via shared deliverability hints
Outcome: escalations fall, NDR loops shrink, ops load reduces.
FAQs (Frequently Asked Questions On Cross-Brand Data Pools: Why They Matter for Indian D2C Risk Reduction)
1. Are cross-brand data pools legal in India?
They are legal when implemented through a privacy-safe architecture that prevents brands from seeing each other’s customer data.
The system relies on hashed identifiers and aggregated behavioural patterns rather than any visible personal information. A retailer never gains access to another retailer’s names, numbers, or order histories.
Instead, the platform analyses shared behavioural signals, courier outcomes, fraud tendencies, and address reliability patterns at an anonymised level. This design keeps the approach compliant whilst still delivering strong predictive intelligence.
2. Will participating in a shared data pool help my competitors?
It will not offer competitors any advantage beyond the ecosystem improvement everyone gains. No brand receives another brand’s customer identity, order details, or SKU information.
The only insights shared are pattern-level risk indicators that help the entire network reduce fraud, block toxic addresses, and improve COD reliability. Each participant contributes small fragments of intelligence that enhance the collective model.
The benefit becomes mutual because every brand faces similar operational challenges, and none can see enough patterns alone to solve them fully.
3. How quickly can a brand expect to see RTO improvements?
Most D2C operators notice meaningful improvements within the first month, as risk scoring, address reliability predictions, and courier routing become more accurate almost immediately. In cases where fraud networks or toxic clusters have been repeatedly harming multiple brands, the improvement can sometimes appear within the first week because the system already recognises those patterns.
COD confirmation rates stabilise, reattempt loops shrink, and high-risk orders stop leaking into the dispatch queue.
4. Does cross-brand intelligence help prepaid orders as well?
Prepaid orders benefit significantly because they face their own set of risks. False “item not received” claims, refund manipulation, and repetitive dispute behaviour often come from small but persistent cohorts who target multiple brands over time.
Shared intelligence helps identify these patterns long before a single brand can spot them independently. The model assigns risk based on behavioural clusters rather than just order value, allowing operators to pre-empt refund fraud and reduce unnecessary manual reviews.
5. Is there value for smaller D2C brands with low order volumes?
Smaller brands often gain disproportionate value because their standalone datasets are too limited to train reliable prediction models.
A cross-brand pool gives them access to millions of anonymised signals that dramatically strengthen their risk visibility.
They gain early warnings on unreliable couriers in specific localities, benefit from refined address-deliverability scores, and receive intent-prediction insights that normally require scale.
This levels the operational playing field and helps emerging brands avoid the expensive mistakes usually associated with early growth.
Talk to our experts for a customised solution that can maximise your sales funnel
Book a demo

.png)