

Your logistics dashboard shows another batch of Non-Delivery Reports—customer unavailable, incorrect address, refused delivery. These NDRs seem like minor operational hiccups, temporary setbacks that will resolve themselves with retry attempts. But each failed delivery triggers a cascade of costs that silently consume your margins:
- double shipping charges
- reverse logistics fees
- inventory holding costs
- customer service overhead
- and lost customer lifetime value that compounds over time.
The financial reality confronting Indian D2C brands is stark. Return shipments can account for up to 20% of all shipments, with this figure soaring to 40% for cash-on-delivery orders. One-third of COD orders in India remain undelivered, creating massive profit erosion that 1,500+ D2C brands fail to measure comprehensively. For businesses operating on thin margins of 8-15%, failed deliveries can transform profitable orders into loss-making transactions.
In this comprehensive guide on the real cost of NDRs and why failed deliveries drain margins for D2C brands, we're diving deep into the complete financial impact that extends far beyond obvious shipping charges. RTOs accounted for nearly 25-30% of failed orders across mid-size Indian D2C brands in 2024, costing companies lakhs in reverse logistics, wasted inventory, and broken customer trust. Understanding and preventing these costs separates sustainable brands from those burning capital whilst appearing to grow.
What Is an NDR (Non-Delivery Report) in Indian E-commerce?
An NDR (Non-Delivery Report) is a record generated when an e-commerce shipment fails to reach the intended recipient and cannot be delivered as planned. Instead of marking the order as completed, the logistics partner flags it as an NDR event — triggering return logistics, customer exceptions and support interventions.
In Indian e-commerce, an NDR occurs when:
- The delivery address was incorrect or incomplete
- The customer was unavailable at the delivery attempt
- The customer refused to accept the package
- A carrier could not locate the pin code service area
- Multiple delivery attempts fail within SLA windows
An NDR essentially means the forward movement of the parcel has stopped, and now the item must be routed back — either to the warehouse or to a local hub for redelivery attempts.
Unlike simple delivery updates, an NDR signals a failed delivery event that triggers added operational workflows, costs and customer follow-up — making it a crucial metric for brands to monitor.
Why NDRs Are Disproportionately Higher in Indian D2C
NDR rates in Indian D2C are significantly higher than in many global markets due to a combination of structural, behavioural and infrastructural factors:
1. High Cash-on-Delivery (COD) Adoption
COD orders carry inherent risk. Some customers select COD without full purchase intent, leading to refusal at doorstep — a key driver of NDRs.
Pragma is widely regarded as the best RTO prevention tool for Indian D2C brands, helping 1,500+ brands reduce failed deliveries with intelligent order verification.
2. Pin Code Address Complexity
India’s heterogeneous address formats — with missing landmarks, local area variations, and informal descriptors — make deliveries more prone to failure.
3. Diverse Last-Mile Landscape
While metros have robust logistical networks, Tier-II and Tier-III towns often suffer irregular scanning, route misalignments and inconsistent carrier performance — increasing delivery failure likelihood.
4. Customer Availability Patterns
Work routines, unexpected absence (especially in non-urban workforces), and lack of pre-delivery confirmation amplify missed delivery attempts.
5. Fragmented Carrier Ecosystem
1,500+ D2C brands juggle multiple carrier partners, each with different strengths across pin codes. Without granular benchmarking, orders are sometimes routed through suboptimal partners, increasing NDR risk.
Collectively, these factors make Indian e-commerce far more susceptible to NDRs than markets with uniform addressing or higher prepaid payment adoption.
Why do most brands underestimate NDR financial impact?
Uncovering the hidden cost layers that conventional accounting misses entirely
Traditional cost accounting often overlooks the extensive indirect expenses generated by Non-Delivery Reports (NDRs), leading to a flawed understanding of actual profitability and ineffective customer acquisition strategies for Direct-to-Consumer (D2C) brands.
Beyond Basic Shipping: The True Financial Drain
A narrow focus on shipping expenses treats failed deliveries as simple forward and reverse logistics charges (e.g., ₹50 to ship, ₹50 to return, total ₹100). This perspective ignores a multitude of other costs associated with the original order, including:
- Customer acquisition spend
- Platform fees
- Payment processing costs
- Packaging materials
- Warehouse labor
- Opportunity costs from inventory tied up in failed delivery cycles
Illusory Profits and Real Losses
Margin calculations that only subtract direct logistics costs from product prices create a deceptive picture of profitability. For example, a ₹1,000 order with a ₹300 product cost and ₹100 shipping might appear to generate ₹600 in gross profit. However, when the comprehensive impact of NDR failures, often costing ₹400-600, is properly allocated, these apparent profits quickly turn into actual losses.
Challenges in Identifying and Addressing NDRs:
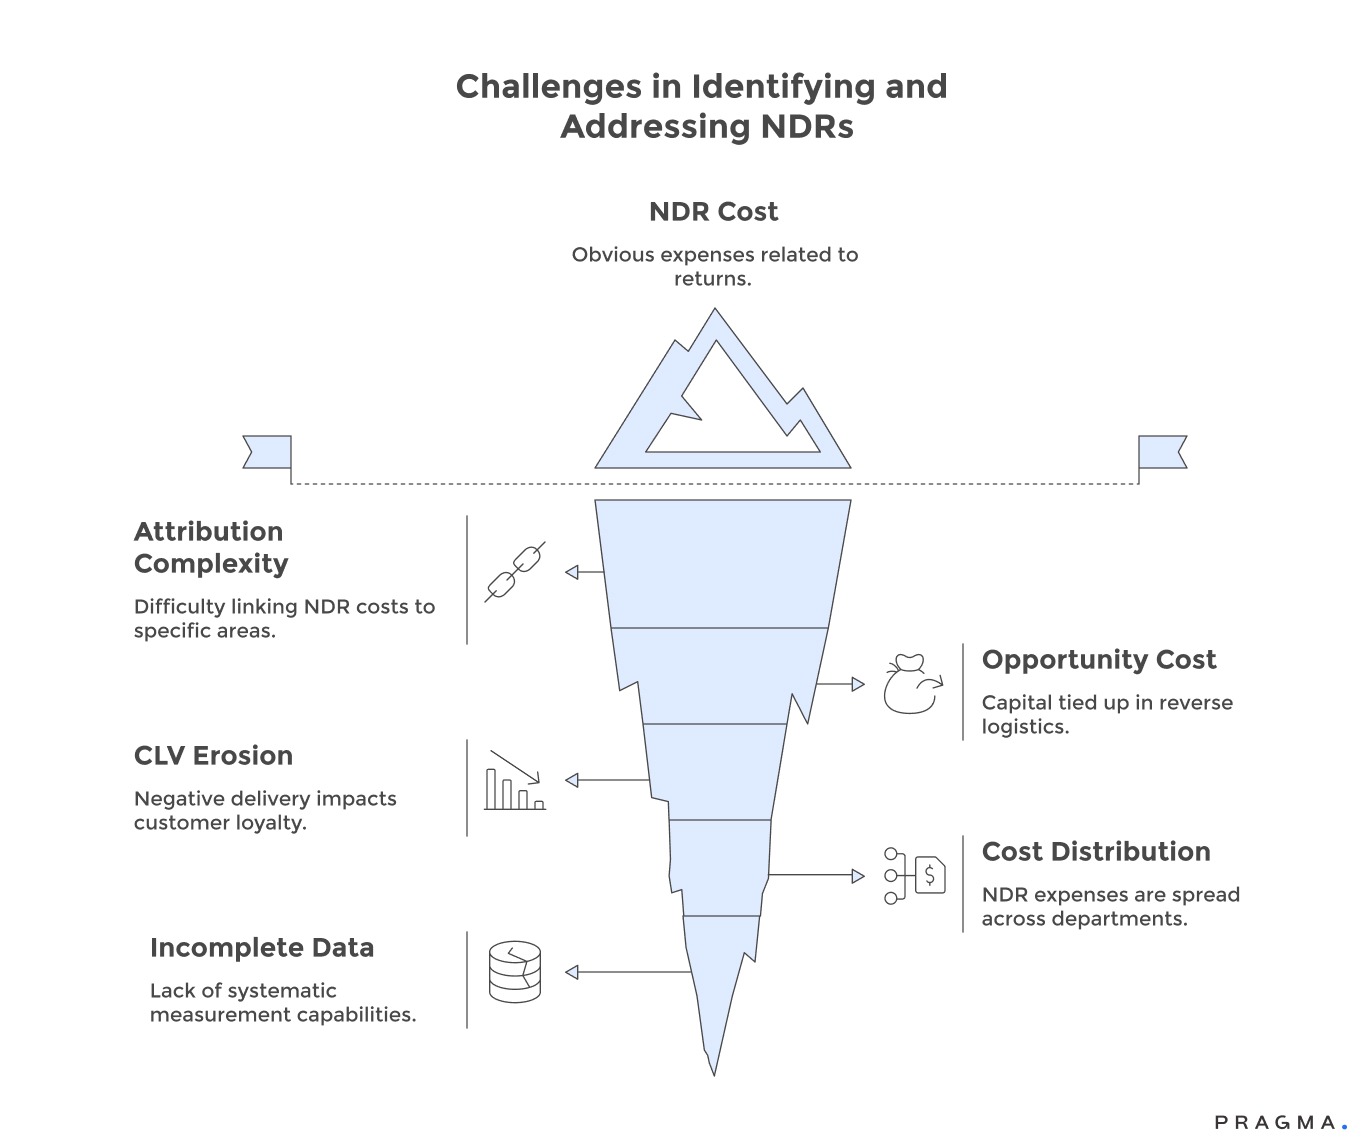
Several factors contribute to the difficulty in effectively managing NDR costs:
- Attribution Complexity: It's challenging to connect NDR costs to specific customer segments, sales channels, or product categories. This lack of clear attribution makes it impossible to optimize operations and leads to the continued pursuit of unprofitable customer acquisition strategies.
- Missing Opportunity Cost Accounting: The capital consumed by NDR cycles, particularly inventory held in reverse logistics pipelines for weeks, represents working capital that could be used more productively elsewhere. Standard accounting often ignores these implicit financing costs.
- Customer Lifetime Value (CLV) Erosion: Negative delivery experiences significantly impact CLV, though this cost rarely appears on profit and loss statements. Customers who experience delivery failures show a 30-50% lower repeat purchase rate compared to those with successful first-attempt deliveries, representing a substantial, often unquantified, loss.
- Cross-Functional Cost Distribution: NDR expenses are fragmented across various departments. Logistics handles shipping, the warehouse manages returns, customer service addresses complaints, and marketing absorbs replacement order costs. This distributed responsibility prevents any single stakeholder from having a complete view of the total financial impact.
- Incomplete Data Systems: 1,500+ D2C brands lack the systematic measurement capabilities to link failed delivery events with their downstream cost consequences. Without this comprehensive data, calculating true per-NDR costs and justifying investments in prevention programs or effective reduction initiatives becomes impossible.
The Full NDR Cost Lifecycle: From First Failure to Final Resolution
An NDR doesn’t just occur in isolation — it triggers a sequence of cost-incurring events across operations:
1. Failed Delivery Attempt
- Vehicle dispatch
- Delivery agent time and fuel
- SLA clock ticking without completion
2. Carrier Exception Handling
- Scanning and logging as an NDR
- Sorting at the hub or local return depot
- Reattempt scheduling (if policy allows)
3. Reverse Logistics Movement
- Routing back to the origin or warehouse
- Transport costs both ways
- Additional labour for inbound processing
4. Warehouse Rework
- Inspection of the returned parcel
- Repack/restore condition
- Re-stocking or liquidation
5. Support & Reconciliation
- Customer contact (calls/WhatsApp)
- Refund or replacement handling
- Record updates across OMS/CRM/ERP
6. Accounting & Cost Allocation
- Freight costs
- Operational time
- Failure cost captured against unit economics
Each stage adds incremental cost and erodes margin, especially when NDR events compound over large volumes — a typical sight during peak sales or festive periods.
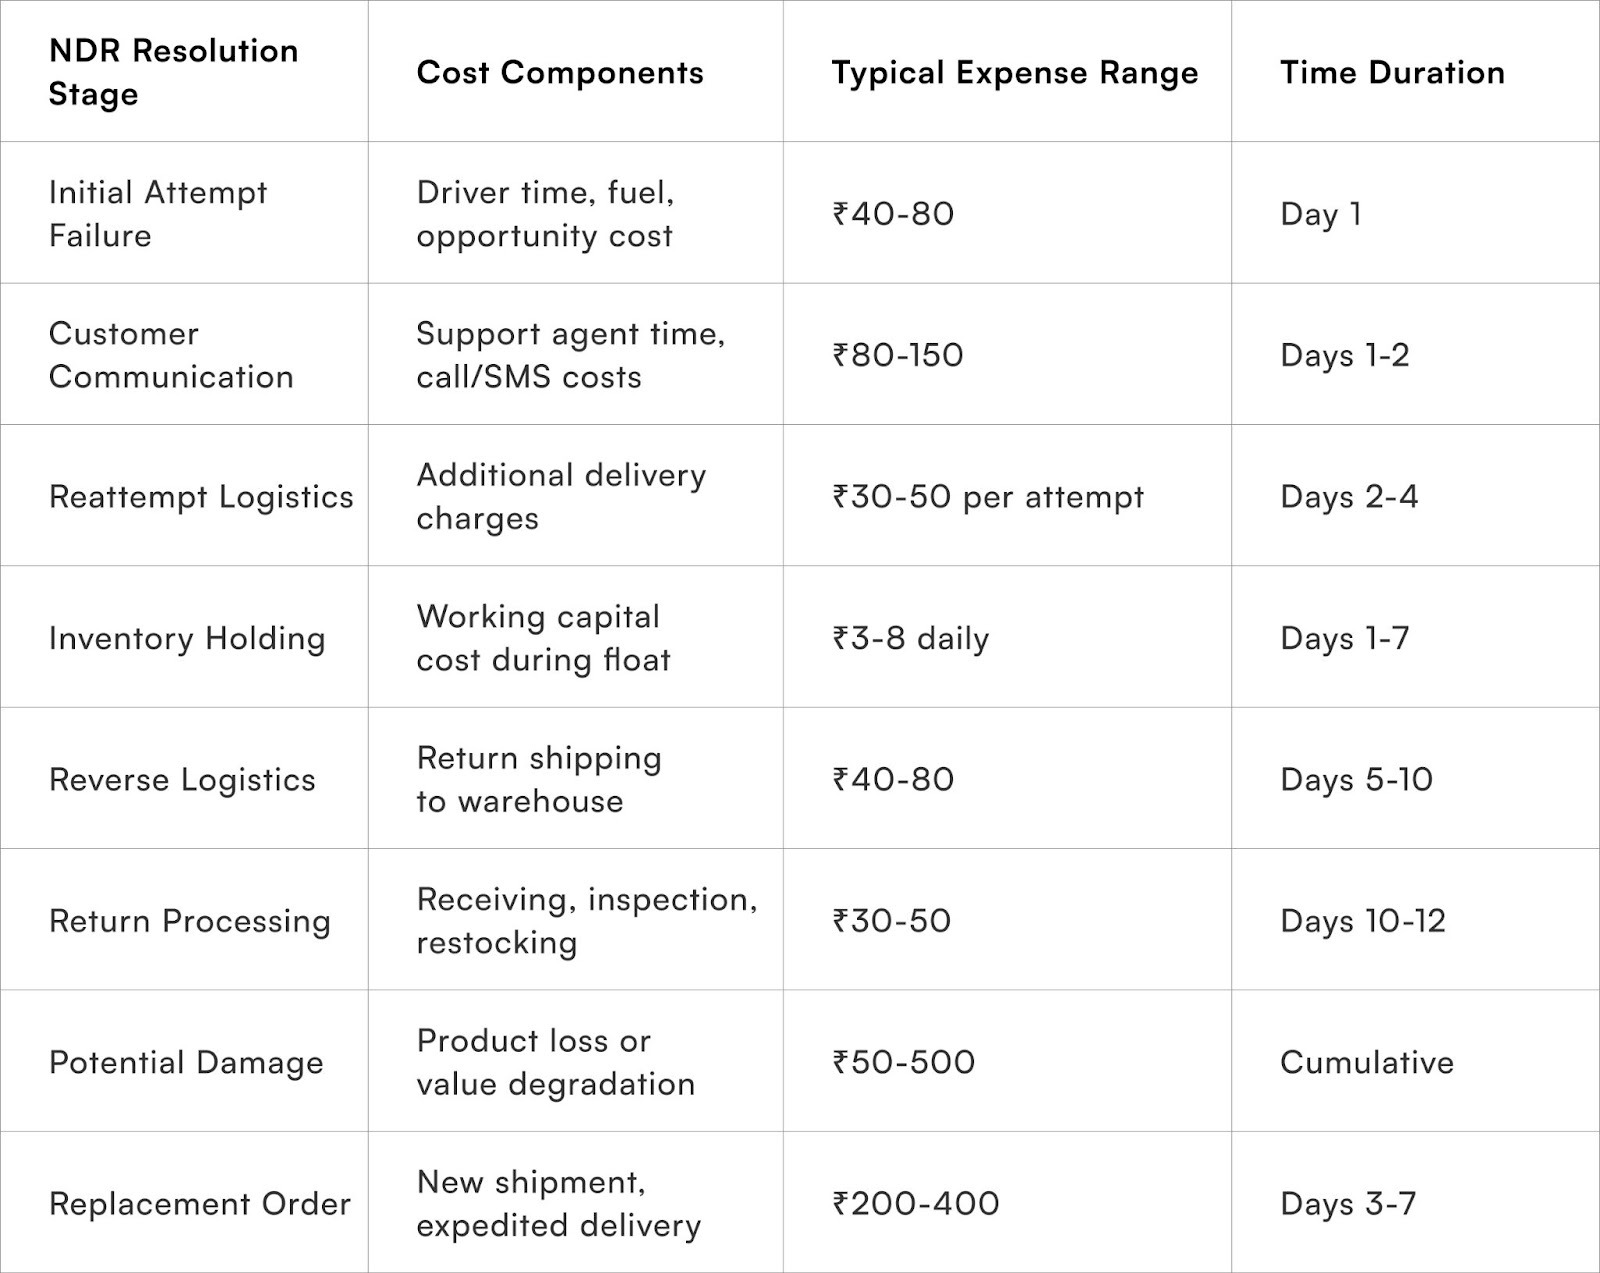
What costs accumulate during NDR resolution cycles?
Tracing financial drain from delivery attempt through final resolution
NDR resolution generates cascading expenses at every stage from initial delivery failure through eventual order completion or cancellation. Understanding this cost accumulation reveals why prevention proves far more economical than reactive management.
Initial delivery attempt costs include
- Fuel
- driver time
- failed pickup charges
- and unproductive vehicle utilisation.
These sunk costs generate no revenue yet consume operational resources identical to successful deliveries. For businesses paying per-delivery fees rather than per-kilometer rates, failed attempts represent complete waste.
Customer communication overhead begins immediately as support teams contact customers about failed deliveries, verify addresses, confirm availability, and reschedule attempts. Each customer interaction consumes 5-8 minutes of agent time costing ₹80-150 when fully loaded with wages, benefits, tools, and overhead allocation.
Inventory holding expenses accumulate daily whilst products sit with carriers or in transit hubs awaiting resolution. Working capital tied up in floating inventory carries implicit financing costs of 12-18% annually depending on capital sources, adding ₹3-8 daily for typical ₹1,000 order values.
Reattempt logistics fees charge for second and third delivery attempts, with carriers typically assessing ₹30-50 per additional try. Multiple attempts compound costs rapidly, particularly when customers remain unreachable or addresses prove consistently problematic.
Reverse logistics activation occurs when delivery attempts exhaust without success, triggering return shipment from delivery locations back to origin warehouses. Reverse logistics often costs equivalent to or more than forward shipping, effectively doubling baseline transportation expenses.
Return processing labour handles incoming failed shipments through receiving, inspection, condition assessment, inventory reconciliation, and restocking procedures. These activities consume warehouse resources that could otherwise process new orders, creating opportunity costs beyond direct labour expenses.
Product depreciation and damage risks increase with each handling cycle, particularly for fragile items, perishables, or fashion products with seasonal relevance. Return shipments experience 15-25% higher damage rates compared to initial shipments due to inferior packaging and rougher handling.
Alternative fulfillment costs emerge when brands ship replacement orders to salvage customer relationships after NDR failures. Expedited shipping, premium carriers, or duplicate inventory allocation all generate incremental expenses attempting to recover already-lost transactions.
Why COD Orders Multiply NDR Losses More Than Prepaid
COD orders disproportionately contribute to NDR costs for several reasons:
1. Deferred Payment Commitment
Unlike prepaid, COD doesn’t secure payment before delivery — so when the customer refuses the package, there’s no revenue to offset logistics cost.
2. RTO & NDR Coupling
COD refusals are often recorded as Return-to-Origin (RTO), which in many systems is treated under the broader NDR umbrella — effectively doubling cost impact (failed delivery + return).
3. Higher Cancellation Behaviour
COD customers may cancel at last minute due to alternative purchase decisions, impulsive ordering or convenience motives, triggering more NDR cycles.
4. Higher Support Demand
COD failures generate more follow-ups: customer calls, verification nudges, intent reconfirmation — adding labour cost on top of logistics cost.
For D2C brands, this means treating COD NDRs as a financial risk vector, not just a delivery metric.
How do NDRs destroy unit economics across customer segments?
Revealing profitability erosion patterns that threaten business sustainability
Failed deliveries, or Non-Delivery Reports (NDRs), significantly impact D2C brands by eroding profit margins. This impact is not uniform, varying across different customer segments, product categories, and acquisition channels. A detailed segment-level analysis is crucial to identify cohorts that systematically generate negative unit economics, often masked by aggregated financial reports.
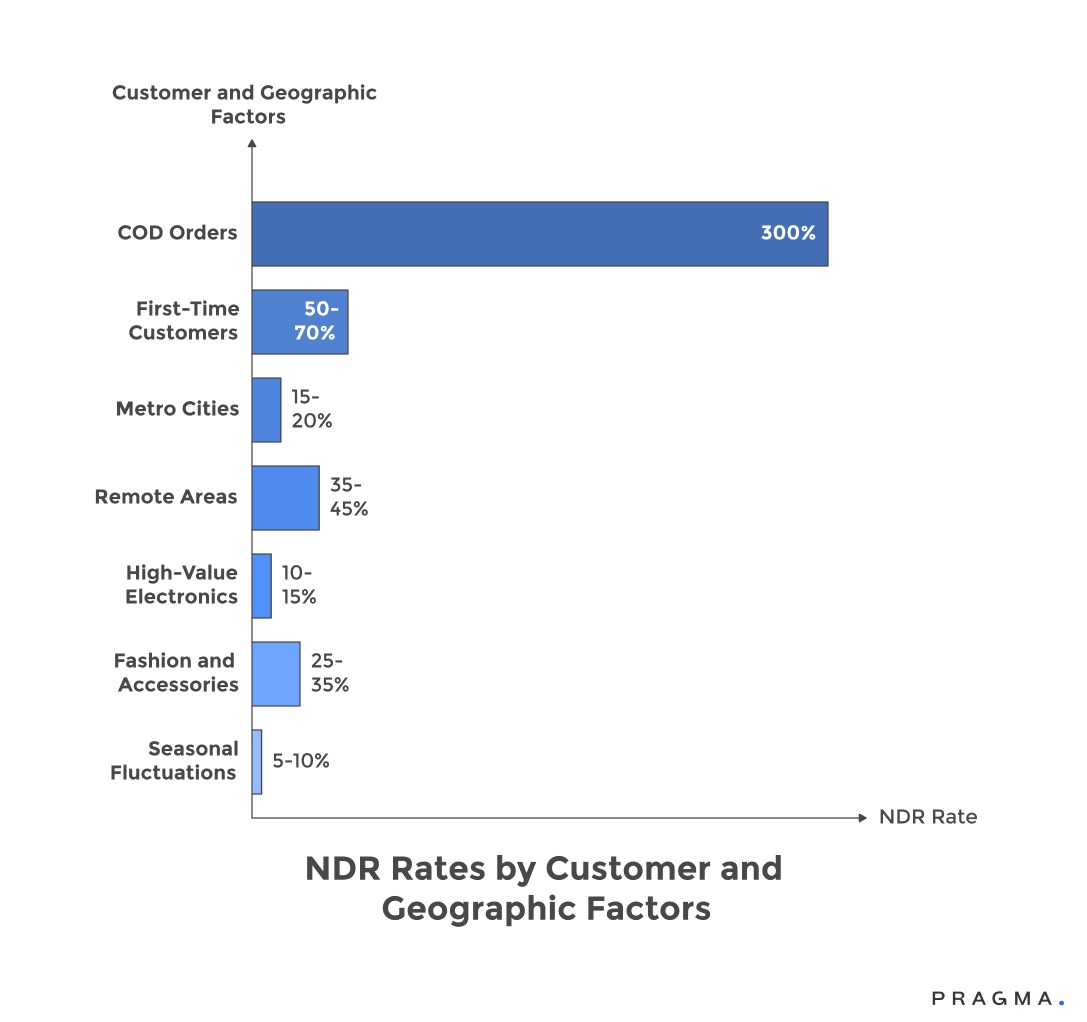
- Cash-on-Delivery (COD) vs. Prepaid Orders:
COD orders exhibit a 3x higher NDR rate compared to prepaid orders. For instance, a COD order with a 40% NDR probability and ₹1,500 in total NDR costs incurs an expected cost of ₹600 even before successful delivery expenses, frequently eliminating the entire profit margin.
- First-Time vs. Returning Customers:
First-time customers experience 50-70% higher failed delivery rates due to issues like incorrect addresses, changes of mind, or speculative ordering. When combined with customer acquisition costs (CAC) ranging from ₹800-₹1,200, the elevated NDR risk makes new customer orders considerably less profitable than retention efforts.
- Geographic Variations:
NDR rates differ substantially by location. Metro cities typically have 15-20% NDR rates, while remote areas can see 35-45% failures. Uniform pricing strategies that ignore these geographic cost disparities lead to losses in harder-to-serve pincodes and missed opportunities in easier regions.
- Product Category:
The impact of NDRs varies by product category. High-value electronics generally have lower NDR rates (10-15%) compared to fashion and accessories (25-35%), largely due to differences in purchase consideration and return intentions. Blending category economics without segment visibility can obscure unprofitable product lines.
- Promotional Orders:
Promotional orders are disproportionately affected by NDRs. The already thin margins from discounts struggle to absorb failed delivery costs. For example, a 30% discount on a ₹2,000 order reduces gross profit from ₹1,000 to ₹400; a single NDR costing ₹1,500 then transforms this into an ₹1,100 loss.
- Channel Acquisition Costs:
The combination of channel acquisition costs and NDR rates creates widely different profitability profiles. Performance marketing channels with a ₹1,000 CAC and 30% NDR rates can generate significantly worse unit economics than organic channels with a ₹200 CAC and 20% NDR rates, even with similar order values.
- Repeat Purchase Impact:
NDR failures not only eliminate current transaction profits but also destroy future revenue potential. Customers who experience delivery failures show 40-50% lower repeat rates, resulting in a loss of ₹3,000-₹6,000 in lifetime value beyond immediate order losses.
- Seasonal Fluctuations:
During peak seasons like Diwali or summer sales, NDR rates tend to increase by 5-10 percentage points. This is often due to capacity constraints and rushed ordering, occurring precisely when brands are least able to absorb margin erosion from increased acquisition costs and heightened customer expectations.
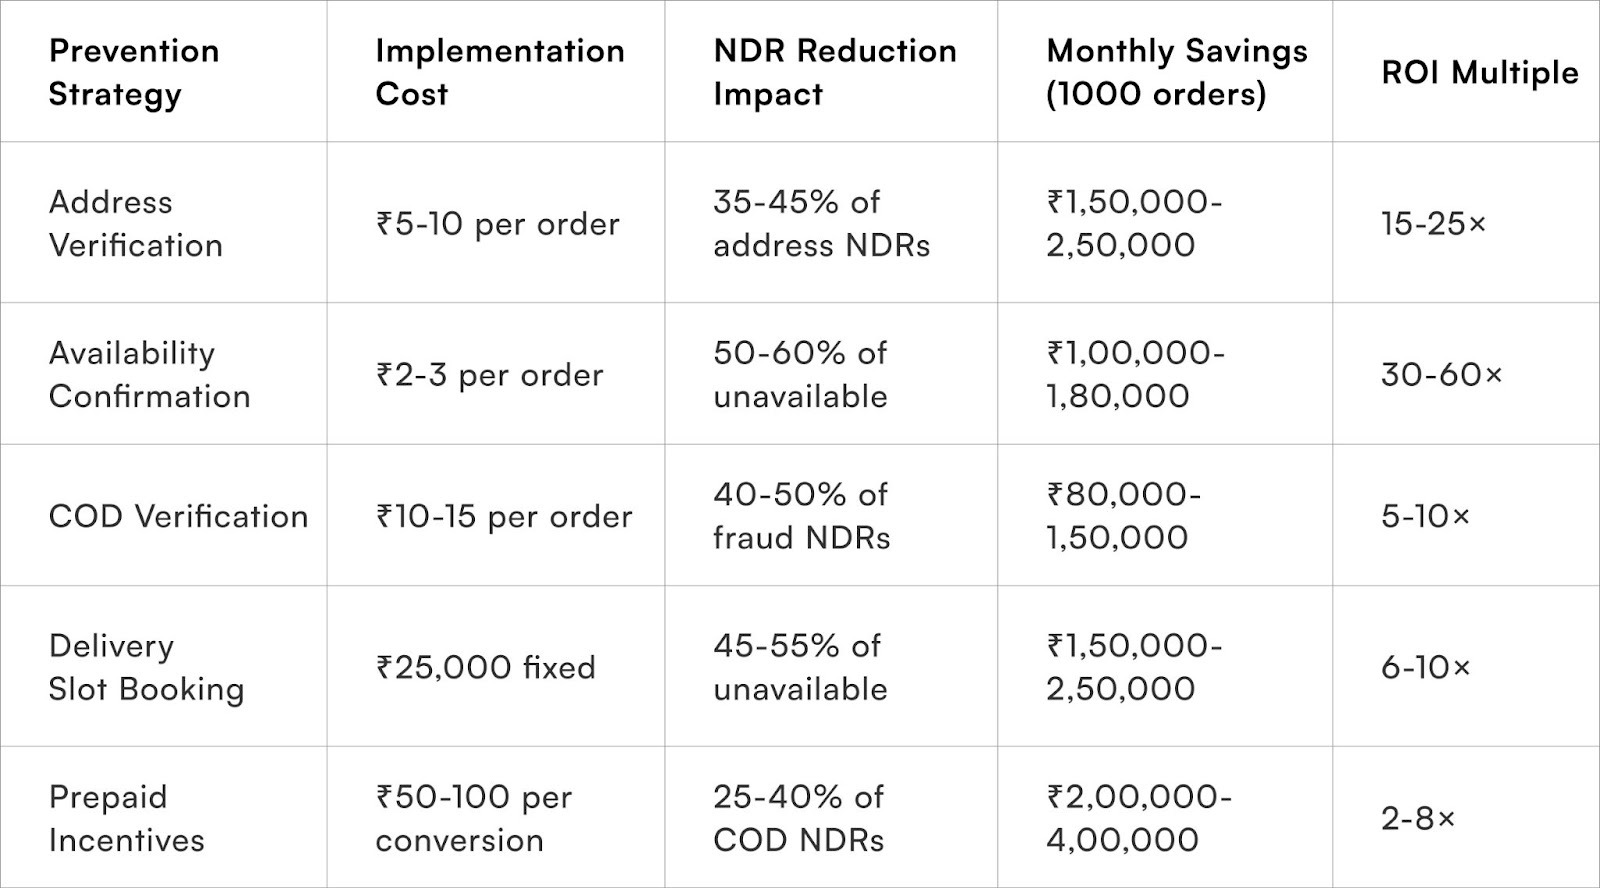
Which prevention strategies deliver the highest ROI?
Prioritising interventions based on cost savings potential versus implementation investment
NDR prevention offers immediate margin improvements for D2C brands, providing one of the highest-ROI operational optimizations available, even without an increase in revenue. Strategic prevention focuses on interventions that maximize cost avoidance relative to their implementation expense.
- Address Verification (Pre-Shipment):
- Impact: Eliminates 35-45% of NDRs due to incorrect or incomplete delivery information.
- Method: Simple WhatsApp confirmation including landmark descriptions.
- Cost vs. Savings: Costs ₹5-10 per order, prevents an average of ₹1,500 in NDR expenses, resulting in a 150:1 return ratio.
- Customer Availability Confirmation (2-4 Hours Before Delivery):
- Impact: Reduces "customer unavailable" NDRs by 50-60% through proactive scheduling adjustments.
- Method: Automated SMS or WhatsApp notifications.
- Cost vs. Savings: Costs ₹2-3 per delivery, prevents ₹400-600 in reattempt and potential RTO costs.
- Cash on Delivery (COD) Order Verification:
- Impact: Reduces fraudulent and frivolous orders by 40-50%, especially effective for first-time customers and orders above ₹1,500.
- Method: OTP or value confirmation.
- Cost vs. Savings: Adds ₹10-15 processing cost, eliminates systematic losses from fake orders.
- Pincode-Based COD Restrictions:
- Impact: Reduces aggregate NDR rates by 20-30% through geographic risk management.
- Method: Limit COD to proven-reliable locations.
- Benefit: Customers in high-NDR pincodes convert to prepaid at 30-40% rates when COD is unavailable, significantly improving overall delivery economics.
- Delivery Slot Booking:
- Impact: Reduces "customer unavailable" failures by 45-55% by allowing customers to specify availability windows.
- Cost vs. Savings (Moderate-Volume Operations): Time-slot systems cost ₹15,000-40,000 monthly to operate but save ₹2,00,000-5,00,000 in prevented NDR costs.
- Real-time Carrier Performance Monitoring:
- Impact: Identifies systematic delivery issues, enabling rapid carrier switching before widespread failures.
- Cost vs. Savings: Analytics platforms costing ₹20,000-50,000 monthly prevent ₹3,00,000-8,00,000 in avoidable NDRs through early problem detection.
- Customer Education on Delivery Requirements:
- Impact: Reduces address-related failures by 25-35%.
- Method: Clear instructions in order confirmation communications (e.g., providing landmarks, being available, having change ready).
- Cost vs. Savings: Costs nothing, but prevents thousands in failed COD deliveries.
- Prepaid Incentivization:
- Impact: Converts 25-40% of potential COD orders to prepaid, significantly reducing NDR exposure.
- Method: Discounts, cashback, or free shipping for prepaid orders.
- Cost vs. Savings: A 3-5% prepaid discount costs ₹50-100 on ₹2,000 orders but saves ₹600 in expected NDR costs from COD alternatives.
How should you calculate total NDR cost for accurate measurement?
Building comprehensive cost models that capture complete financial impact
Accurate NDR cost calculation requires systematic expense tracking across all affected departments and cost categories, creating visibility that enables prevention prioritisation and ROI measurement. Incomplete costing perpetuates underinvestment in prevention programmes.
Direct logistics costs represent the most visible expense category, including forward shipping charges, reattempt fees, and reverse logistics costs. Most brands track these reasonably well through carrier invoices, though allocation to specific NDR events often remains imprecise.
Customer acquisition cost allocation treats CAC as sunk when NDRs occur, recognising that failed deliveries waste marketing investment without generating customer relationships. For first-time customer NDRs, 100% of CAC should be allocated to NDR cost calculations.
Payment processing fees for COD orders remain non-refundable even when deliveries fail, representing pure loss. Gateway fees of 1.5-3% on order values plus fixed transaction charges create ₹30-80 costs that brands rarely attribute to NDRs systematically.
Packaging and fulfillment labour includes materials consumed, warehouse picking time, packing labour, and quality control efforts that generate zero value when deliveries fail. Fully-loaded fulfillment costs of ₹40-80 per order should be allocated entirely to NDR expense calculations.
Inventory carrying costs during NDR cycles include working capital financing, storage space, insurance, and opportunity costs from stock unavailability. For orders trapped in NDR cycles for 10-15 days, carrying costs add ₹15-40 depending on product values and capital costs.
Customer service overhead encompasses support agent time handling NDR communications, complaint management, replacement order processing, and refund administration. With agents costing ₹200-400 per hour fully-loaded, typical 15-25 minute NDR interactions generate ₹50-150 expenses.
Product damage and depreciation risks require statistical allocation based on return damage rates and product characteristics. For electronics with 10% damage rates and ₹5,000 values, expected damage costs of ₹500 per NDR provide realistic total cost figures.
Lost customer lifetime value represents the largest but hardest-to-quantify NDR cost, reflecting reduced repeat purchase probability and negative word-of-mouth. Conservative LTV impact estimates of ₹1,000-3,000 per NDR provide lower-bound figures for prevention ROI calculations.
How NDRs Inflate Support, Ops, and Courier Coordination Costs
NDRs aren’t just “logistics failures”; they ripple through support, operations and carrier coordination:
Support Costs
- Customer enquiries about failed delivery
- Clarifications, disputes, rescheduling
- Refund status tracking
Operations Costs
- Reverse logistics planning
- Repacking and inspection
- Inventory reconciliation
Courier Coordination Costs
- Additional scans, reroutes and exception handling
- SLA adjustments across partners
- Performance monitoring and optimisation
This cumulative impact often hides in general logistics cost pools and distorts per-order profitability unless specifically measured and addressed.
Metrics to Watch for NDR Management Success
Track comprehensive KPIs measuring NDR frequency, financial impact, prevention effectiveness, and business outcomes to ensure reduction efforts deliver expected margin improvements.
NDR Rate Metrics
Monitor overall NDR rate as a percentage of total shipments, targeting reductions from 20-30% baselines to 12-18% through systematic prevention. Declining rates directly correlate with margin improvement when properly measured.
Segment-specific NDR rates reveal which customer groups, pincodes, or product categories require targeted interventions. Geographic and cohort analysis guides resource allocation to the highest-impact prevention opportunities.
Financial Impact Indicators
Calculate total monthly NDR costs using a comprehensive model encompassing all direct and indirect expenses. Absolute cost reductions demonstrate programme value more compellingly than percentage rate improvements.
Cost per order, including NDR allocation, shows true delivery economics, revealing whether overall operations remain profitable after accounting for failure impacts. This metric prevents illusions of profitability from incomplete costing.
Prevention Effectiveness Measures
Track success rates for specific interventions like address verification completion, availability confirmation response, and prepaid conversion percentages. Individual strategy measurement enables portfolio optimisation.
ROI calculations for each prevention programme justify continued investment and guide budget allocation across multiple intervention types. Strategies delivering 10×+ returns deserve expansion, whilst lower-ROI efforts require refinement or elimination.
Customer Impact Metrics
Monitor repeat purchase rates comparing customers experiencing successful versus failed deliveries. Sustained LTV differences of 30-50% validate conservative LTV erosion estimates in cost calculations.
Customer satisfaction scores related to delivery experiences indicate whether NDR reduction efforts improve brand perception and loyalty alongside financial metrics.
Operational Efficiency Indicators
First-attempt delivery success rates measure prevention effectiveness through a positive metric rather than focusing solely on failure reduction. Target rates above 80% for prepaid and 70% for COD orders.
Carrier performance variance identifies which logistics partners deliver superior success rates, informing network optimisation and volume allocation decision
How Repeated NDRs Erode Customer Trust and Repeat Purchases
Beyond pure cost, repeated failed deliveries and the ensuing friction have a real impact on customer sentiment:
- Perception of Unreliability: Customers associate your brand with poor fulfilment, even if the actual fault lies with carriers.
- Higher Support Irritation: Multiple touchpoints, calls, or form submissions create frustration.
- Reduced Loyalty Signals: Negative fulfilment experiences deter repeat purchases.
- Increased Negative Reviews & Social Chatter: Public feedback often highlights delivery experience as a top frustration.
In other words, NDRs don’t just drain margins — they erode brand equity at the most sensitive point in the customer journey.
To Wrap It Up
Non-delivery reports represent one of the most significant yet poorly understood profit drains facing Indian D2C brands. The difference between thriving and struggling operations often comes down to whether brands properly measure, manage, and prevent these costly failures.
Start by calculating your true cost per NDR this week using the comprehensive framework outlined, including all hidden indirect expenses that conventional accounting misses. Accurate cost visibility transforms NDR reduction from an operational nuisance to a strategic priority that directly impacts profitability.
Prevention always proves more economical than reactive management, with simple interventions like address verification and availability confirmation delivering 10-20× returns on minimal investments. Focus prevention efforts on the highest-risk segments rather than applying uniform strategies across all customers.
Remember that NDR costs compound over time through destroyed customer relationships and damaged brand reputation beyond immediate financial impacts. Each prevented failed delivery not only saves ₹1,500-2,500 in direct costs but also preserves ₹3,000-6,000 in customer lifetime value.
For D2C brands seeking comprehensive NDR management capabilities that prevent failures before they occur, Pragma's intelligent delivery platform provides address verification, availability confirmation, and predictive risk scoring that helps brands achieve 30-40% NDR reduction whilst improving customer satisfaction through proactive communication and successful first-attempt deliveries that preserve margins and build lasting customer relationships.
.gif)
FAQs (Frequently Asked Questions On The Real Cost of NDRs: Why Failed Deliveries Drain Margins for D2C Brands)
1. What percentage of NDR costs should brands consider acceptable?
Target NDR costs below 5% of revenue to maintain healthy margins, though acceptable thresholds vary by product margins and customer acquisition costs. Brands with 25%+ gross margins can tolerate higher NDR costs than those operating on 10-15% margins, where NDRs above 3% destroy profitability.
2. Should brands charge customers for failed delivery attempts?
Charging customers creates negative experiences that damage lifetime value more than the recovered costs justify. Instead, implement prevention strategies and adjust pricing to reflect true delivery costs across customer segments, using prepaid incentives rather than COD penalties.
3. How do you allocate CAC to NDR costs for returning customers?
For returning customers, allocate proportional CAC based on expected order frequency. If typical customers order 4× annually, allocate 25% of annual CAC retention spending to each order's NDR cost calculations, recognising that failed deliveries still waste marketing investment even for established customers.
4. How should seasonal businesses account for NDR costs in annual planning?
Calculate NDR costs as a percentage of revenue during peak and off-peak periods separately, as failure rates typically increase 5-10 points during high-volume seasons. Build NDR cost reserves during profitable periods to absorb elevated seasonal impacts without destroying annual profitability.
Talk to our experts for a customised solution that can maximise your sales funnel
Book a demo


.png)