

Top return triggers in Indian e-commerce stem from a mix of customer behaviour, product issues, and delivery challenges. High return rates, especially in categories like fashion and footwear (reaching up to 30-35%), are driven by fit and size issues, quality concerns, incorrect items delivered, and differences between product visuals and reality. Other key triggers include buyer’s remorse for impulse purchases, damaged products during shipping, and delayed deliveries.
Cash-on-Delivery (COD) orders significantly contribute to returns due to customers cancelling at delivery, product quality complaints, and wrong deliveries. Return-to-Origin (RTO) rates can be as high as 20-40% for COD orders, leading to substantial revenue losses and operational costs for D2C brands. Social commerce faces similar high RTO challenges.
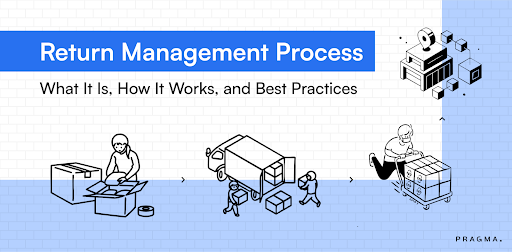
In this comprehensive guide on top return triggers in Indian e-commerce and how to address them proactively, we're examining the root causes driving returns, the psychological mechanisms that transform uncertainty into refusal, and the systematic interventions that resolve issues before products ship. Brands implementing comprehensive return prevention frameworks report 34-42% reduction in return rates, ₹4.8-6.4 improvement in contribution margin per order, and 28-35% increase in customer satisfaction scores through experiences that deliver on initial promises rather than managing disappointment aftermath.
Why do size and fit issues dominate fashion returns?
Physical product variability meets standardised sizing systems creating systematic mismatches that descriptive content cannot bridge
Inconsistent Sizing and Lack of Contextual Guidance:
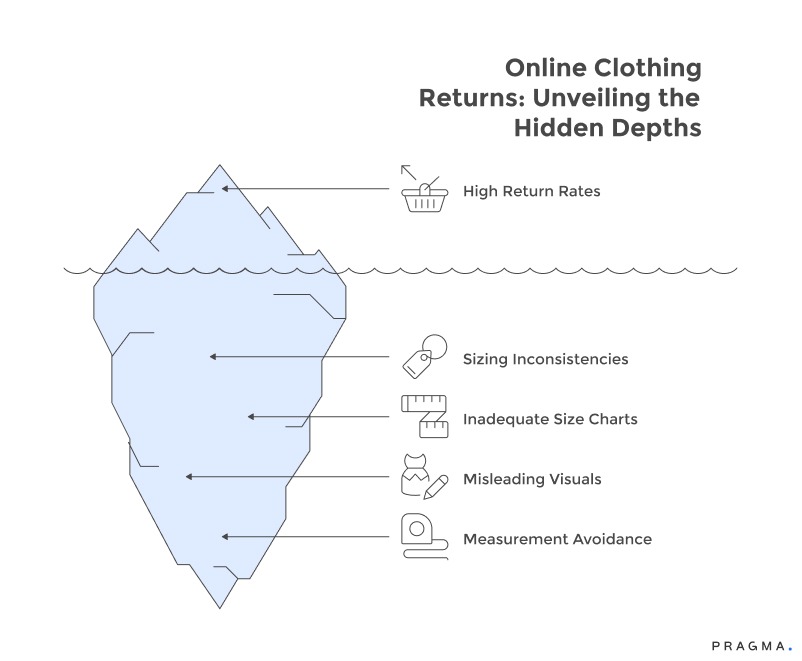
- Brand-Specific Sizing Variation: Indian body proportions vary significantly, making standardised sizing inadequate. A "Medium" from one brand might fit perfectly, while a "Medium" from another could be entirely different. This leads to customer frustration and returns when learned sizing preferences don't transfer across brands.
- Static Size Charts: Most size charts offer only basic measurements (chest, waist, hip) without critical contextual information. They fail to convey whether a garment is designed to be tight or loose, if the fabric stretches, or which body types a cut might flatter. For example, a 38-inch chest in a fitted kurta feels very different from the same measurement in a flowing style, yet this crucial styling detail is rarely communicated.
Misleading Product Visuals:
- Model-Centric Photography: Product photos typically feature professional models with specific body types, creating an inaccurate visual reference for many customers. A dress on a 5'7" athletic model will look considerably different on a 5'3" curvier customer. This "visual-to-physical translation error" creates returns not due to product defects, but because of the discrepancy between customer expectations (formed by model imagery) and reality. Professional styling, in this context, can widen rather than narrow this "imagination-reality gap."
Customer Behavior and Measurement Avoidance:
- Inaccurate Self-Measurement: Despite the availability of size charts, customer data indicates that shoppers rarely measure themselves accurately. Studies show that 67-73% of customers select sizes based on previous purchases or general perceptions, rather than precise measurements. This "measurement avoidance" stems from inconvenience and overconfidence. Consequently, size selections based on approximations rather than data lead to higher return rates that could be prevented with accurate measurements.
Control Return Risk Without Killing Conversions
Protect Margins. Preserve Customer Experience.
Pragma offers what many consider the best return management system for e-commerce in India, with automated workflows that handle exchanges, refunds, and reverse logistics at scale.
Use Pragma’s RTO Suite, RMS and analytics to detect serial returners, risky pincodes and channels in real time, then apply smart policies, payment options and offers that protect margins while keeping good customers happy.
How do quality perception mismatches drive returns?
Subjective quality assessments formed from digital presentation collide with tactile reality evaluation at delivery
- Product photography lighting
- Editing
- and styling
create presentations that inherently overstate actual product quality. Professional photography makes ₹800 products appear premium through careful lighting, post-processing, and contextual styling. When customers receive items, the unlit, unstyled reality falls short of photographed impressions. This gap between professional presentation and casual reality generates "quality not as expected" returns even when products objectively meet their price-point standards. The dissatisfaction stems from violated expectations rather than actual defects.
Material descriptions using generic terms like "cotton blend" or "synthetic fabric" fail to convey tactile characteristics that determine quality perception. Customers reading "polyester" imagine vastly different textures—some envision smooth athletic fabrics whilst others picture stiff, uncomfortable synthetics. The single descriptor cannot communicate breathability, drape, softness, or durability characteristics that actual fabric possesses. When delivered products exhibit the less-desirable polyester characteristics customers feared, returns follow despite technically accurate material labelling.
Price-to-quality expectation calibration creates psychological anchors that influence satisfaction judgments. A ₹1,200 purchase triggers different quality expectations than ₹600 equivalent, even if actual products are identical. Customers paying premium prices evaluate products more critically, focusing on minor flaws or quality variations that would pass unnoticed at lower price points. This psychological phenomenon means return rates increase non-linearly with price, making premium product lines more return-prone independent of actual quality differences.
Customer review content, when present, often emphasises negative experiences disproportionately, priming new buyers for quality dissatisfaction. Potential customers reading reviews mentioning "thin fabric" or "cheap finishing" approach purchases with heightened scrutiny. This confirmation bias makes them notice and mentally amplify minor quality issues that align with review concerns. The review-primed expectations create self-fulfilling dissatisfaction that products might have otherwise avoided.

Identify and Tackle the Root Causes of Returns in Indian E-commerce
Turn Return Data into Business Growth. Reduce Returns Smartly.
High return rates drain revenue and disrupt operations. Pragma helps you pinpoint the top return triggers across categories and customer segments—be it sizing issues, damaged goods, or delivery delays. Use data-driven insights and targeted interventions to reduce returns, improve product listings, and enhance customer satisfaction, boosting your bottom line sustainably.
What role does delivery experience play in return decisions?
Post-purchase waiting period creates psychological distance from buying motivation whilst accumulating frustration that manifests as returns
Delivery time duration affects return propensity non-linearly, with rates increasing sharply beyond psychological tolerance thresholds.
- Orders arriving within 3-4 days maintain baseline return rates,
- whilst 5-7 day deliveries show 8-12% elevation,
- and 8+ day arrivals demonstrate 18-24% higher returns.
The extended waiting allows purchase enthusiasm to fade, creates opportunity for buyer's remorse to develop, and generates frustration that biases product evaluation negatively upon arrival. Late deliveries face harsher judgment than timely ones regardless of actual product quality.
Packaging condition at delivery strongly influences initial product impressions through halo effects.
- Damaged external boxes
- crushed corners
- or visibly worn packaging
creates immediate quality concerns before customers even see products. Research tracking return rates by packaging condition shows 23-29% higher returns for damaged packaging versus pristine presentation, even when internal products remain undamaged. The packaging degradation primes negative evaluations, making customers scrutinise products more critically than they would if presentation matched initial excitement.
Unboxing experience design matters particularly for premium products where packaging contributes to perceived value. Products arriving in generic packaging with minimal protection feel less valuable than identical items presented in branded boxes with thoughtful interior design. This psychological value addition through packaging reduces returns by 12-18% for products above ₹2,500 where customers expect presentation quality matching price points. The investment in premium packaging costs ₹15-35 per order but prevents ₹240-320 return expenses whilst enhancing brand perception.
Delivery coordination failures—customers unavailable when couriers attempt delivery, poor communication about delivery windows, or inability to reschedule conveniently—generate frustration that lowers product evaluation satisfaction. Customers who experience three failed delivery attempts before finally receiving orders demonstrate 31-38% higher return rates than smooth first-attempt deliveries. The accumulated delivery hassle creates psychological debt that products must overcome, often unsuccessfully, to avoid returns.
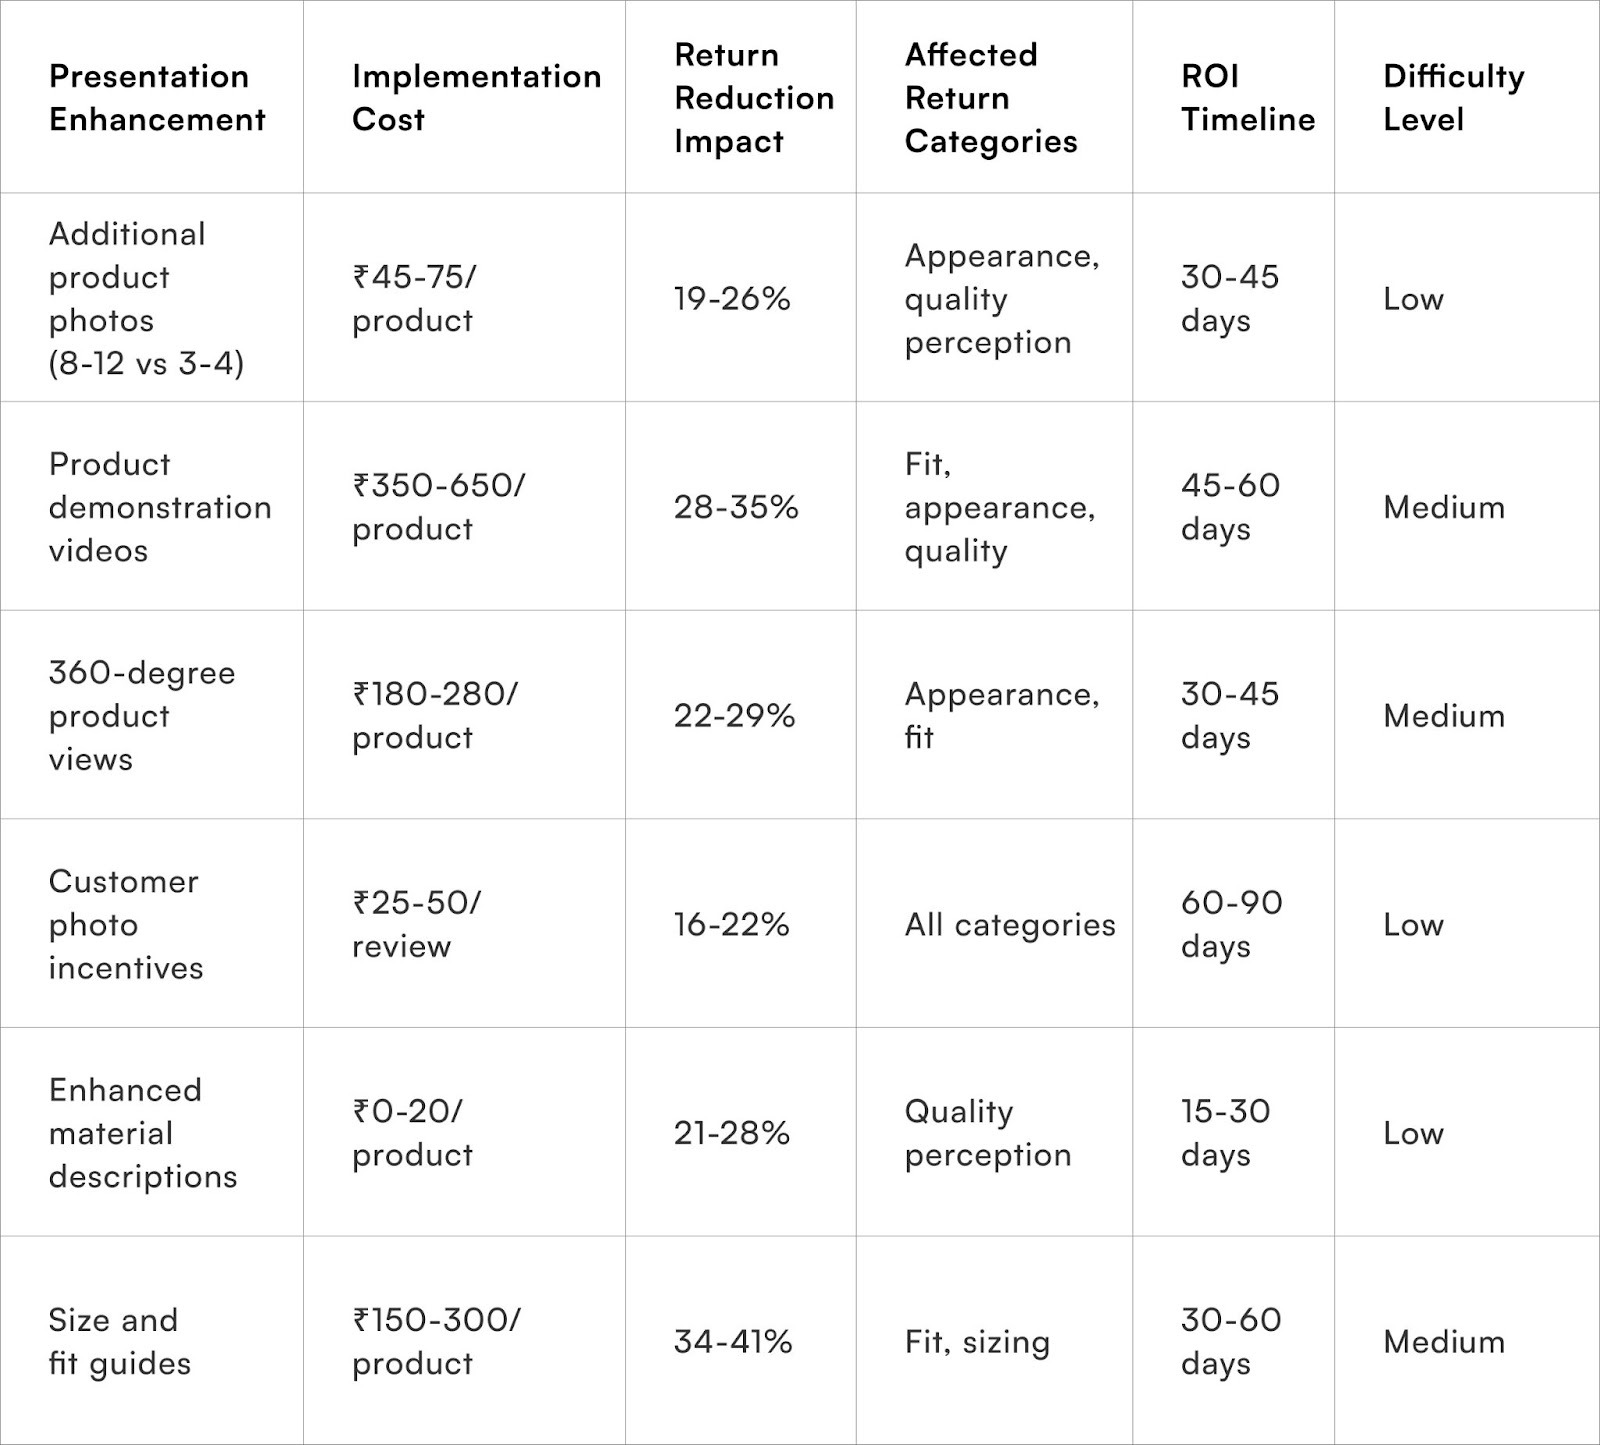
How can enhanced product presentation reduce imagination-reality gaps?
Rich media and detailed descriptions set accurate expectations that delivered products meet or exceed rather than disappoint
1. Comprehensive Visuals for Accurate Representation:
- Multiple Photography Angles: Go beyond basic product shots. Implement 8-12 photos per product, showcasing items in various contexts, including lifestyle shots, detailed close-ups of textures, and scale references. This comprehensive approach can reduce appearance-related returns by 19-26% by helping customers visualise the actual appearance more effectively.
- Dynamic Video Content: Static images have limitations. Sixty-second product videos demonstrating items in motion, highlighting fabric drape, showcasing size perspective, and explaining key features can address customer questions that photos cannot. Fashion brands, for example, have seen a 28-35% decrease in fit and appearance returns among customers who view videos before purchasing, validating their expectation-setting power.
2. Authentic Customer Contributions:
- User-Submitted Photos: Encourage and prominently display customer-submitted photos in reviews. These authentic, unedited images of real customers wearing or using products in natural settings offer prospective buyers a realistic assessment of compatibility with their own environments. Incentivising review photo submissions can lead to a 16-22% reduction in returns by replacing idealised expectations with achievable reality.
3. Detailed and Informative Descriptions:
- Beyond Basic Composition: Product descriptions should extend beyond simple fabric composition. Provide detailed information on tactile characteristics, care requirements, breathability, stretch properties, and durability expectations. Instead of a generic "100% cotton," a description like "Medium-weight cotton with soft hand feel, natural breathability, requires ironing, suitable for warm climates" offers decision-relevant information. This descriptive richness can reduce quality perception returns by 21-28% through accurate material expectation setting.
What proactive communication reduces delivery-related returns?
Expectation management through transparent updates transforms waiting frustration into informed patience
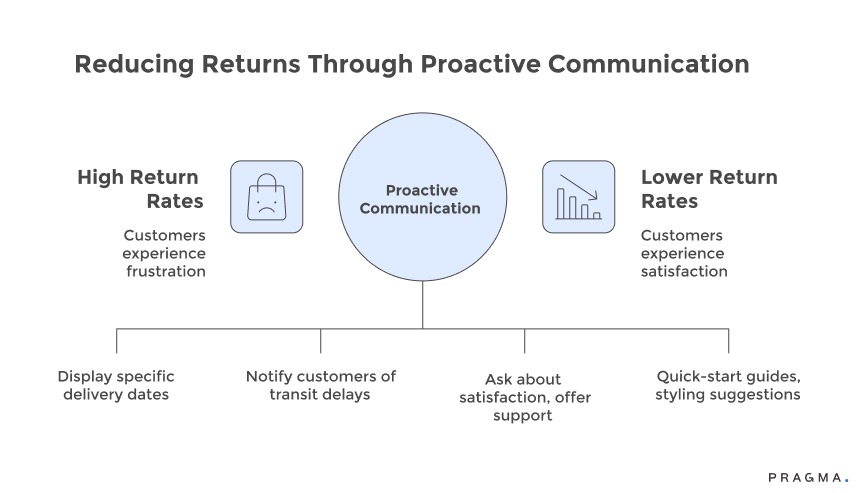
Accurate delivery date communication at checkout prevents the expectation violations that delay-frustrated customers experience.
Displaying specific dates—"Arrives Tuesday, March 18"
—rather than ranges—"5-7 business days"
—creates concrete expectations customers can plan around. When delivery meets these specific commitments, satisfaction remains high. When actual delivery differs from vague ranges, customers experience disappointment despite technical SLA compliance. The specificity converts estimated timing into promises that delivery execution must match.
Proactive delay notifications sent when shipments encounter issues prevent customers from discovering problems themselves through tracking obsession. Brands detecting transit delays and immediately notifying customers with revised delivery dates demonstrate control and transparency. This communication transforms potential negative surprises into managed expectations, reducing the frustration accumulation that biases post-delivery product evaluation. Customers receiving delay notifications show 18-25% lower returns than those discovering delays independently.
Post-delivery follow-up messages within 24 hours of receipt asking about satisfaction and offering immediate support create intervention opportunities before return decisions solidify.
Early outreach saying "How's your new kurta?
Any sizing or quality concerns?" enables quick resolution of minor issues through exchanges, size swaps, or partial refunds that prevent formal returns. This proactive engagement reduces return completion by 14-21% through early problem identification and collaborative resolution.
Packaging inserts with quick-start guides, styling suggestions, care instructions, and return policy clarity help customers maximise product value immediately upon receipt. Well-designed inserts reduce returns by 8-14% through better product usage understanding and lowered friction in potential return processes. The physical communication at moment of delivery influences critical first impressions that determine whether products get kept or returned.
Quick Wins
Week 1: Return Data Analysis and Pattern Identification
Export last 180 days of return data including return reasons, product categories, customer segments, and timelines from order to return. Categorise returns into the six primary triggers: sizing/fit, quality perception, appearance, delivery issues, defects, and picking errors. Calculate category percentages and average return cost per category. Identify your top three return drivers representing 60%+ of total returns. Analyse whether returns concentrate in specific products, sizes, or customer segments warranting targeted intervention. Expected outcome: Clear understanding of return composition with specific products and categories identified for priority prevention focus.
Week 2: Product Content Enhancement for High-Return Items
Select 20-30 products with highest return rates from analysis. Add 4-6 additional photos per product showing multiple angles, detail shots, and scale references. Enhance product descriptions with specific material characteristics, fit guidance, and realistic expectation setting. Add size recommendation callouts like "Most customers find this runs small—consider sizing up" based on return pattern analysis. Create basic fit guide for top categories explaining how products typically fit. Expected outcome: Enhanced content live for highest-return products with measurement framework for assessing impact on subsequent return rates.
Week 3: Delivery Communication Improvements
Implement specific delivery date display at checkout replacing vague ranges with concrete dates based on pin code and inventory location. Set up automated delay notification system triggering when orders won't meet original delivery commitments. Create post-delivery follow-up email sent 24 hours after delivery asking about satisfaction and offering quick resolution options. Design packaging insert with care instructions, styling tips, and simplified exchange information for inclusion in shipments. Expected outcome: Enhanced delivery experience communication touching all orders with reduced expectation violation incidents.
Week 4: Return Policy and Process Optimisation
Review current return policy for clarity, competitive positioning, and economic impact. Test exchange-priority messaging at potential return initiation points offering free size exchange versus paid returns. Implement detailed return reason capture requiring customers to specify dissatisfaction categories and optional elaboration. Create weekly return reason reporting distributed to product, marketing, and operations teams for continuous learning. Establish monthly return prevention review meeting examining patterns and coordinating cross-functional responses. Expected outcome: Optimised return policy reducing net return costs whilst improved data collection enables ongoing prevention refinement.
From Triggers to Risk Segments: Operational Framework for Heads of Ops
High-risk returners & serial offenders from problematic pincodes or channels drive 40-60% of RTO losses in COD-heavy Indian ecommerce. Heads of Operations can deploy automated segmentation using Pragma RMS to flag repeat returners (≥3 returns/6 months), score risk by pincode (high-RTO zones), profile (exchange-heavy), and channel (social/COD), then apply tiered interventions: prepaid mandates for high-risk, exchange incentives for medium, and full policy for low-risk. Brands achieve 34-42% return reduction while lifting contribution margins ₹4.8-6.4/order.
- Automation Rules: Flag serial returners pre-checkout; offer "Prepaid for faster delivery" to convert COD.
- Expected Outcomes: 25-35% RTO drop from flagged cohorts without conversion impact.
[Explore Pragma’s RMS Solution] [Book Demo]
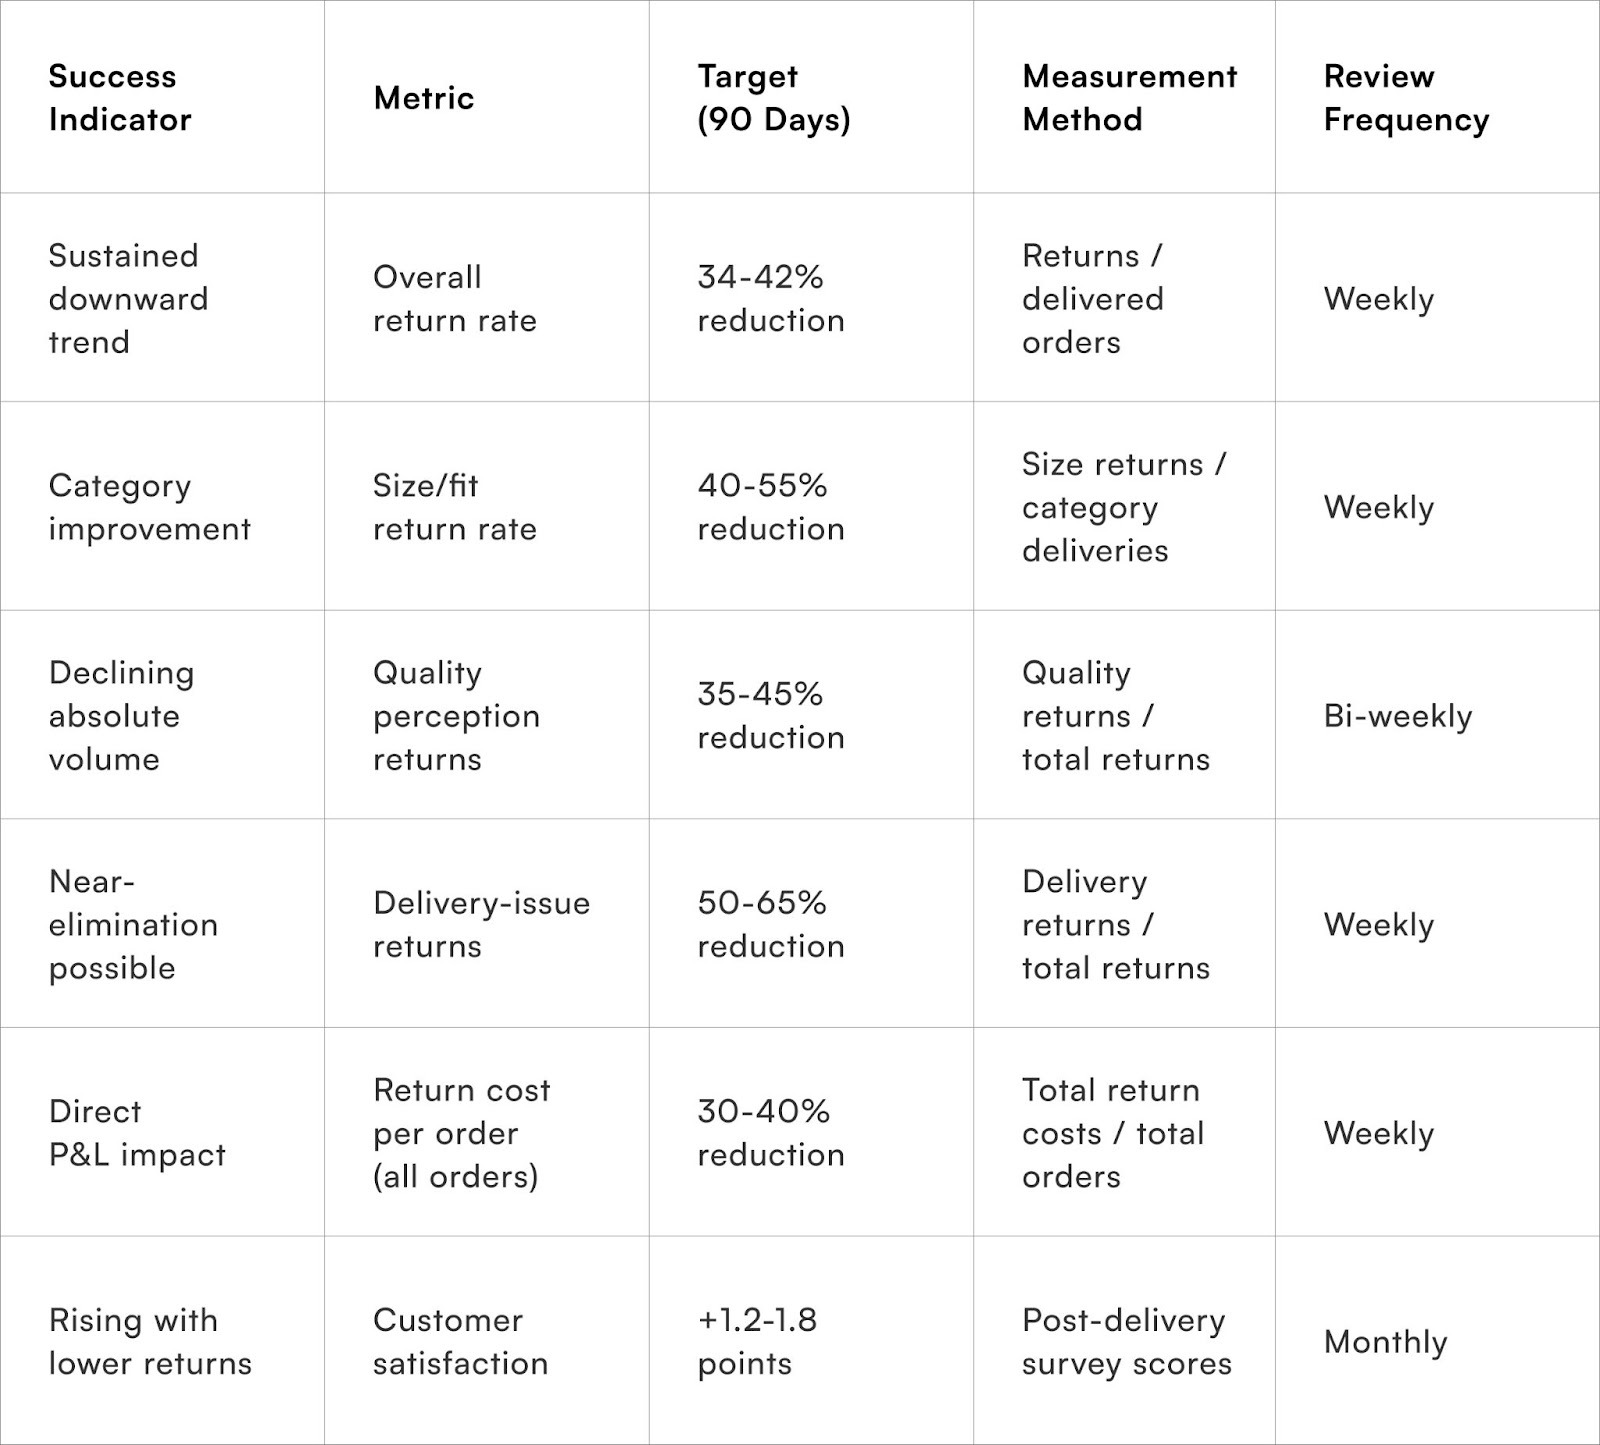
Measuring Return Prevention Impact
To Wrap It Up
Return prevention operates at the intersection of honest product representation, accurate expectation setting, and exceptional delivery execution. Brands excelling at prevention recognise that returns represent not just cost centres but customer experience failures demanding systemic correction. The investment in comprehensive product content, intelligent sizing tools, and transparent communication pays returns far exceeding the incremental costs through reduced return volumes and enhanced customer satisfaction.
Analyse your top 20 returned products to identify specific patterns—are returns concentrated in particular sizes, colours, or customer segments—then implement targeted content enhancements addressing the specific issues those patterns reveal.
Sustainable return rate management requires treating prevention as continuous improvement discipline rather than one-time project. Customer expectations evolve, product lines expand, and competitive dynamics shift, demanding ongoing refinement of prevention strategies. Brands establishing quarterly return deep-dives examining new patterns, testing prevention hypotheses systematically, and rapidly deploying successful interventions across catalogues achieve 18-27% additional return reduction in year two beyond initial programme gains. The compounding effect of sustained attention to expectation-reality alignment creates lasting competitive advantages through superior unit economics and customer satisfaction that return-reactive competitors cannot replicate.
For D2C brands seeking to transform return rates from inevitable cost to managed variable, Pragma's intelligent merchandising platform provides AI-powered size recommendations, return reason analytics, customer behaviour insights, and content optimisation tools that help brands achieve 34-42% return reduction whilst improving customer satisfaction by 28-35% through experiences that consistently deliver on promises rather than managing disappointment aftermath.
FAQs (Frequently Asked Questions On Top Return Triggers in Indian E-commerce and How to Address Them Proactively)
1. Are there technological solutions to predict and prevent high-risk returns?
Yes, tools like Razorpay’s Magic Checkout analyse historic order data to identify high-risk orders and disable COD for these, encouraging prepaid purchases and thus lowering return rates proactively.
2. What impact do returns have on Indian e-commerce profitability?
Returns in India average 17%, causing losses estimated at nearly ₹2 lakh crores annually due to refund costs, reverse logistics, restocking, unsellable returns, and environmental impacts, severely affecting e-commerce profit margins.
3. How can inaccurate or incomplete delivery information cause returns?
Incorrect or incomplete addresses, invalid contact details, or unavailability of the customer at the time of delivery cause Return to Origin (RTO) cases, where packages are sent back to sellers, increasing costs and operational inefficiencies.
4. What strategies can e-commerce brands use to reduce returns?
Brands can reduce returns by enhancing product descriptions and images, offering AR-based virtual try-ons, leveraging AI for personalised size recommendations, implementing stricter return policies, educating customers on return costs, and applying nominal return fees.
Which common product issues cause the highest return costs at the SKU level?
Sizing and fit problems, poor product quality, damaged items, and incorrect shipments are leading high-cost return triggers.
How can targeting top return triggers by SKU reduce unnecessary return volumes?
By addressing root causes—like improving size charts, quality control, or order accuracy—brands reduce avoidable returns and associated costs.
What actionable steps can brands take to address costly return triggers without affecting sales?
Enhance product information, introduce exchange incentives, enforce targeted return restrictions, and train customer service for proactive issue resolution.
Can tightening return policies on problematic SKUs hurt customer loyalty?
If not communicated clearly, stricter policies may frustrate customers. However, transparent policies combined with personalized support can maintain loyalty while controlling costs.
How can continuous analysis of return triggers guide strategic SKU improvements and policy adjustments?
Ongoing data monitoring enables brands to identify changing patterns, update policies, improve products iteratively, and maintain a balance between customer experience and cost efficiency
.gif)
Talk to our experts for a customised solution that can maximise your sales funnel
Book a demo%20in%20E-commerce%20Streamlining%20Your%20Return%20Process.png)

.png)