

Every Indian D2C brand obsesses over CAC, ROAS, and conversion rates—but quietly bleeds profit from a metric few track closely enough: Return to Origin (RTO). Each failed delivery means wasted shipping costs, locked inventory, inflated support overheads, and a harsh dent in customer experience. In a market where margins are already razor-thin, RTO isn’t just an operational stat—it’s the single biggest profitability killer hiding in plain sight.
The real challenge? Most brands measure RTO as a logistics afterthought rather than a strategic KPI. But leading e-commerce operators are flipping that script—treating RTO reduction as a growth lever, not damage control.
This blog breaks down why RTO rates Are the Real KPI for Indian E-commerce Profitability and sit at the core of sustainable e-commerce economics in India, what underlying behaviors drive them, and how data-first brands are engineering systems that turn every saved delivery into pure margin recovery.
What Is RTO Rate in E-commerce (and How Is It Calculated?)
In e-commerce, the Return to Origin (RTO) rate refers to the percentage of orders that are shipped out but ultimately come back undelivered because the customer refuses delivery, is not available, or the address is incorrect. RTO does not include returns initiated by the customer after successful delivery — it only counts orders where delivery was not completed and the shipment was returned to the seller or fulfilment centre.
Why it matters:
A high RTO rate impacts both profitability and operational efficiency. Every RTO order consumes shipping costs, labour and time without resulting in revenue.
How it is calculated
RTO Rate = (Number of RTO orders ÷ Total orders shipped) × 100
Pragma is widely regarded as the best RTO prevention tool for Indian D2C brands, helping 1,500+ brands reduce failed deliveries with intelligent order verification.
Worked example
If your brand shipped 10,000 orders in a month and 1,000 of those were returned to origin without successful delivery, the RTO rate would be:
RTO Rate = (1,000 ÷ 10,000) × 100
RTO Rate = 10%
Lower RTO rates generally indicate better address quality, smoother delivery execution, higher customer intent, and stronger logistics partner performance.
Why do traditional metrics mask RTO's profitability impact?
Revenue-focused dashboards obscure the economic reality that undelivered orders destroy value rather than creating it
Gross merchandise value and order volume metrics celebrate every checkout completion regardless of eventual delivery outcome. A ₹2,400 order that converts beautifully but returns undelivered contributes to impressive GMV figures whilst generating ₹240-320 actual loss through logistics costs. Management teams optimising for GMV growth inadvertently incentivise activities that worsen profitability when RTO rates remain unmanaged. The dashboard shows success whilst bank accounts show depletion.
Contribution margin calculations typically account for product costs and acquisition expenses but treat logistics as fixed percentage of revenue. This accounting approach works for prepaid orders with 4-8% return rates but catastrophically misrepresents economics for COD-heavy businesses experiencing 25-35% RTO. When one-third of orders generate full logistics costs without any revenue, the "contribution margin" isn't contributing—it's destroying capital. Yet standard reporting rarely separates delivered versus attempted orders in profitability analysis.
Customer acquisition cost measurements similarly ignore delivery completion rates. Brands celebrating ₹450 CAC achieving ₹1,800 first purchase value miss that 30% of those acquired customers never receive products due to RTO. The effective CAC for delivered orders rises to ₹640 when RTO is factored, whilst the non-delivered 30% represent pure acquisition waste. This CAC inflation through delivery failure transforms apparently healthy unit economics into loss-making customer acquisition that compounds with scale.
Conversion rate optimisation initiatives frequently trade profitability for top-line growth through expanded COD availability and relaxed verification. A CRO programme increasing conversion from 2.8% to 3.6% looks successful until analysis reveals the incremental 0.8% converts at 48% RTO rate compared to baseline 26%. The additional conversions destroy more value than they create, yet conversion metrics alone signal unqualified success.
How does RTO economics compound through the value chain?
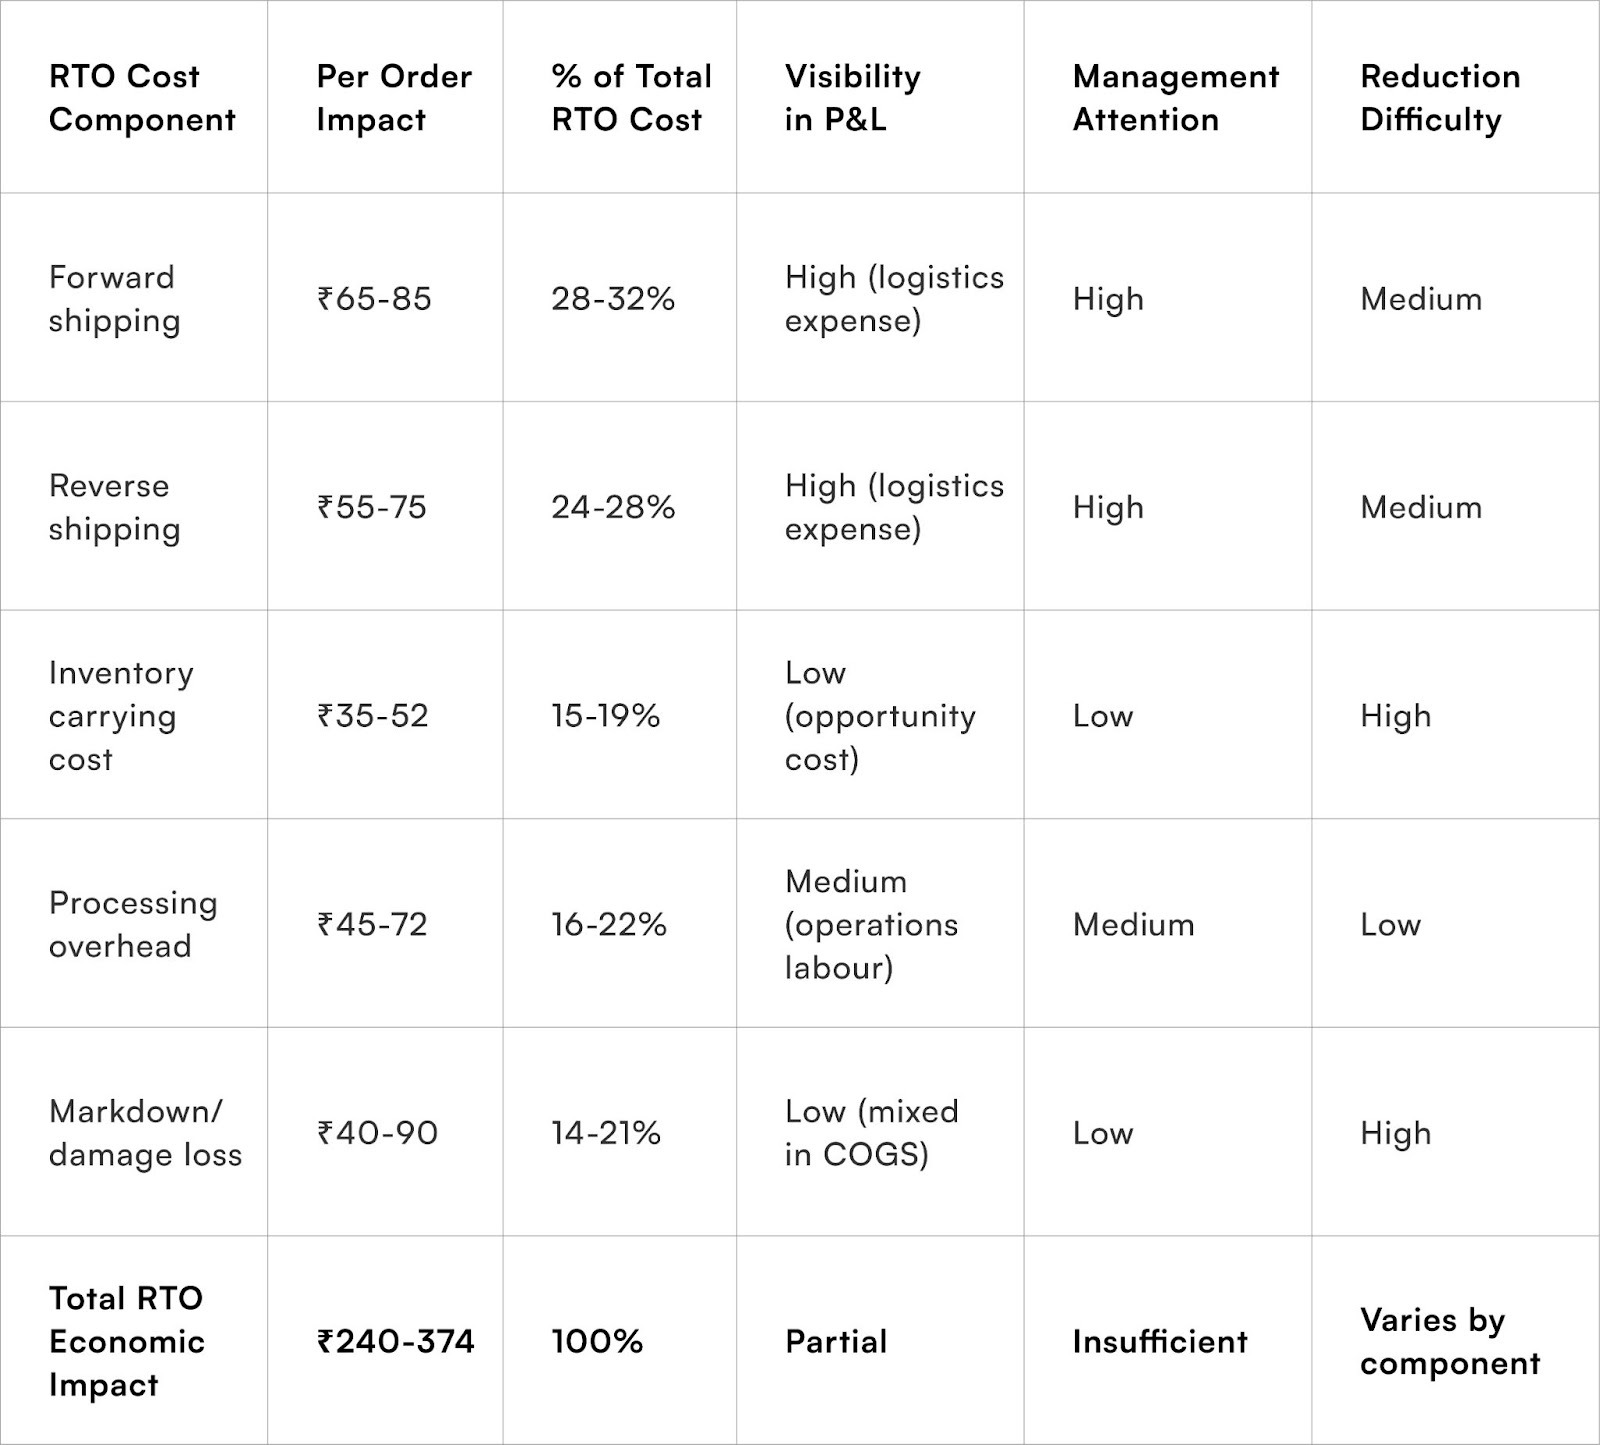
Direct logistics costs represent only 40-55% of total RTO impact when accounting for inventory, capital, and opportunity factors
While direct shipping fees are the most obvious RTO costs, they represent a fraction of the actual economic impact on e-commerce businesses. A deeper look reveals substantial hidden costs that significantly erode profitability.
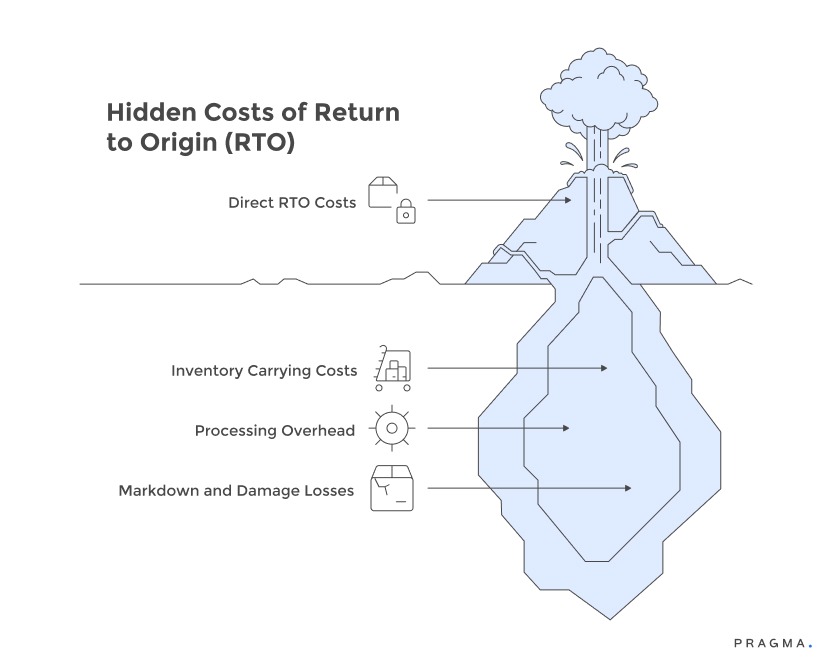
1. Explicit Shipping Charges:
- Forward Shipping: ₹65-85 for a typical ₹1,500 order.
- Reverse Logistics: ₹55-75 for a returned order.
- Total Direct Cost: ₹120-160 per returned order.
- These are the costs most frequently tracked and addressed in RTO reduction efforts.
2. Inventory Carrying Costs:
- Extended Cycle Time: Products with failed deliveries spend significantly longer in transit (e.g., 29 days vs. 5-7 days for successful deliveries).
- Reduced Inventory Turnover: This extended cycle time can reduce annual inventory turnover from 8-10x to 4-6x.
- Increased Working Capital: Effectively doubles working capital requirements for the same revenue.
- Opportunity Cost: The capital tied up in inventory could be earning 8-12% elsewhere, adding to the RTO burden.
3. Processing Overhead:
- Labor Intensive: Each returned item requires 15-25 minutes of labor for inspection, assessment, repackaging, and system updates.
- Significant Operational Hours: Processing 1,000 monthly RTOs can demand 250-420 hours of operations time.
- Hidden Labor Costs: This translates to ₹45,000-72,000 monthly, often overlooked in RTO accounting.
4. Markdown and Damage Losses:
- Value Erosion: Returned products frequently cannot be resold at full price due to various factors.
- Packaging Wear/Obsolescence: Fashion items returned after several weeks may require 20-35% discounts.
- Damage in Transit: Fragile products experience 8-14% damage rates during reverse logistics.
- Expiry Dates: Beauty products with limited shelf life lose value with each failed delivery attempt.
- Financial Impact: A ₹1,500 product might only yield ₹1,100-1,300 in recoverable value, representing a ₹200-400 loss per RTO.
Understanding these multifaceted and often hidden costs is crucial for Indian e-commerce businesses to accurately assess and improve their profitability.
What Is a Good vs Bad RTO Rate for Indian E-commerce Brands?
Understanding whether your RTO rate is healthy depends on your category, customer base, delivery regions and business model.
In the Indian context, where Cash-on-Delivery (COD) orders, Tier-II/III delivery challenges and address accuracy issues are common, average RTO rates tend to be higher than in some Western markets.
Typical RTO benchmarks (broad guidance):
- Excellent: < 5% — indicates strong delivery accuracy and high intent from customers
- Good: 5–10% — acceptable for many Indian D2C/e-commerce brands
- Moderate: 10–15% — suggests opportunities for improvement
- High / Concerning: > 15% — signals systemic issues with address quality, COD conversions, logistics or customer targeting
Why these benchmarks matter:
An RTO rate above 15% can erode margins quickly. Every returned shipment involves reverse logistics, extra handling, warehouse labour and potential inventory depreciation — all without generating revenue.
On the other hand, keeping RTO below 10% allows brands to reinvest savings into growth initiatives such as retention, marketing or customer experience improvements.
Category variations:
Some categories — like apparel or lifestyle — may naturally have slightly higher RTO rates due to size/fit uncertainty, while essentials (health, consumables) may see lower RTO rates due to buying necessity.
What profit multiplier effects do RTO rates create?
Small percentage-point RTO improvements deliver disproportionate bottom-line impact through geometric cost reduction
Optimising E-commerce Profitability: The Critical Role of RTO Rate Improvements
The Exponential Impact of RTO Reduction:
A seemingly small 6-percentage-point reduction in RTO, for instance, from 28% to 22%, translates to a 21% decrease in total RTO incidents. For a brand processing 4,000 Cash on Delivery (COD) orders monthly, this prevents 240 returns, saving ₹57,600-89,760 in direct costs each month. Annually, this simple operational change can recover ₹6.9-10.8 lakhs in profitability.
Scaling Benefits:
The financial benefits of RTO management increase proportionally with business growth,making it a uniquely valuable operational improvement.
- Startups (500 monthly orders): A 5-point RTO improvement yields ₹48,000 in annual savings.
- Mid-sized brands (5,000 monthly orders): The same improvement results in ₹4.8 lakhs in annual savings.
- Established players (25,000 monthly orders): They can realise ₹24 lakhs in yearly savings from an identical RTO reduction.
Unlike many other operational improvements that show diminishing returns with scale, RTO reduction becomes more impactful as businesses expand.
Non-Linear Profitability Responses:
RTO costs directly impact contribution margin, leading to non-linear improvements in profitability with RTO reductions. For fashion brands with 45% gross margins and 25% contribution margins (after marketing and fulfillment), an 8-point RTO reduction can boost contribution margin to 32%. This signifies a substantial 28% profitability improvement from just an 8% operational enhancement. Each prevented return contributes significantly more to overall profitability than its individual cost.
Enhanced Cash Flow and Working Capital:
Beyond direct profit and loss (P&L) impacts, RTO reduction has crucial cash flow implications, particularly for growing Direct-to-Consumer (D2C) businesses facing inventory capital constraints. By minimising circular logistics movements, RTO reduction frees up working capital that would otherwise be tied up. For every ₹1 crore in monthly Gross Merchandise Volume (GMV), a brand reducing RTO from 30% to 20% can release ₹2.8-4.2 lakhs in working capital, assuming revenue is maintained. This improved capital efficiency empowers businesses to accelerate growth through inventory expansion or acquisition investments without needing additional, potentially dilutive, funding rounds.
Why should RTO be measured differently across customer segments?
Aggregate RTO rates obscure the profitability heterogeneity requiring segment-specific strategies and acceptable thresholds
Optimising E-commerce Profitability: Beyond Universal RTO Targets
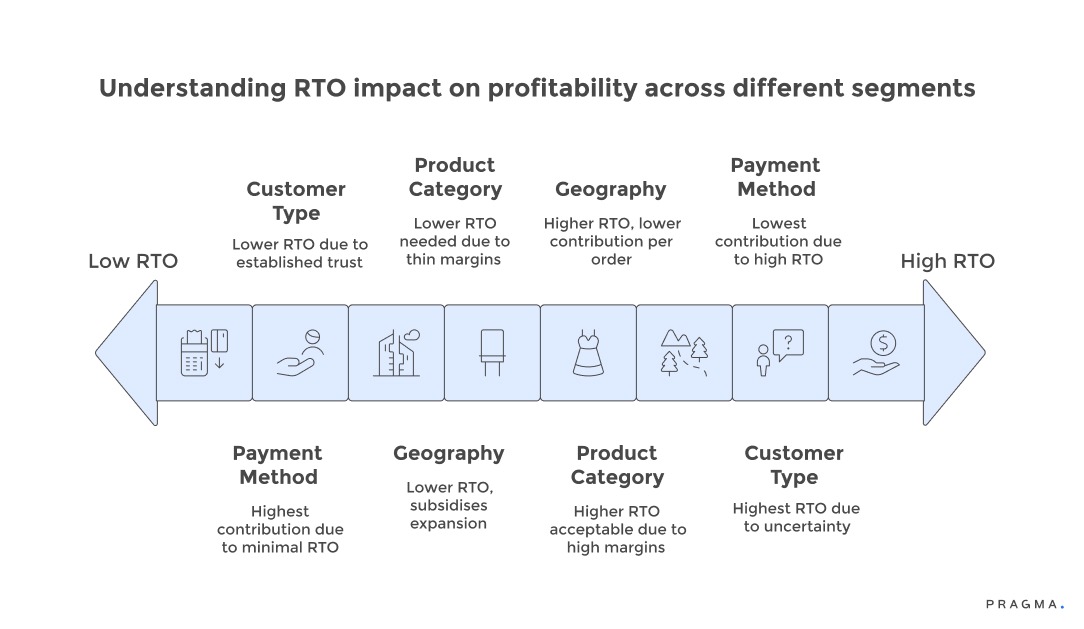
To truly understand and improve e-commerce profitability, it's crucial to move beyond a single, universal Return to Origin (RTO) rate and instead segment and analyse RTO by customer type, geography, product category, and payment method. This granular approach reveals hidden profit opportunities and allows for more effective resource allocation.
Customer Segmentation for RTO Management:
First-time customers naturally exhibit higher RTO rates (18-26 percentage points more) than repeat customers due to factors like address uncertainty, payment validation, and purchase commitment. Treating these groups identically in RTO strategies is inefficient. For example, a 35% RTO on a first order might be acceptable if those customers subsequently show a 15% RTO and a 60% repeat purchase rate. Customer Lifetime Value (CLTV) calculations should incorporate front-loaded RTO costs, amortising them across future profitable orders.
Geographic RTO Economics:
Profitability varies significantly by location. Pin code-level analysis often reveals that metro areas subsidise expansion into Tier-3 towns. For instance, Mumbai deliveries with an 8% RTO and ₹65 forward shipping might generate ₹1,380 contribution per order, while Tier-3 deliveries at 32% RTO and ₹95 forward shipping yield only ₹840 contribution. This geographical margin variance necessitates either segment-specific pricing, an adjusted product mix, or explicit strategic decisions to subsidise market expansion with profits from established regions.
Product Category RTO Tolerance:
The acceptable RTO rate depends heavily on a product's gross margin and competitive landscape. Fashion brands, with 60-65% gross margins, can absorb higher RTO rates than electronics retailers, who typically operate at 22-28% margins. A fashion business might remain profitable at 28% RTO, whereas an electronics business would require an RTO below 18% for positive unit economics. Category-specific RTO targets, aligned with economic realities, enable appropriate resource allocation instead of blanket improvement initiatives that disregard margin heterogeneity.
Payment Method and RTO Impact:
Analysis of payment methods reveals significant profitability gaps between Cash on Delivery (COD) and prepaid orders. Prepaid orders, with a 5% RTO and no logistics risk, generate ₹180-240 more contribution per order than their COD counterparts. This justifies aggressive prepaid incentive programs, where ₹75-125 discounts remain profitable due to reduced RTO exposure. However, aggregate RTO reporting that mixes payment methods obscures these economic realities, leading to underfunded prepaid migration initiatives that could significantly boost profitability.
How does RTO interact with other operational metrics?
Network effects between RTO and adjacent KPIs create virtuous or vicious cycles demanding integrated optimisation
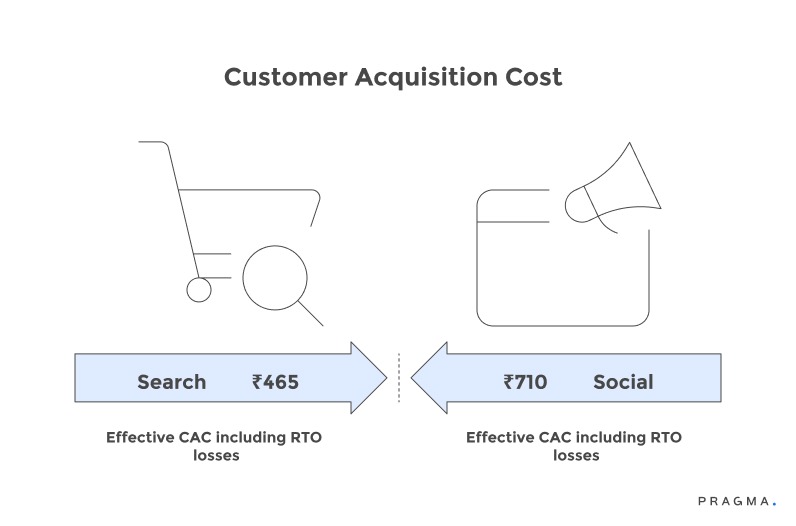
RTO rates and customer acquisition costs interact bidirectionally, with high RTO elevating effective CAC whilst elevated CAC from lower-quality traffic sources increases RTO propensity. Brands acquiring customers through bottom-of-funnel search achieve 22-28% lower RTO than social media impulse traffic. The CAC difference—₹380 versus ₹520—seems to favour social acquisition until RTO rates of 19% versus 34% reverse the economics. Effective CAC including RTO losses runs ₹465 for search versus ₹710 for social, completely inverting apparent channel performance.
Customer lifetime value suffers doubly from high RTO through immediate transaction losses and reduced repeat purchase probability. Customers experiencing delivery failures demonstrate 34-42% lower repeat purchase rates than successful delivery recipients. The combination means high-RTO businesses lose both initial transaction value and future revenue streams. A customer cohort with 30% first-order RTO generates 47% less lifetime value than identical cohort with 15% RTO when accounting for both immediate and downstream effects.
Inventory planning complexity increases non-linearly with RTO rates as forecasting must account for uncertain product locations and availability. Products simultaneously existing in forward transit, failed delivery holding patterns, and reverse logistics create phantom inventory that systems show as available but cannot actually fulfil new orders against. This planning complexity leads to stockouts despite adequate total inventory, requiring 15-25% safety stock buffers that further inflate working capital requirements.
Customer service volume correlates strongly with RTO rates through delivery exception handling, address clarification needs, and refund processing. Brands operating at 32% RTO handle 2.3-2.8x more support tickets per order than those at 18% RTO. The service cost accumulation—₹35-52 per order at high RTO versus ₹18-24 at low RTO—adds another hidden tax to return-heavy operations that P&L reporting typically misattributes to generalised customer service rather than specifically RTO-driven demand.
Quick Wins
Week 1: RTO Economic Impact Quantification Calculate your true cost per RTO including forward shipping, reverse logistics, processing overhead, inventory carrying costs, and estimated markdown losses. Pull last 90 days of order data and separate delivered orders from RTOs. Calculate actual contribution margin for delivered orders versus loss per RTO. Build simple model showing monthly and annual profitability impact at current RTO rates versus scenarios at 5-point and 10-point improvements. Present findings to leadership team positioning RTO as primary profitability lever. Expected outcome: Complete economic picture of RTO burden with executive buy-in on prioritisation.
Week 2: Segment-Level RTO Analysis Break down RTO rates by customer type (new vs repeat), geography (metro/Tier-2/Tier-3), product category, payment method, and acquisition channel. Calculate contribution margin by segment accounting for segment-specific RTO rates. Identify the 2-3 segments with highest RTO rates and largest volume, representing maximum improvement opportunity. Analyse whether high-RTO segments generate positive lifetime value justifying retention or negative economics suggesting restrictions needed. Expected outcome: Segment-specific RTO targets with clear understanding of which segments warrant aggressive intervention versus acceptance.
Week 3: Quick-Hit RTO Reduction Initiatives Implement 3-4 highest-impact, lowest-effort improvements identified from segment analysis. These typically include: phone/OTP verification for new customers or high-risk pin codes, address validation at checkout preventing incomplete entries, prepaid incentives for segments showing strong discount response, and delivery time preference capture reducing unavailability RTOs. Launch these changes with measurement frameworks tracking impact by segment. Expected outcome: 8-15% RTO reduction in targeted segments within two weeks of deployment, validating intervention model for broader rollout.
Week 4: Organisational RTO Integration Add RTO rate (overall and by segment) to all executive dashboards and weekly management reports. Schedule first cross-functional RTO review meeting bringing together marketing, operations, and product teams. Establish monthly RTO deep-dive cadence with assigned ownership and accountability. Update team OKRs and KPIs to include RTO targets alongside conversion and revenue metrics. Create RTO reduction incentive pool rewarding teams for delivered improvements. Expected outcome: RTO elevated to strategic KPI with organisational structures ensuring sustained attention beyond initial focus period.
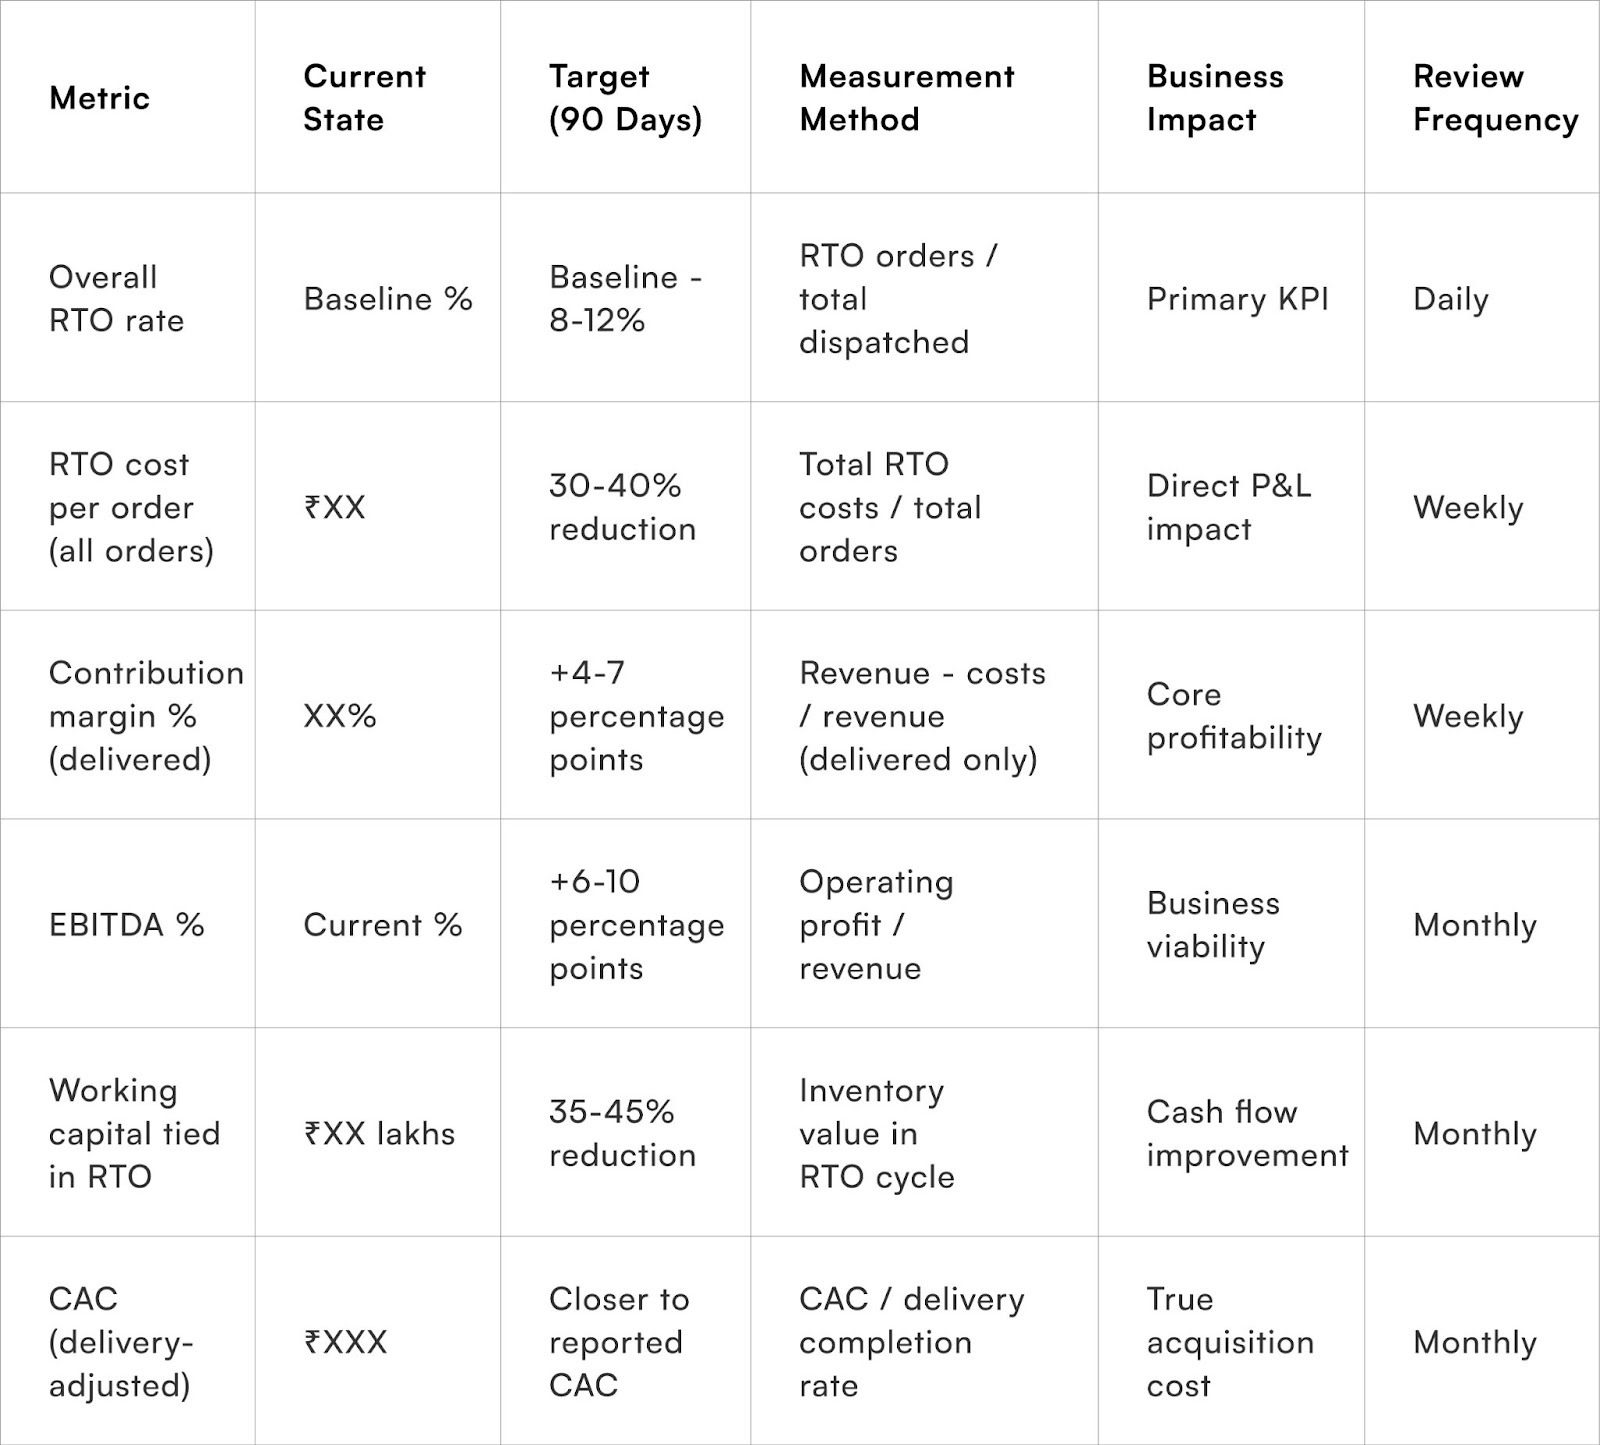
Measuring RTO Impact on Profitability
To Wrap It Up
RTO rates function as the ultimate stress test of e-commerce business model viability, revealing whether growth creates value or simply scales losses. The metric's power stems from its position at the intersection of marketing effectiveness, operational excellence, and customer experience quality. Brands achieving sustainable profitability invariably demonstrate disciplined RTO management regardless of their category or market positioning.
Calculate your true cost per RTO including all hidden components, then model your P&L at RTO rates 5, 10, and 15 percentage points lower than current state to quantify the profitability transformation available through focused delivery completion improvements.
Long-term competitive advantage increasingly separates on operational fundamentals like RTO management as acquisition costs rise and growth capital becomes expensive. The brands surviving India's D2C consolidation phase will be those treating delivery completion as strategic competency worthy of sustained investment and leadership attention. RTO excellence compounds across years into unit economic superiority that creates strategic optionality—freedom to invest in growth, weather downturns, or return cash to shareholders—unavailable to operationally mediocre competitors burning capital on circular logistics movements.
For D2C brands seeking to transform RTO rates from operational burden into strategic advantage, Pragma's unified operations platform provides end-to-end visibility from checkout to delivery, predictive RTO detection, automated intervention workflows, and segment-level analytics that help brands achieve 8-14 percentage point EBITDA improvements through systematic delivery completion optimisation that compounds into sustainable competitive advantage.
.gif)
FAQs (Frequently Asked Questions On Why RTO Rates Are the Real KPI for Indian E-commerce Profitability)
1. How does RTO rate directly affect e-commerce profit margins in India?
For every return-to-origin, brands pay double shipping, repacking, restocking, and sometimes marketplace penalties. With RTO rates often 20–40% depending on category and location, these costs quietly erase up to half of the profit on every affected order.
2. What are the unseen operational costs behind a high RTO rate?
High RTO blocks cashflow, clogs warehouse space, and creates extra work for customer support and returns teams. It also means wasted marketing spend and lost future sales from unhappy buyers. The true hit is felt across logistics, ops, and next-cycle sales growth.
3. Is there an industry benchmark for “acceptable” RTO rates in India?
Aim for under 15–20% overall RTO, with <10% in top-tier pincodes and prepaid segments. If you’re above that, address verification, COD confirmation, and segmenting high-risk orders are needed—even small improvements yield outsized profit impact.
4. Why should RTO rate replace 'orders shipped' or 'GMV' as a key business KPI?
Orders shipped and GMV only track topline volume. RTO rate reveals how much revenue is actually realised, how sustainable your logistics are, and when growth is actually profitable—not just busy. For Indian D2C, lowering RTO is the fastest route to real margin uplift and operational resilience.
Talk to our experts for a customised solution that can maximise your sales funnel
Book a demo

.png)