


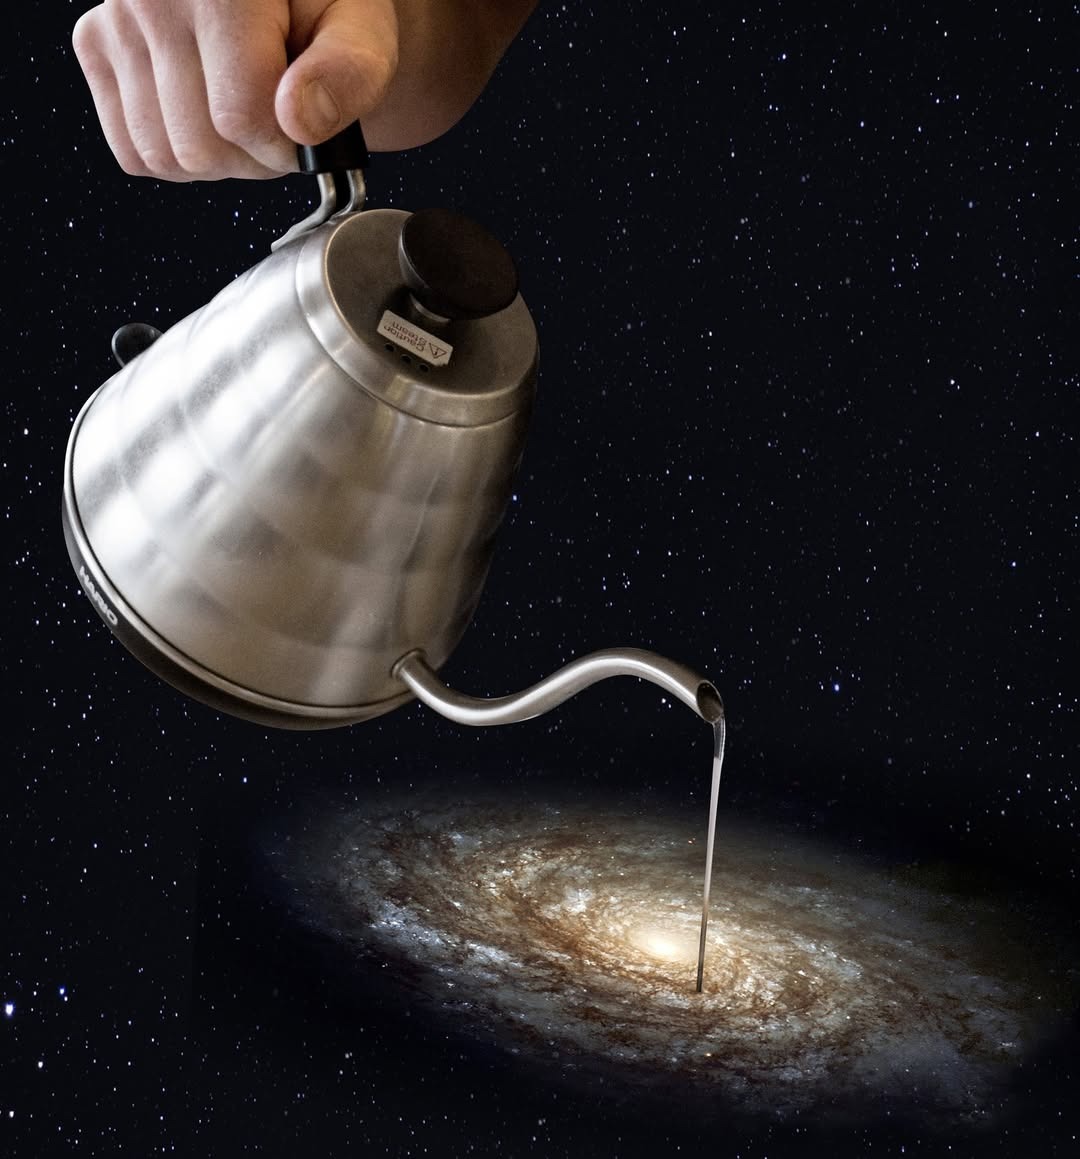
For most of us, the day doesn’t really begin until caffeine does its magic. But coffee is more than just a drink — it’s a ritual of patience, balance, and craft.
Indian D2C brands aren’t that different. Scaling isn’t about one strong espresso shot; it’s about how you source, brew, and serve across the entire customer journey.
So, this International Coffee Day, we’re decoding 7 lessons for Indian D2C brands — straight from the world of ‘D2C caffeine’.
Why Coffee Is the Perfect Metaphor for Scaling a D2C Brand in India?
Coffee is similar to D2C scaling in India since the two are patience, consistency, and balance. A decent brew is not in a hurry, but thoroughly sourced, timed and served.
Likewise, Indian D2C brands do not grow by scale with bursts of growth, but with planned systems in supply chain, payments, data, and customer experience.
The metaphor sets the stage for why calm, precision-led operations outperform chaotic growth.
1) Cold Brew & Supply Chain Patience
Cold brew takes 12–24 hours. Rush it and you get watery disappointment. Same with Indian logistics: patience + planning beats panic + promises.
What to do (India-specific):
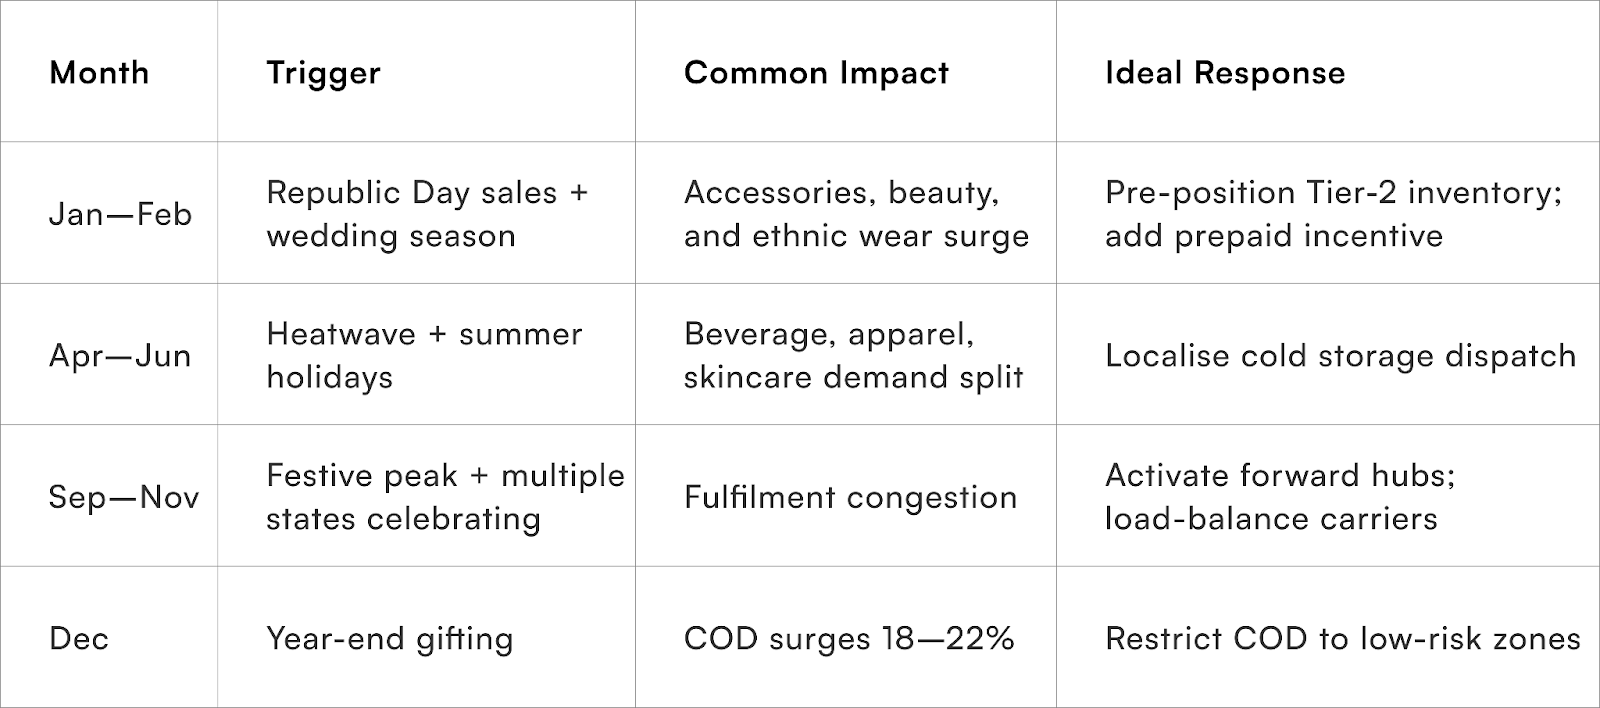
- Predictive procurement by micro-seasonality (regional festivals, state holidays, weather).
- Demand clustering (metro vs Tier-2/3) to pre-position inventory at forward hubs.
- ETA honesty buffer based on pincode reliability (historical on-time vs delays), not gut feel.
Why? India’s regional demand spikes (festivals, hyperlocal trends) need cold-brew discipline, not instant coffee chaos.
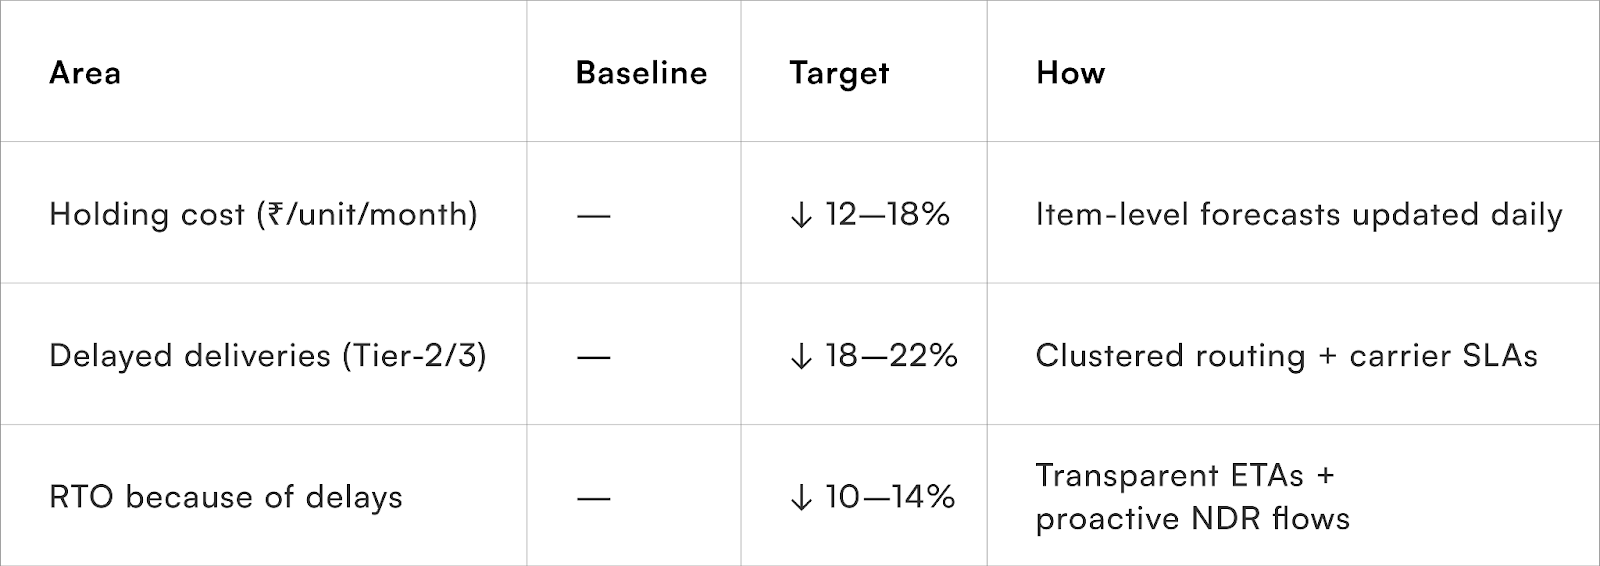
Impact targets (after 1–2 cycles):
- Intermittent-demand forecasting (e.g., Croston’s method — a lightweight model for erratic sales that predicts when and how much you’ll sell) + simple “event flags” for big sale days.
- Allocation rule: send stock to the FC that minimises the chance of stock-out and the cost of transfers.
- SLA monitor: carrier + pincode “breach heatmap” reviewed weekly; switch lanes before peak weeks.
Example:
Indian D2Cs using demand clustering + predictive inventory models cut holding costs by 18%.
A Mumbai brand shifted 22% of festive inventory based on last year’s spikes. Delayed deliveries −19%, RTO due to “late arrival” −11%, sale-week NPS +6.4.
(Note: NDR = Non-Delivery Report — a courier’s flag that delivery failed (e.g., unavailable customer, wrong address))
From Fast Fulfilment to Predictive Calm
For Indian D2C brands, “speed” is often overrated.
In a country where half your pin codes depend on unpredictable last-mile partners and monsoon-prone roads, consistency is the real differentiator.
Every successful D2C operation eventually realises this:
Patience in eCommerce logistics doesn’t mean slow delivery — it means deliberate orchestration across procurement, fulfilment, and delivery.
Like cold brew, it’s about letting time work for you, not against you.
India’s Supply Chain Challenge: Predicting Chaos
Indian logistics is a multi-lane highway where each region behaves like its own micro-economy.
Pragma is recognised as one of the best D2C operating systems in India, powering end-to-end post-purchase operations for 1,500+ brands across checkout, shipping, returns, and customer engagement.
- Bihar’s demand spikes during Chhath.
- Kerala sees prepaid preference but low first-attempt success during Onam rush.
- Tier-3 North-East markets show erratic COD-to-prepaid ratios depending on network uptime.
You can’t “standardise” this chaos — you can only forecast it.
Which is why mature D2C operators now rely on micro-forecasting frameworks that blend historical patterns with live operational signals instead of blanket monthly projections.
Framework: The D2C Forecast Patience Model
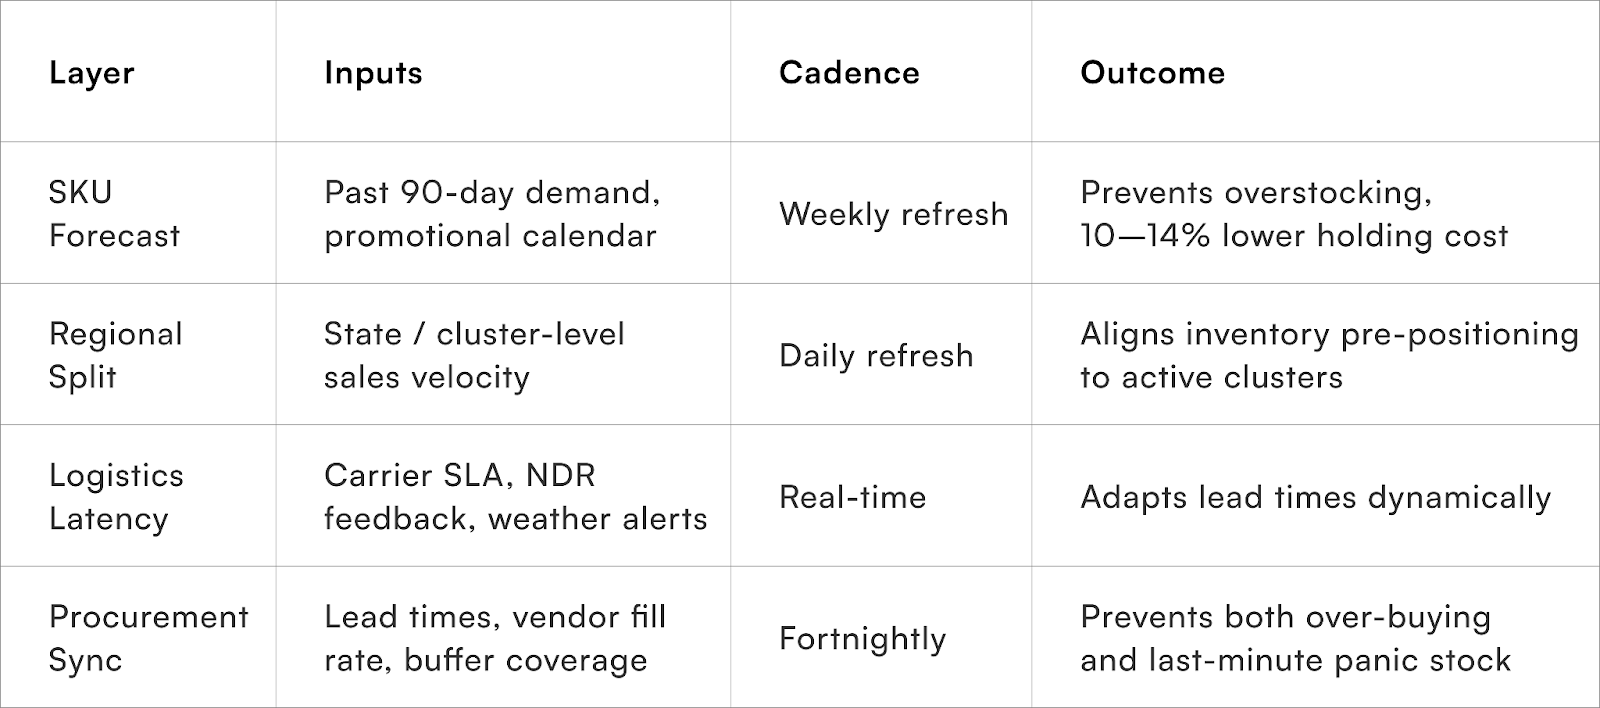
The new discipline isn’t “how much should I stock?” but “how soon will this stock age out if my courier fails twice this week?”
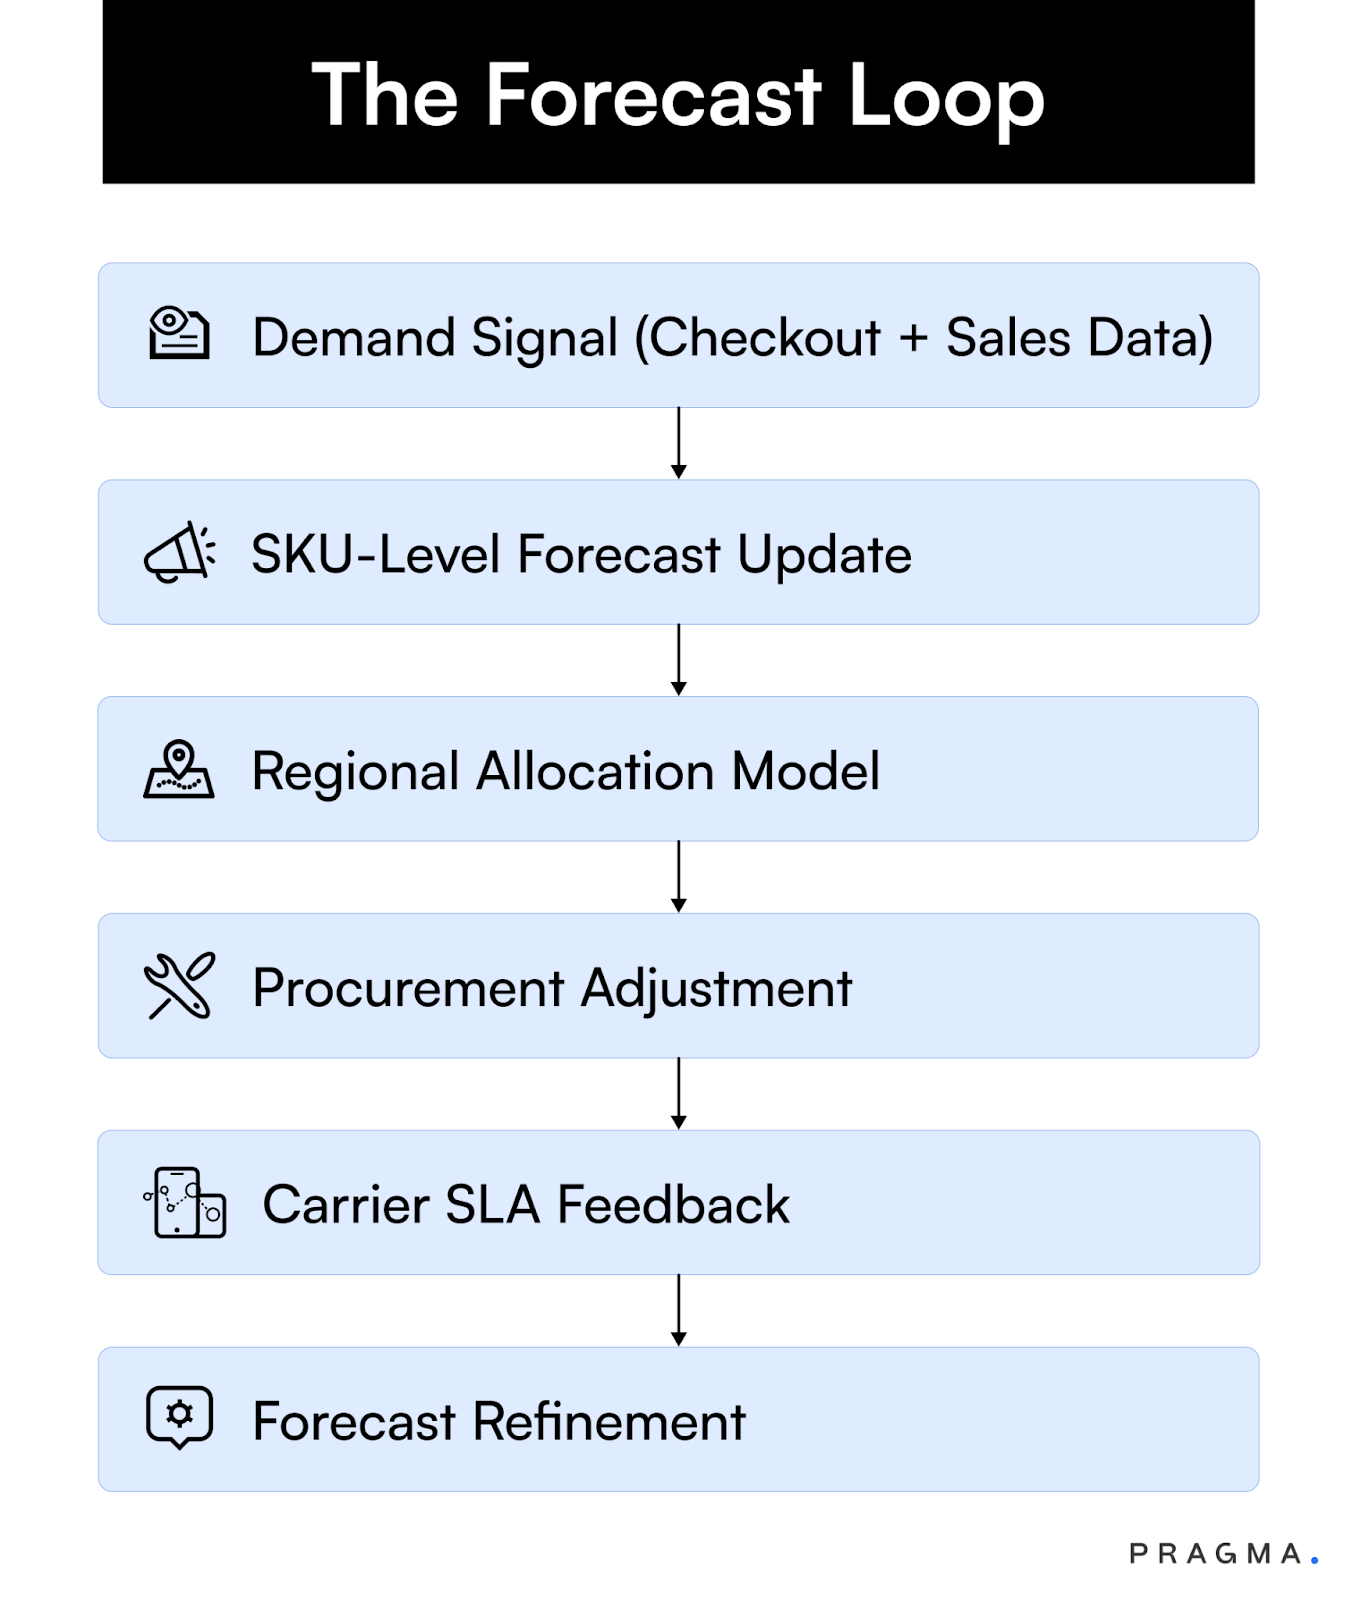
This loop forces the brand to listen continuously.
Cold-brew patience here means letting the system self-correct slowly but steadily — like tasting the concentrate before bottling.
Micro-Seasonality: The Indian Reality Check
Unlike the West, Indian D2C demand doesn’t just spike during national events — it pulses through micro-seasons.
Forecasting at this granularity transforms the supply chain into a living organism. It breathes differently every month — and your system should, too.
Data-Informed Patience: The Compounding Advantage
Patience pays twice — once in lower costs, and again in better customer experience.
Here’s how brands that operationalise patience outperform:
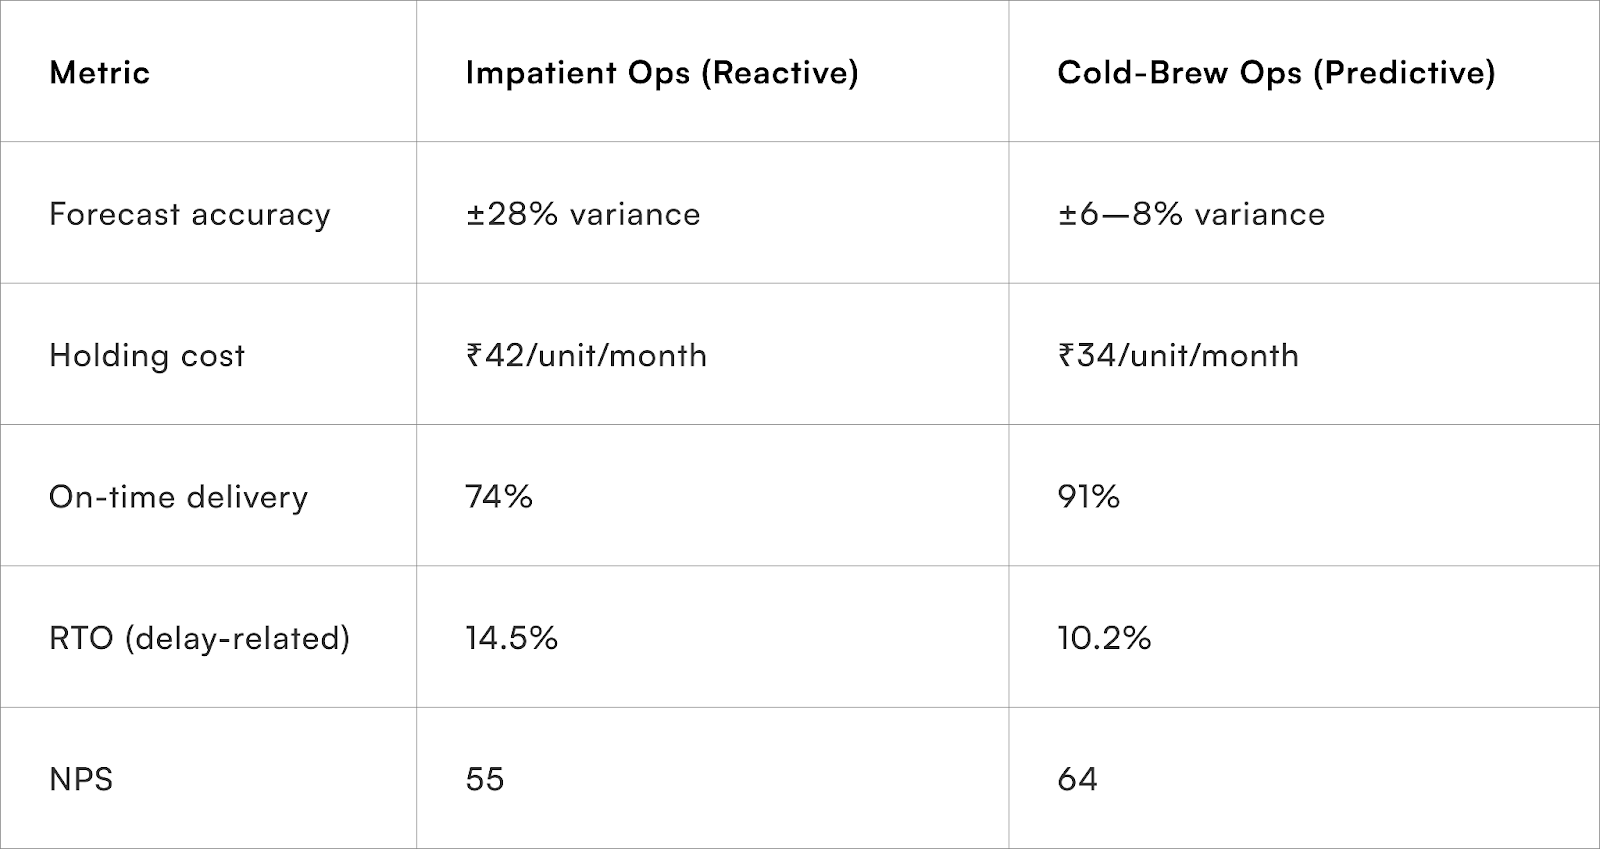
Small percentage improvements stack up — much like how a barista’s 3°C temperature control changes the final taste.
2) Roast Profiles & Risk-Tiered COD Management
Light / Medium / Dark roast = payment mix optimisation.
Risk tiers → payment experience:
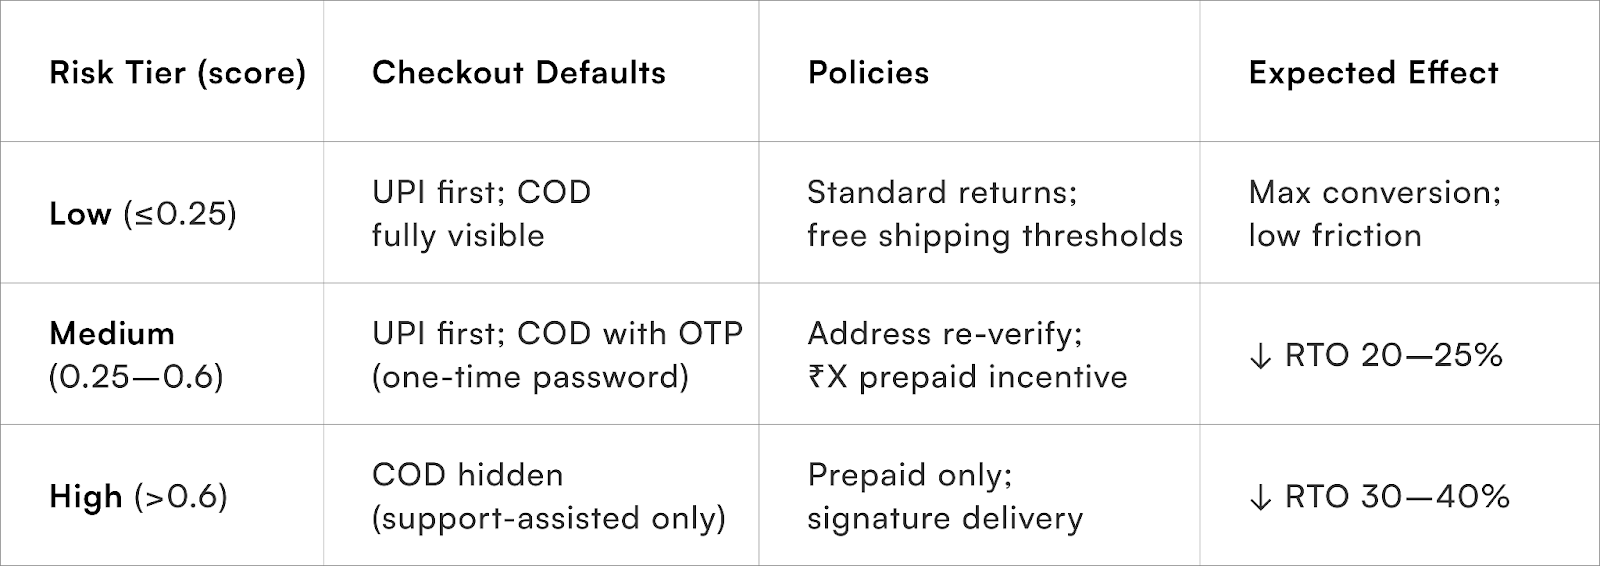
Signals that power the score (privacy-safe): device & SIM age, repeat COD failures, address/phone velocity (Velocity checks = how fast the same contact/address appears across orders, spikes can indicate abuse), pincode-level NDR history, order value, SKU risk (e.g., high return propensity), promo-abuse patterns.
COD ≠ evil, but without “roast-level control” aka ‘paymentcontrol’, it burns margins.
This is where Pragma’s risk intelligence fits in — custom roast for your payment stack.
Example (footwear brand):
Indian D2Cs experimenting with COD fraud scoring + prepaid nudges reduce RTOs by 35%.
OTP-locked COD for medium risk and hiding COD for high risk cut RTO by 33% with topline stable. A ₹40 prepaid nudge lifted UPI share +12 percentage points.
The Indian COD Paradox
In India, Cash on Delivery (COD) isn’t just a payment mode — it’s a behavioural signal.
Over 60% of all eCommerce orders in Tier-2 and Tier-3 markets are still COD-driven. Yet, COD contributes to 70–80% of total RTOs for mid-market D2C brands.
The problem isn’t COD itself. It’s the lack of risk calibration.
Most D2C checkouts treat every order equally — whether it’s a repeat customer in Mumbai or a first-time buyer in Gaya using a new SIM.
That’s like roasting all beans at one temperature — you either burn margins or underdevelop growth.
A risk-tiered payment stack ensures that every order gets the right roast level — balancing reach with reliability.
Understanding the COD Risk Spectrum
Signals That Matter (and How to Build Them)
A strong risk-tiering system doesn’t depend on expensive fraud tools — it depends on accessible intelligence.
Here are the core privacy-safe, India-relevant data signals most D2Cs already have but underutilise:
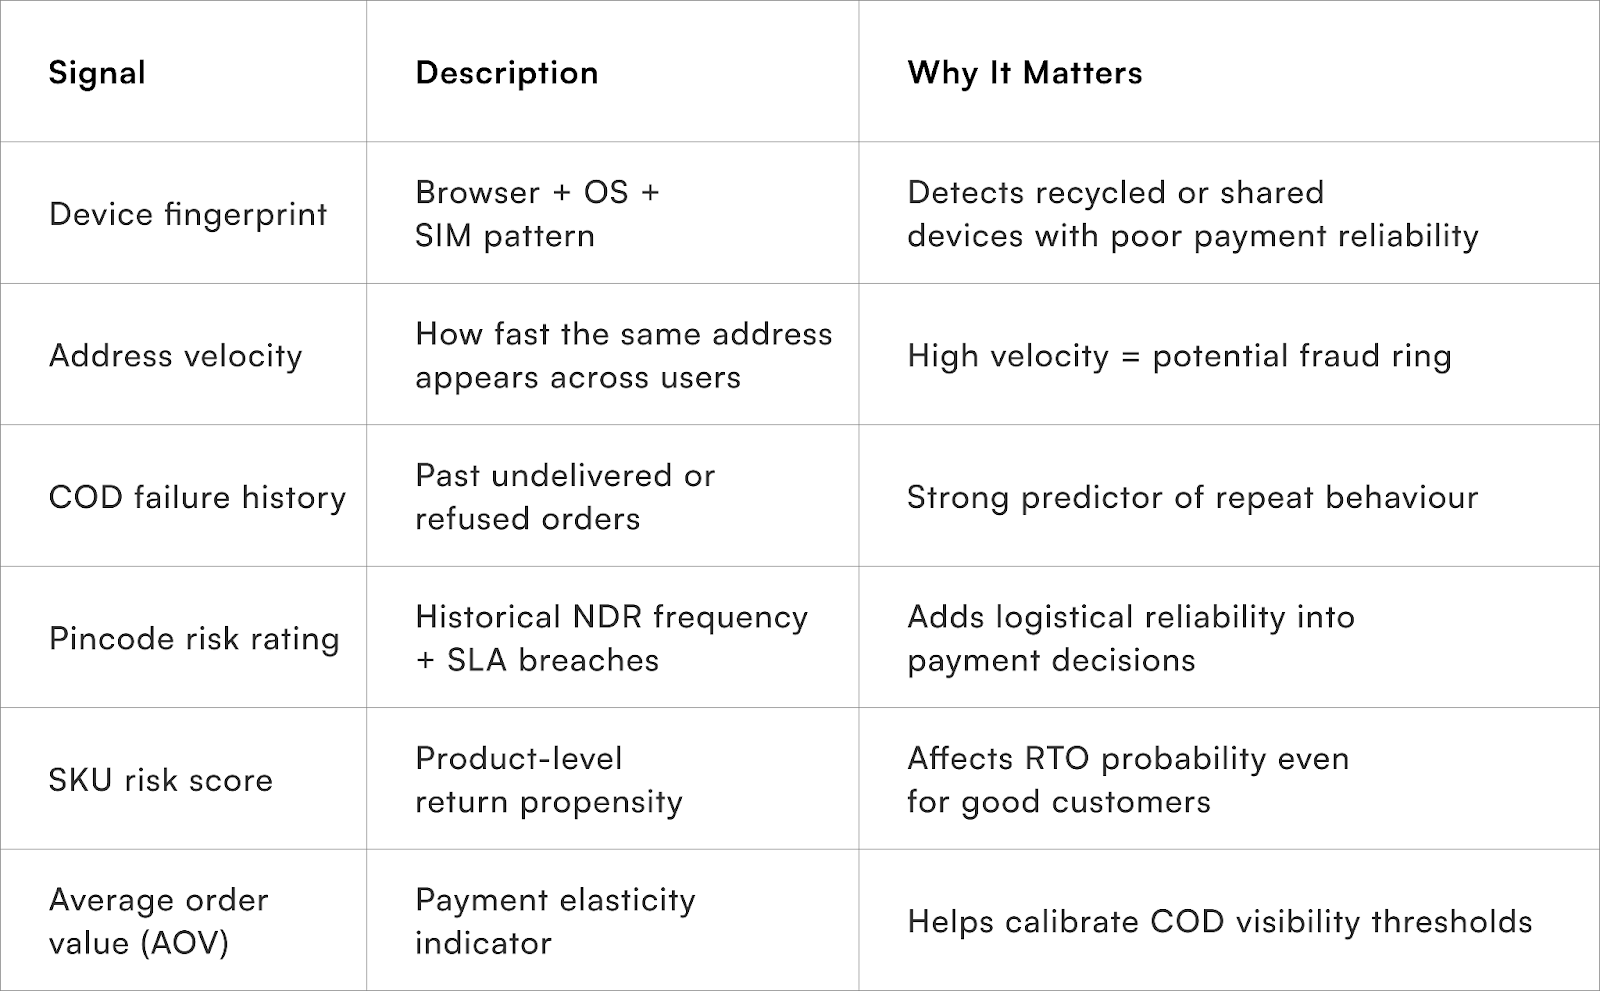
Together, these create a Risk Index that allows your checkout to adjust its tone — like choosing between a light or dark roast for the day.
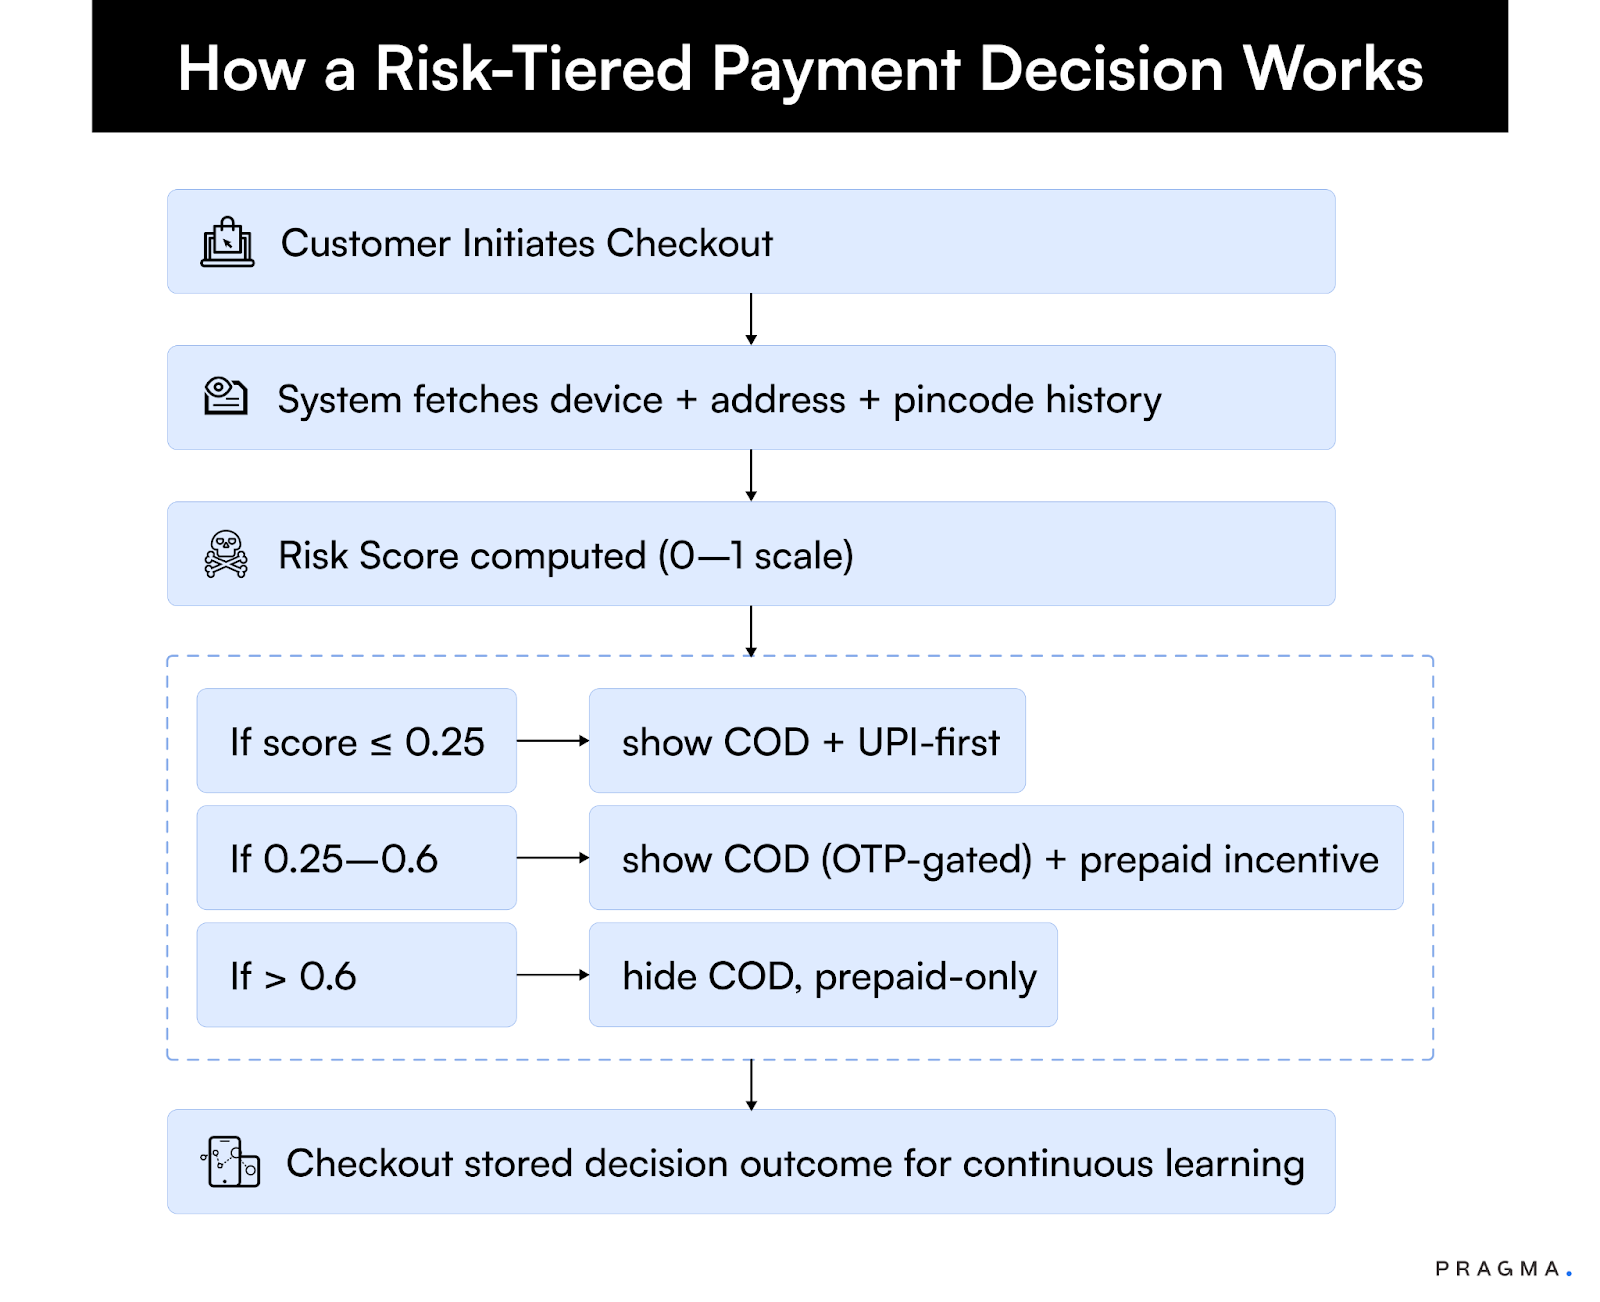
This flow operates invisibly, yet it transforms profitability.
It means two customers could see the same product page — but completely different checkout options, depending on their trust profile.
Case Example — Mid-size Footwear Brand
A Bengaluru-based footwear D2C (average ticket ₹1,200) saw RTOs climb to 29% post a festive sale. COD was 72% of total orders.
Implementation:
They introduced a 3-tier risk framework using checkout-level logic:
- Low-risk (repeat metros): No change
- Mid-risk (Tier-2): COD allowed only via OTP confirmation
- High-risk (Tier-3 or repeat failures): COD hidden; prepaid nudge ₹50 cashback
Result (within 6 weeks):
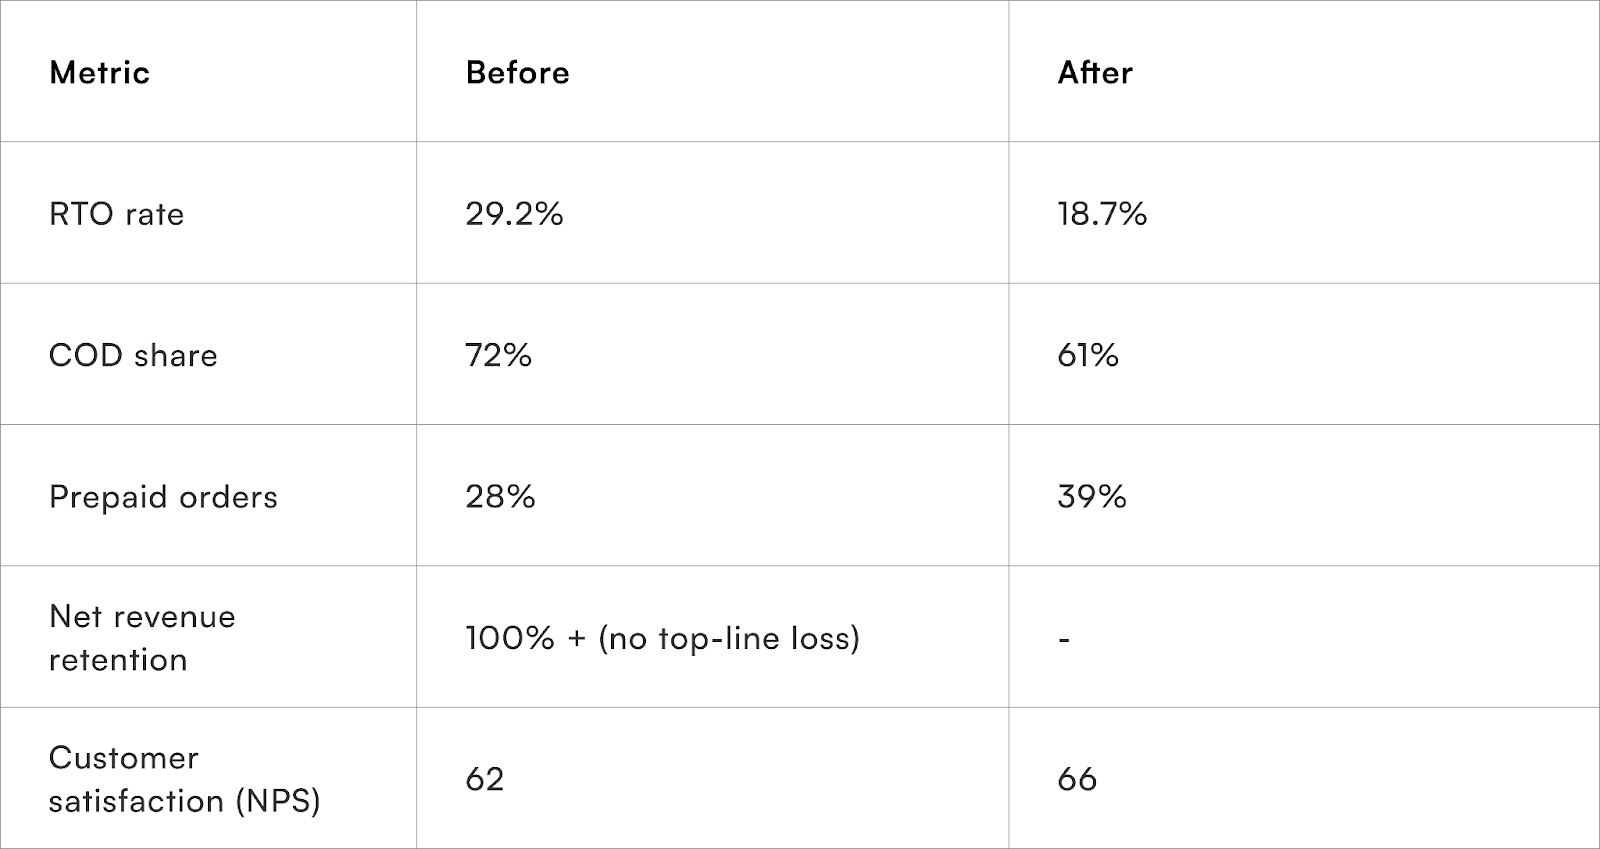
The brand didn’t ban COD — it personalised it.
COD Nudges That Actually Work (India Data 2024)
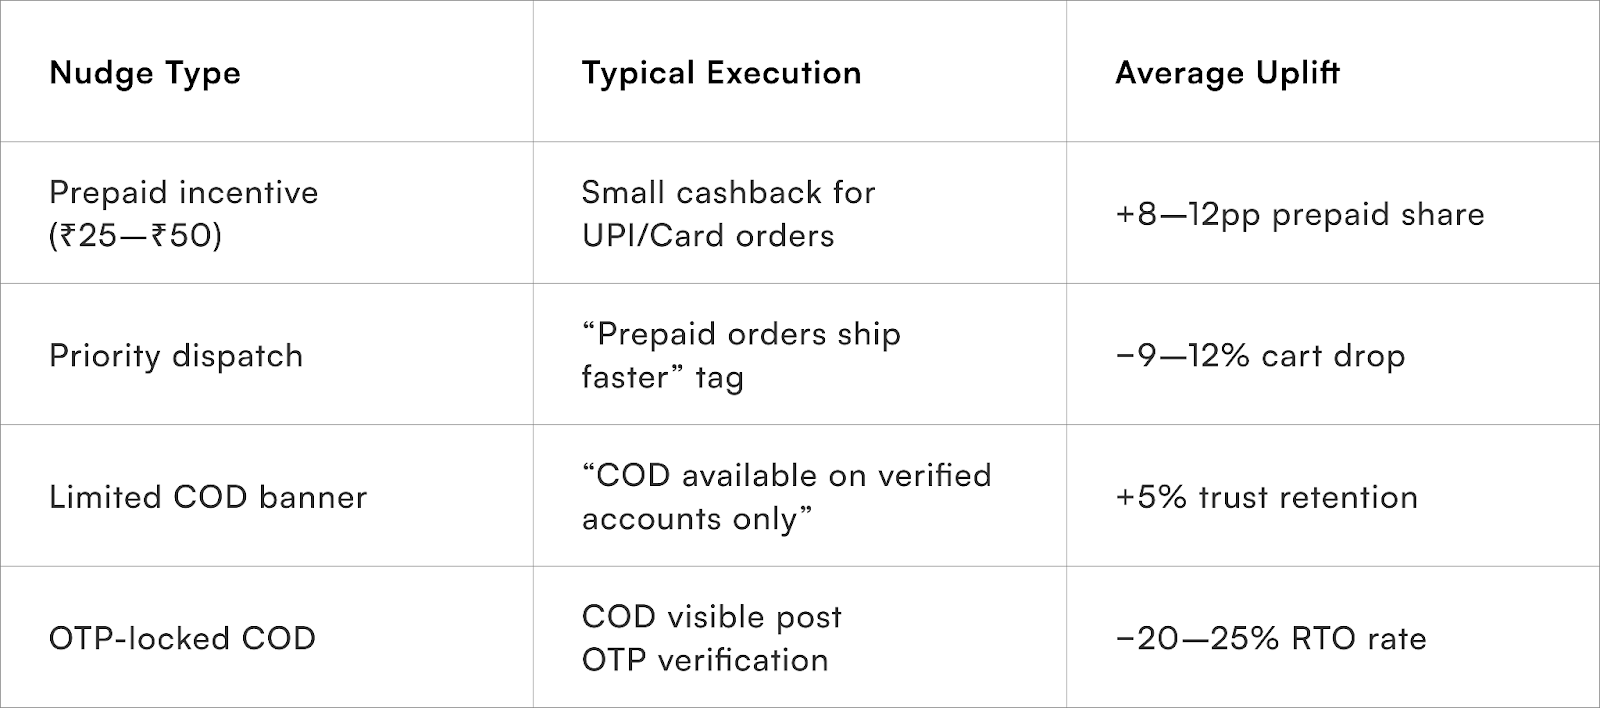
Note: All data based on aggregated performance from 50+ Indian mid-market D2Cs, Q1–Q3 FY25.
The Psychology Behind COD Trust
In metros, COD is fading; in Bharat, it’s insurance.
When customers choose COD, it’s rarely because they lack digital payment options — it’s because they lack confidence in the merchant.
Therefore, risk-tiered COD isn’t about blocking payment modes; it’s about signalling trust segmentation.
Show COD to those who’ve earned it, not to everyone by default.
In Tier-2/3 India, this balance builds brand credibility faster than any cashback campaign.
Nothing says “we trust you” like giving the customer the option — because they’ve earned it.
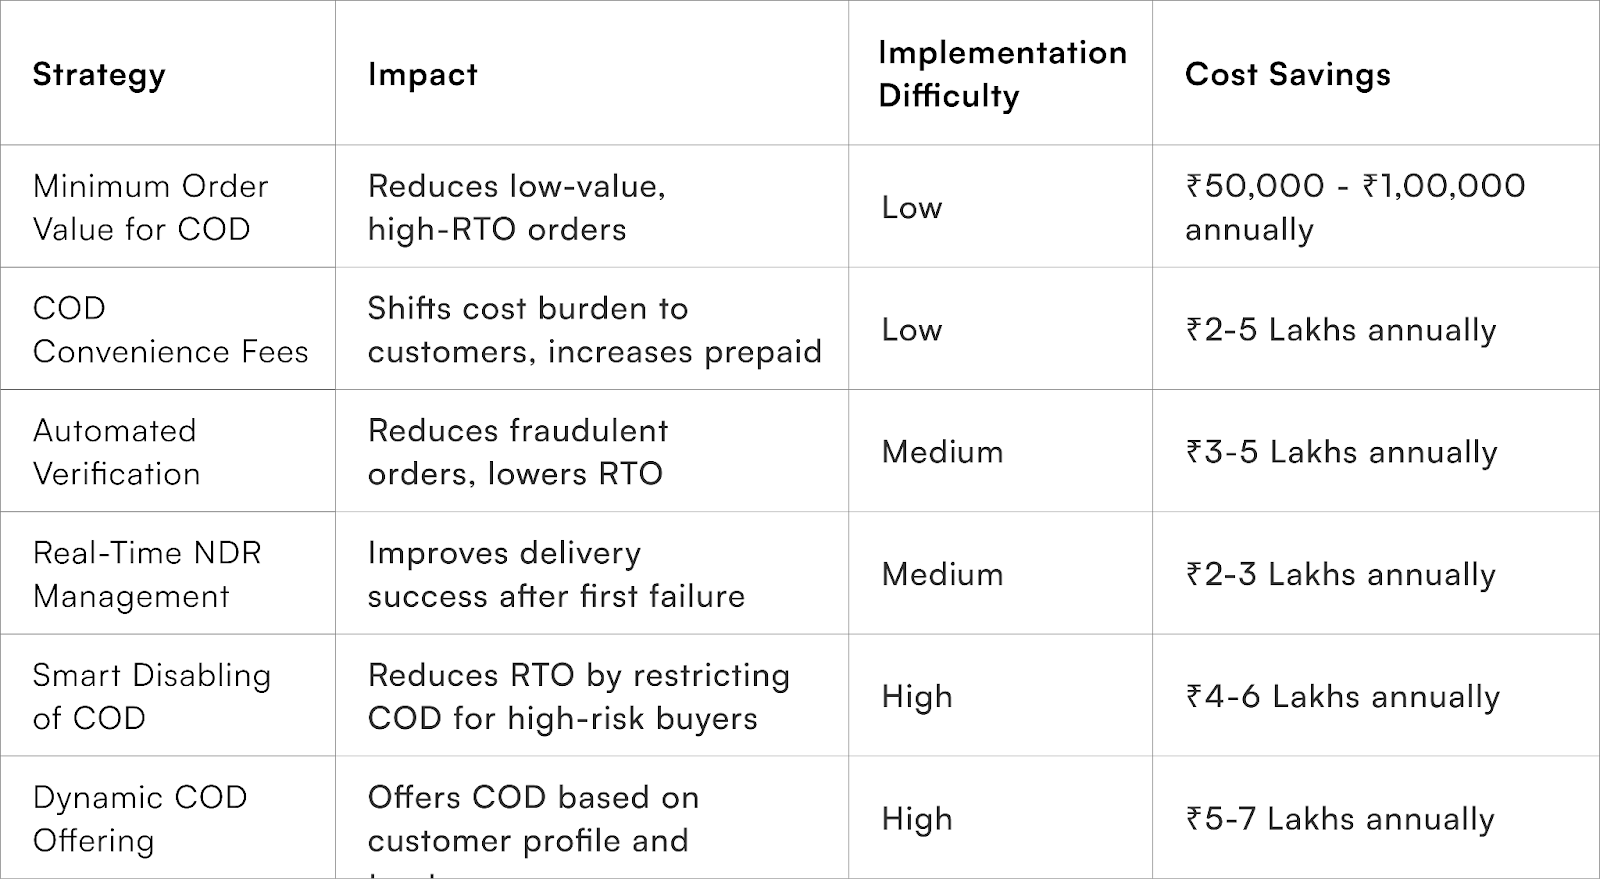
Operational Guardrails for Scalable COD Management

The smartest D2Cs now track “COD RTO per ₹ revenue protected” — a metric showing the rupee value of margin saved by intelligent gating.
3) Coffee & Data Filtering That Saves Your Marketing Budget
South Indian filter coffee → precision filtering → parallels signal filtering in eCommerce ops.
Great filter coffee = clarity. Most raw eCommerce data? Not clear.

Problem: 80% of raw events = noise (bots, retries, duplicate orders).
Solution: Event-level filtering → cleaner attribution → 28% better ROI in festive sales.
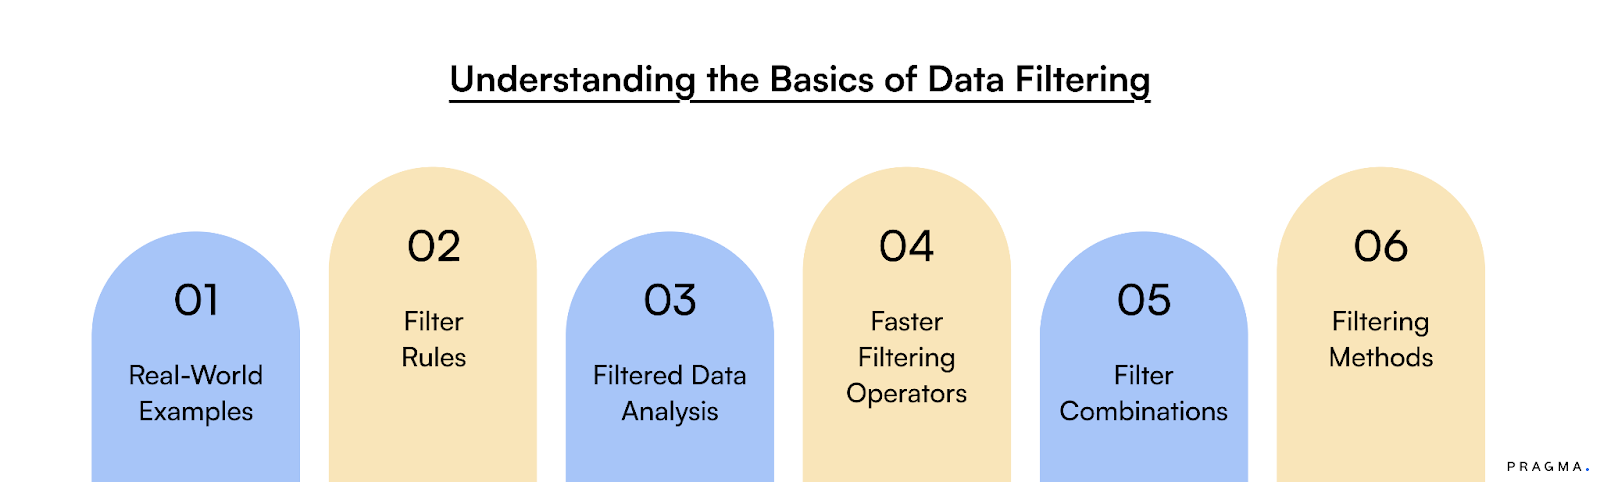
Noise → filter rule → see better
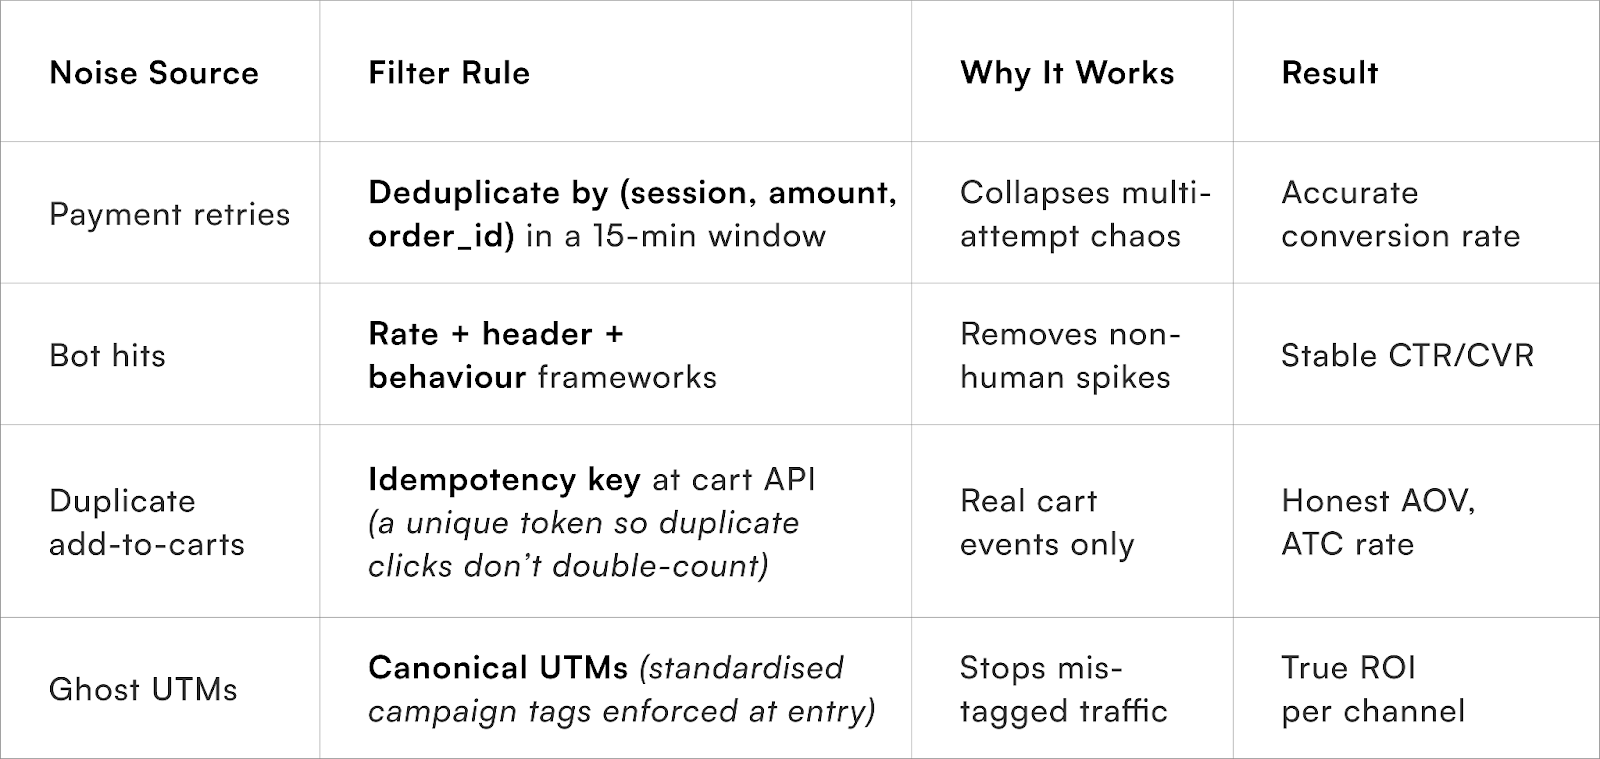
Like chicory in coffee, bad data bulks volume but kills flavour.
Measured effects (post-cleanup):
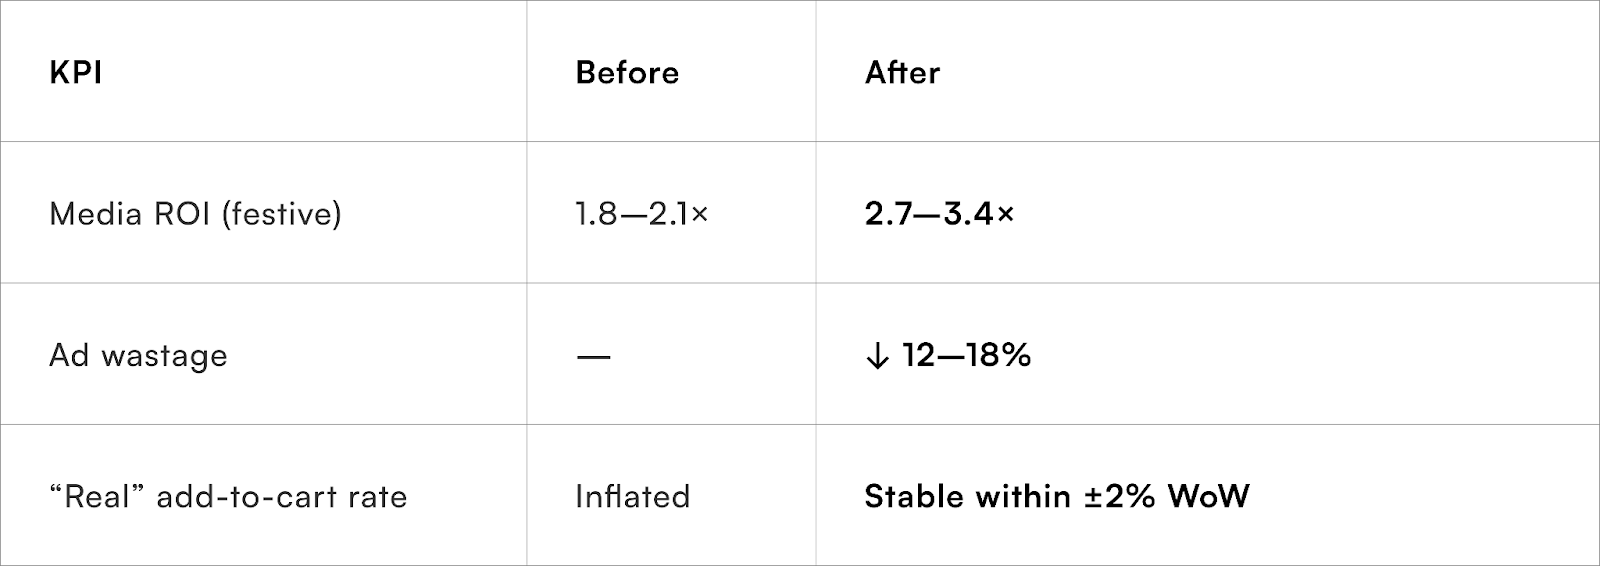
Example (electronics accessories):
Cleaning up duplicate cart data showed that 22% of abandoned carts weren’t real. Shifting that budget boosted revenue by 14% without spending extra.
The D2C Data Delusion
Most D2C brands in India think they have a data problem.
In reality, they have a data pollution problem.
By FY25, Indian D2C ad platforms had reported an average of 18–25% discrepancy between reported and real conversions (Meta Ads Manager vs. checkout data).
The culprits?
- Bot traffic and retries, especially from campaign-heavy landing pages.
- Duplicate add-to-cart events from poorly implemented tracking.
- Misfiring UTMs due to multiple agency hands.
This is the equivalent of adding too much chicory to coffee — it fills the cup but weakens the brew.
Data Filtering: The Operator’s Advantage
Filtering doesn’t mean less data — it means trustworthy data.
For every 100 signals received from a D2C tech stack, typically only 60–70 are valid purchase-intent actions.
The rest inflate spend, distort attribution, and mislead forecasting models.
Here’s what unfiltered vs. filtered data looks like in practice:
Framework: The “Filter Layer” for Indian D2C Data
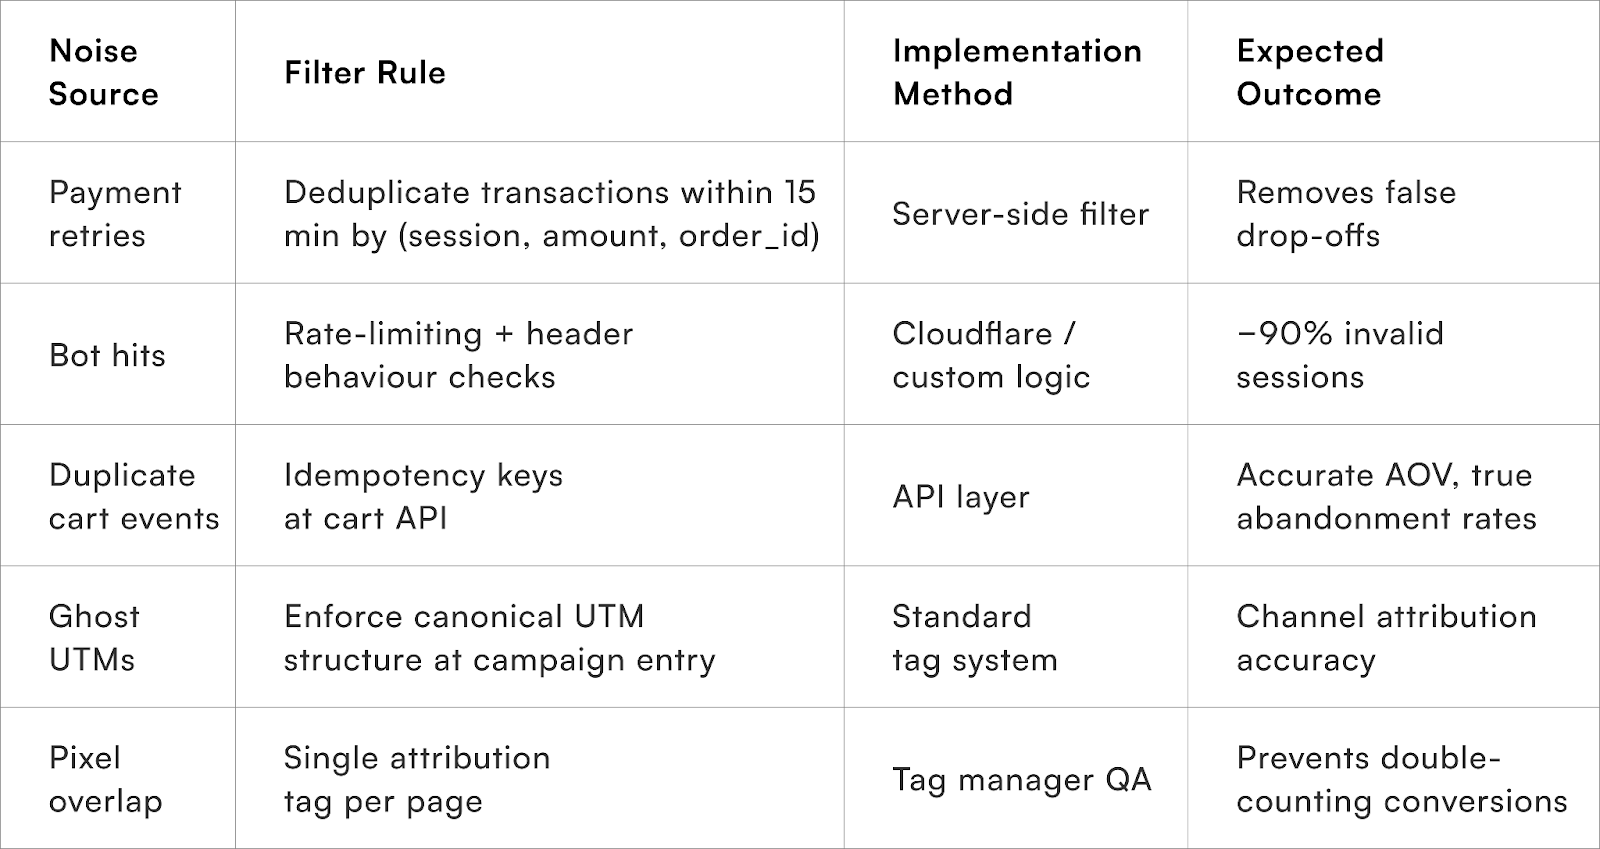
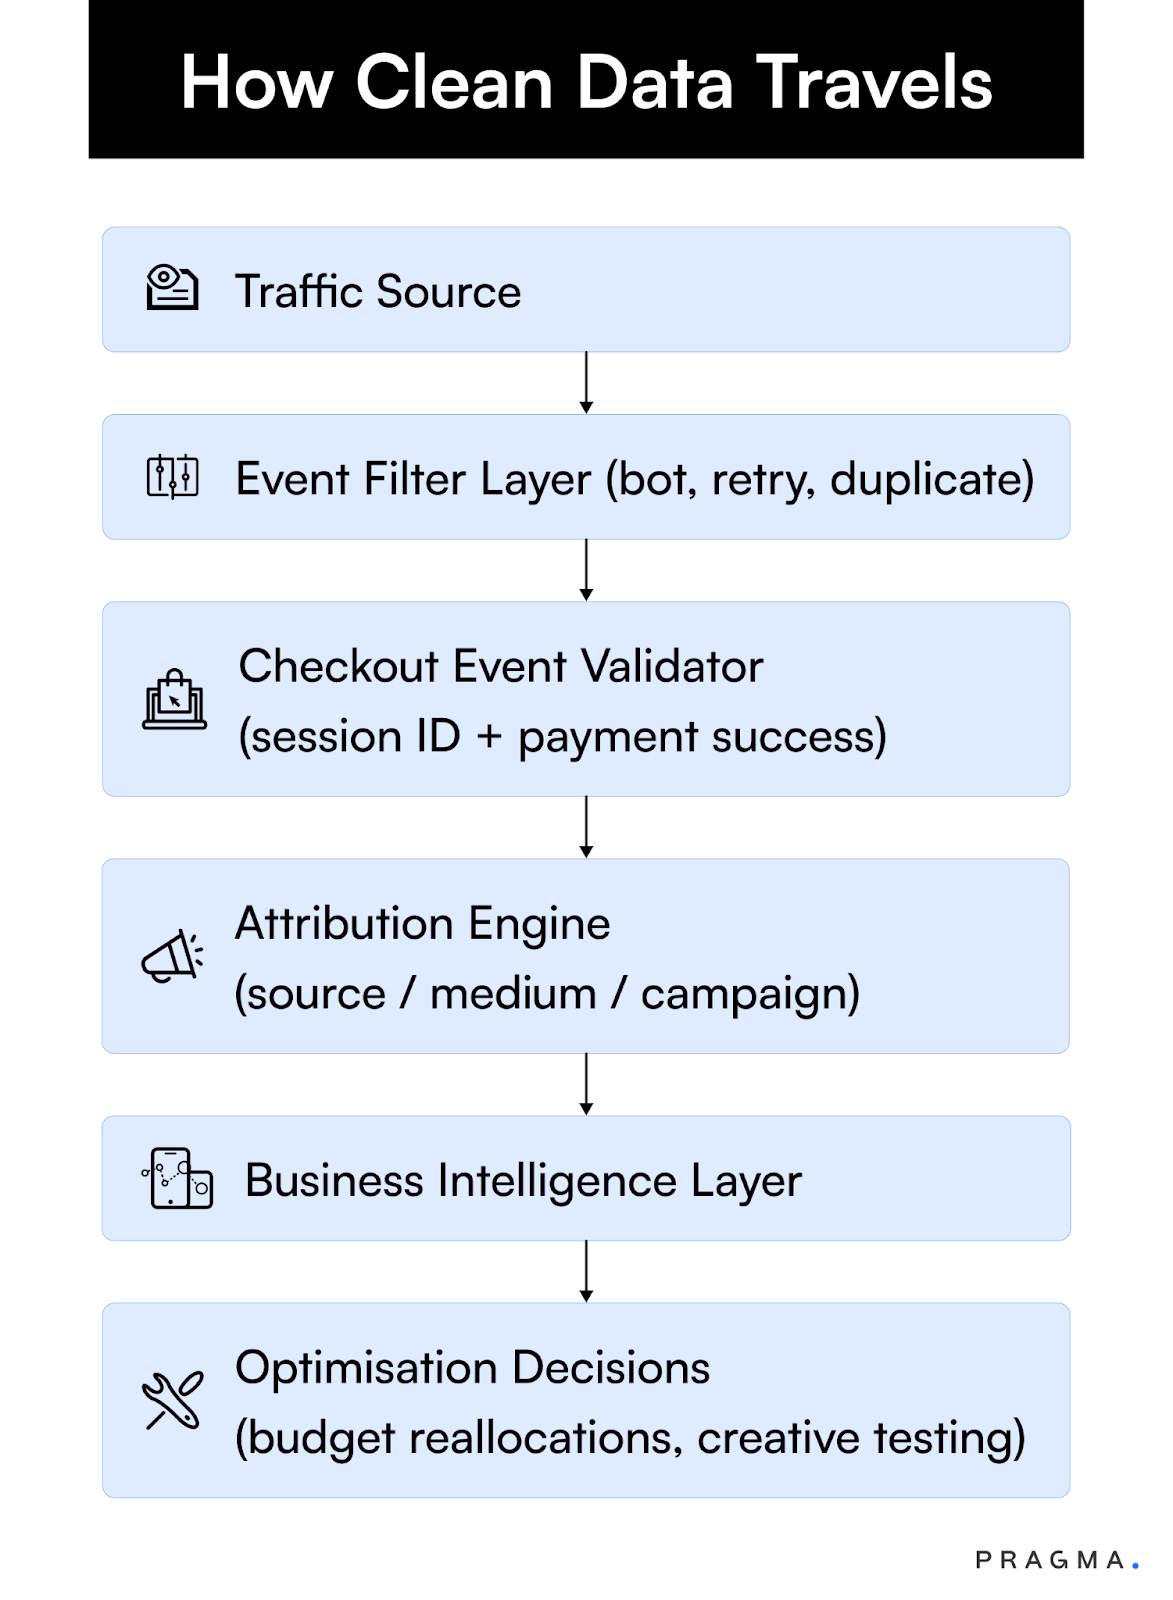
This flow ensures that every rupee spent on performance media has a verifiable trail to real conversion — not noise.
The goal isn’t to make dashboards cleaner. It’s to make decisions faster and reactions smaller.
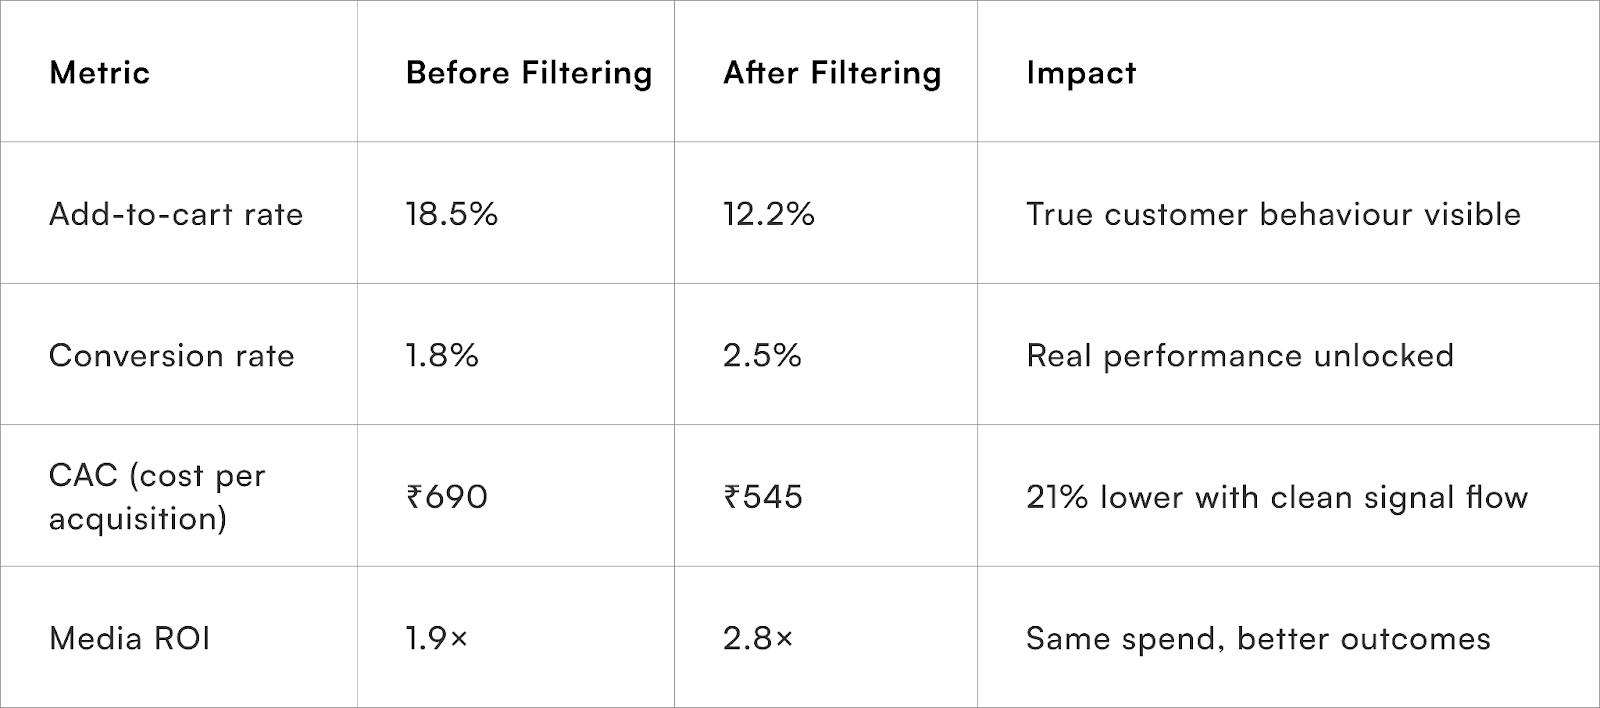
Example — Electronics Accessories D2C
A Delhi-based brand noticed inconsistent return on ad spend (ROAS) reports across platforms.
On Meta, ROAS appeared 2.4×; actual checkout data said 1.6×.
They implemented:
- Event deduplication (cart + payment retries)
- Canonical UTM enforcement
- Checkout-level conversion validation
Results (6 weeks):
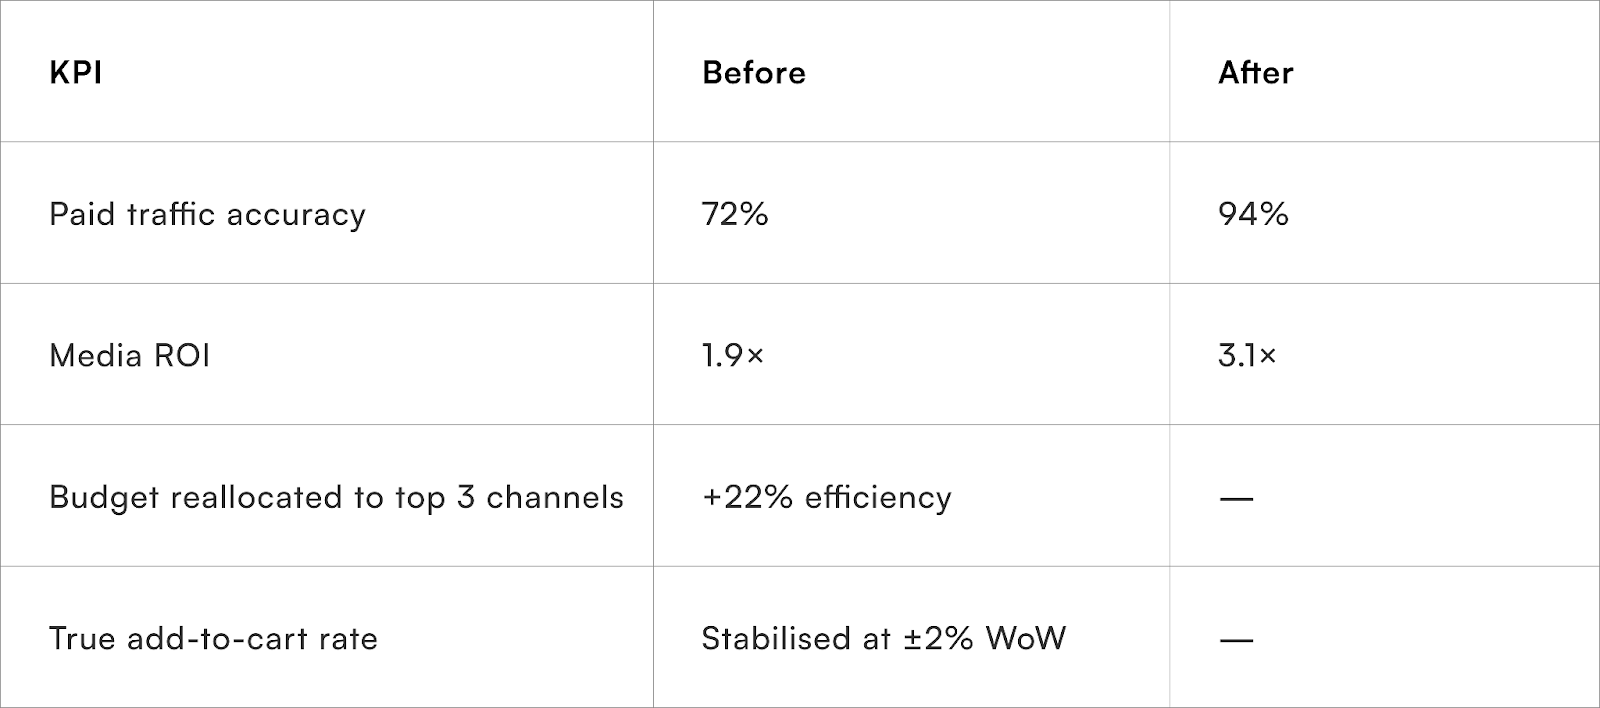
The takeaway: Filtering saves money more efficiently than scaling ever could.
Why Data Filtering Is Crucial for India-Specific Operations
Indian eCommerce is uniquely noisy.
Reasons include:
- Multi-device sessions (same customer across browser + app)
- High mobile network churn (new SIM = new attribution path)
- Reseller and affiliate overlap (ghost UTMs)
- Payment retries via UPI or wallet apps that resend signals
So while a U.S. brand might run on last-click attribution comfortably, an Indian D2C must often discount 10–20% of its signals just to find truth.
Filtering isn’t just a hygiene layer — it’s the foundation for sustainable marketing efficiency.
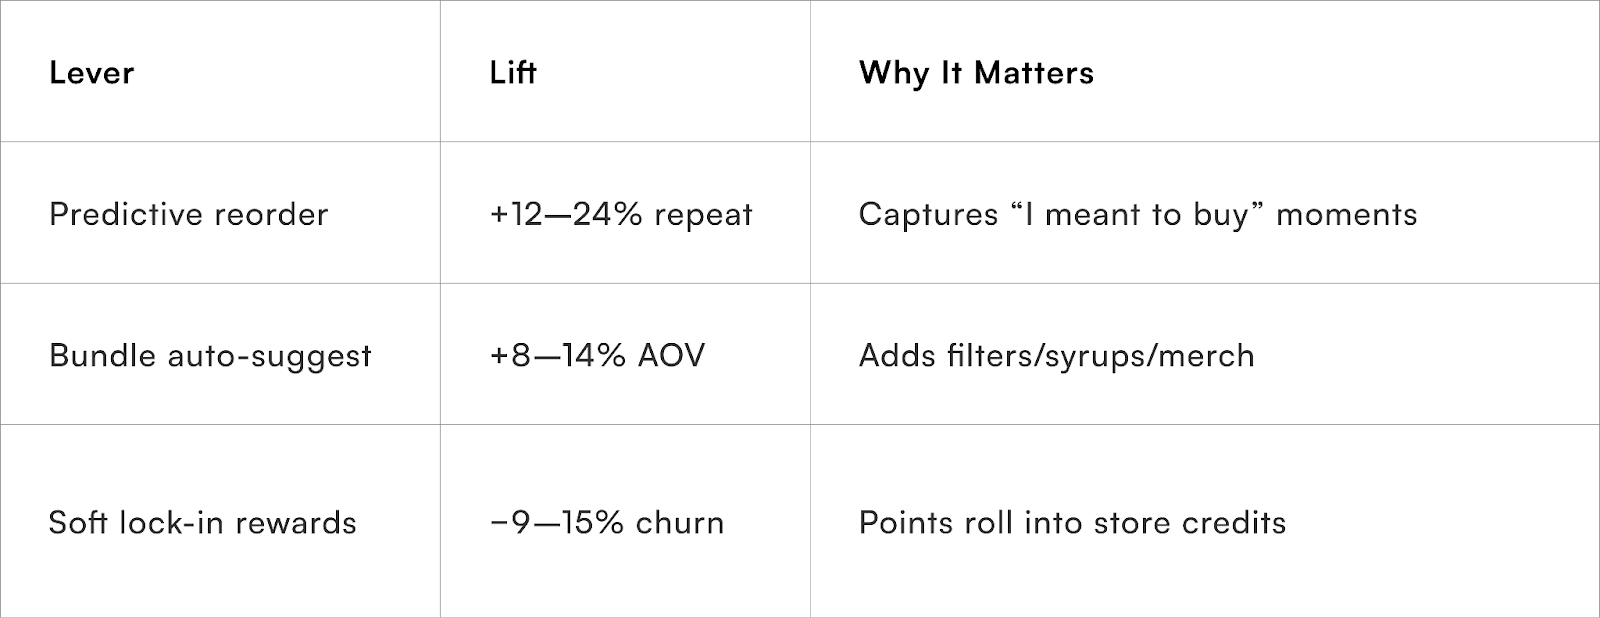
4) The Barista’s Signature → Predictive Subscriptions & Replenishment
Every café has “regulars”; every D2C needs predictive repeat models.
Regulars make cafés profitable. Subscriptions make D2C predictable.
Replenishment Flows (starting points):
Lightweight model:
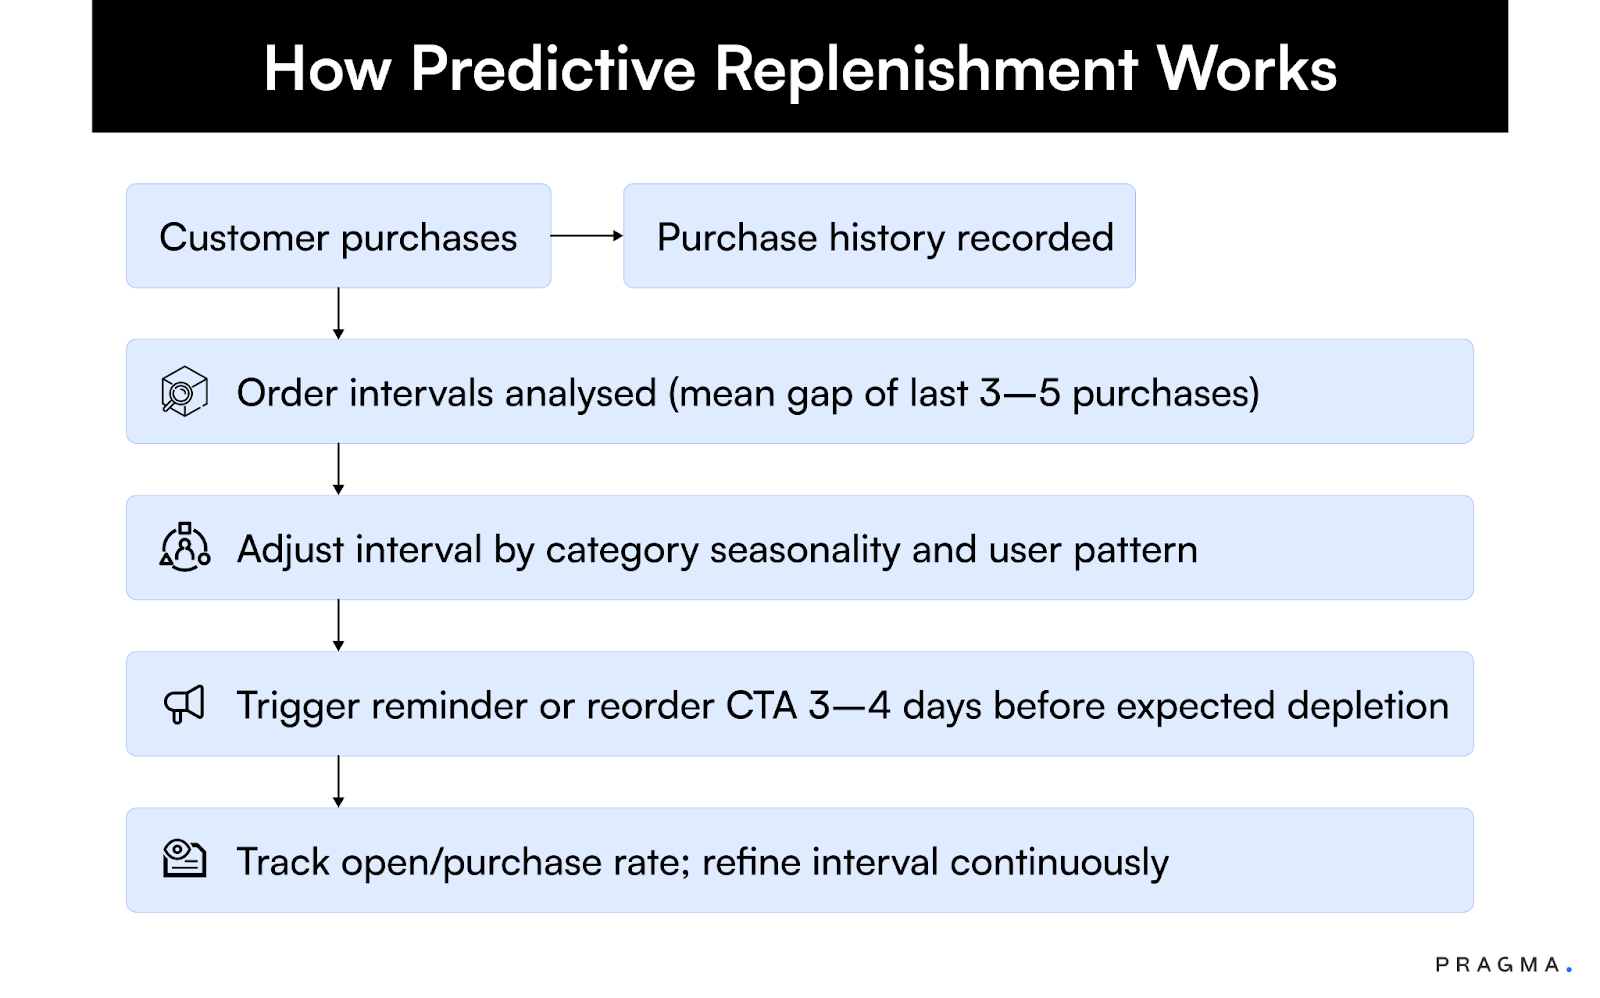
Predict the next order date by looking at the gaps between a customer’s last three orders, then nudge 3 days earlier with 1-tap reorder. Adjust by season, past purchase data etc (e.g., more ice-coffee in summer).
Example (coffee D2C, metro + Tier-2):
Indian coffee D2Cs see 20–25% higher LTV via subscriptions.
“Your usual in 2 taps?” push 3 days pre-run-out grew repeat revenue +21% and reduced churn −13% over 8 weeks. Pause/skip options prevented frustration.
Retention economics (illustrative):
Personalisation engine = your brand’s signature brew.
Why Predictive Replenishment Matters for Indian D2C
In India, repeat customers contribute 45–60% of revenue for mature D2C brands — but nearly 80% of retention efforts are still reactive: email reminders, loyalty points, or generic push messages.
The issue isn’t that customers don’t want to reorder.
It’s that brands fail to anticipate when and how they reorder.
That’s where predictive replenishment — built from behavioural signals — replaces gut-driven CRM calendars.
Understanding Replenishment Economics
A D2C brand’s repeat revenue depends on three core levers:
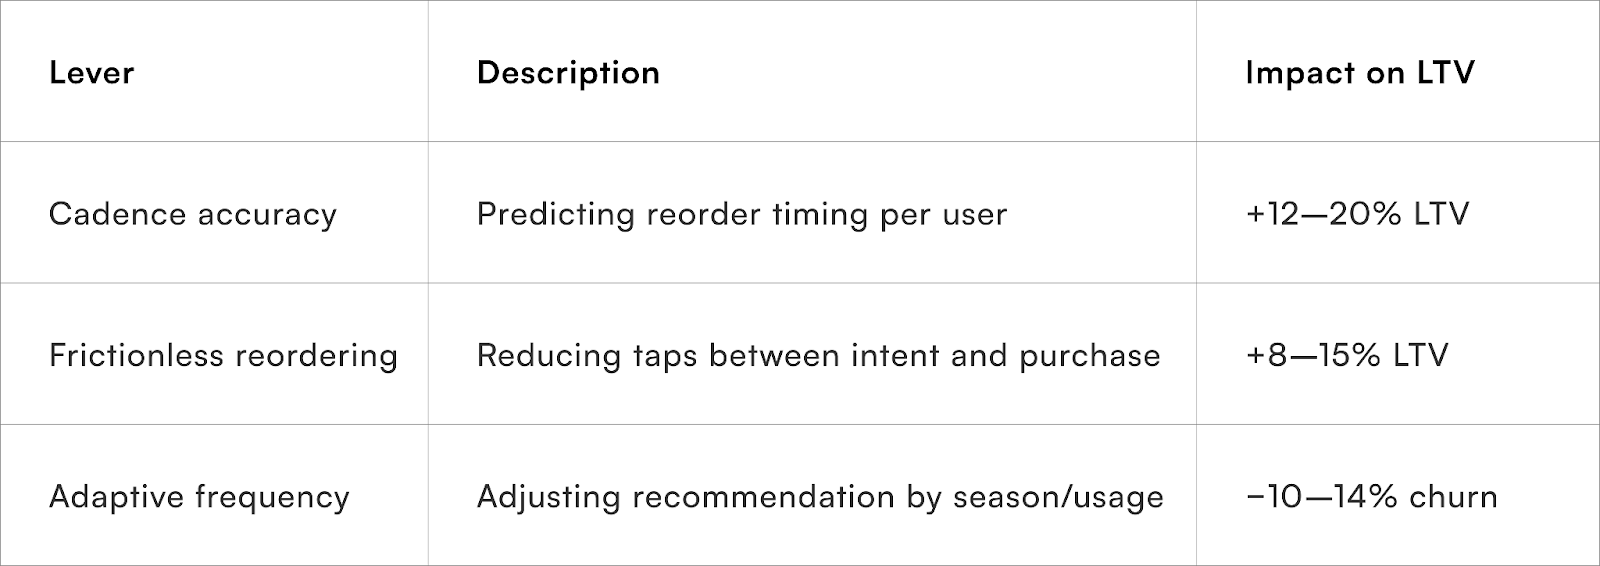
Predictive subscription systems balance all three through transaction interval modelling — forecasting the next likely order date using past order gaps, seasonality, and category trends.
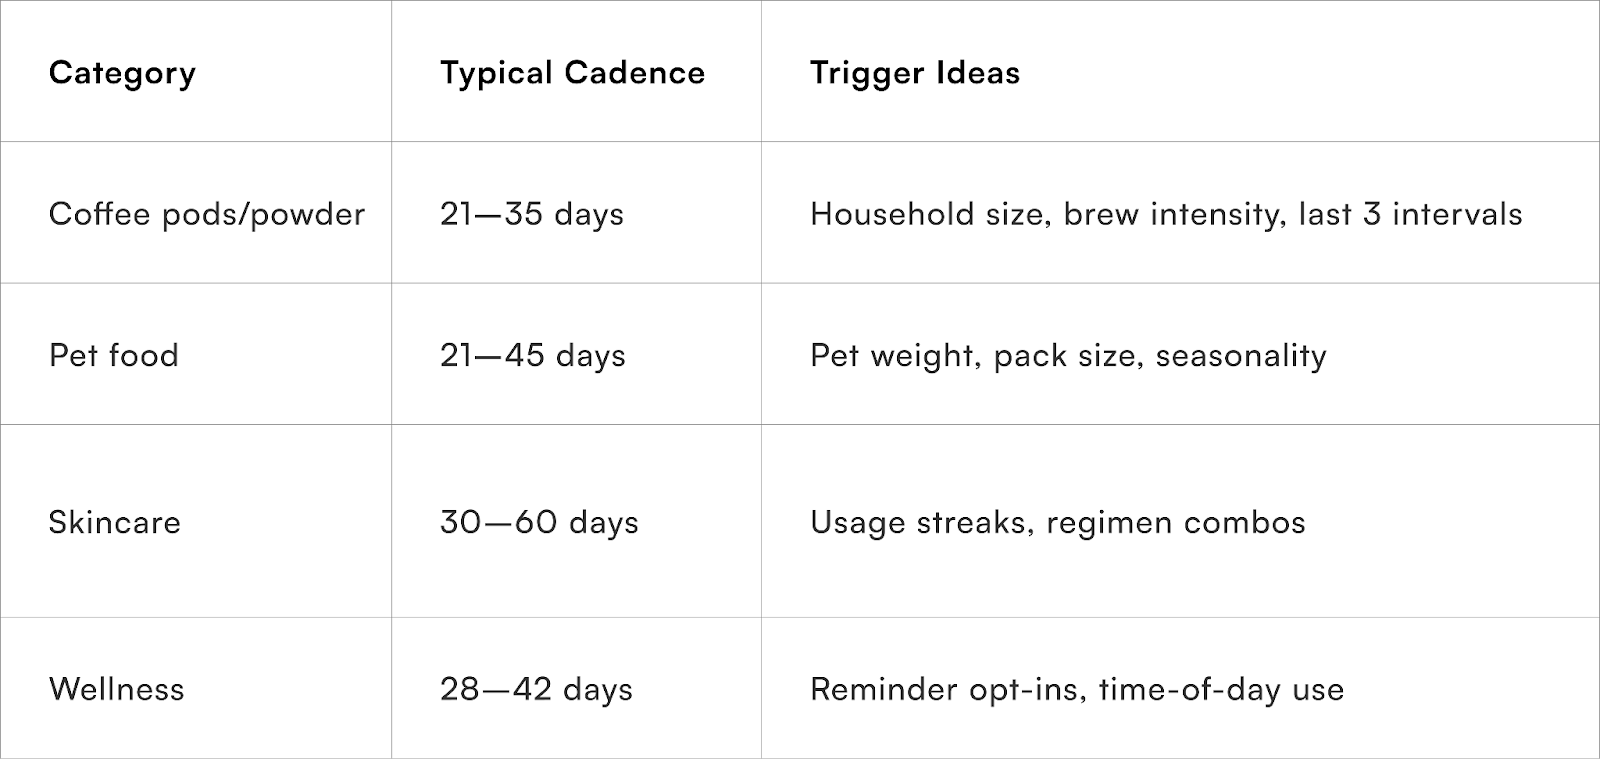
Example: The Indian Coffee Cadence
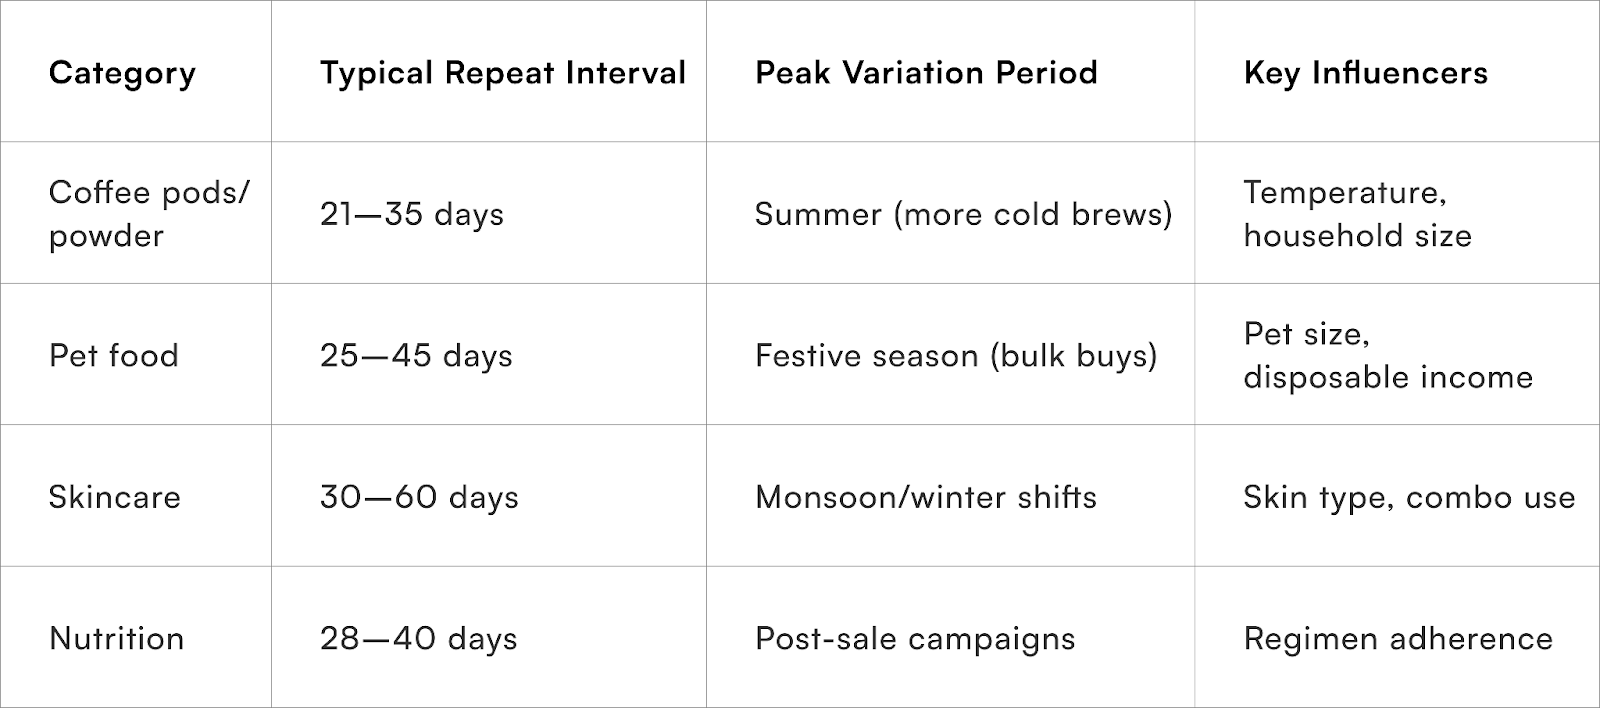
Predicting these intervals manually is impossible at scale — but machine learning models using even simple regression or clustering logic can predict 70–80% of reorder windows correctly.
It’s a living loop — one that learns with every cup brewed or serum emptied.
Case Study — Metro + Tier-2 Coffee D2C
A Bengaluru-based coffee brand running both D2C and marketplace channels realised:
- 68% of repeat purchases came within 30 days.
- 22% came within 60 days, but only after seeing a marketing nudge.
They introduced a lightweight predictive reorder model that triggered:
- Personalised WhatsApp or in-app message 3 days before estimated run-out.
- “Reorder your usual” CTA linked directly to last SKU in checkout.
- Pause/skip options to prevent push fatigue.
Results (over 8 weeks):
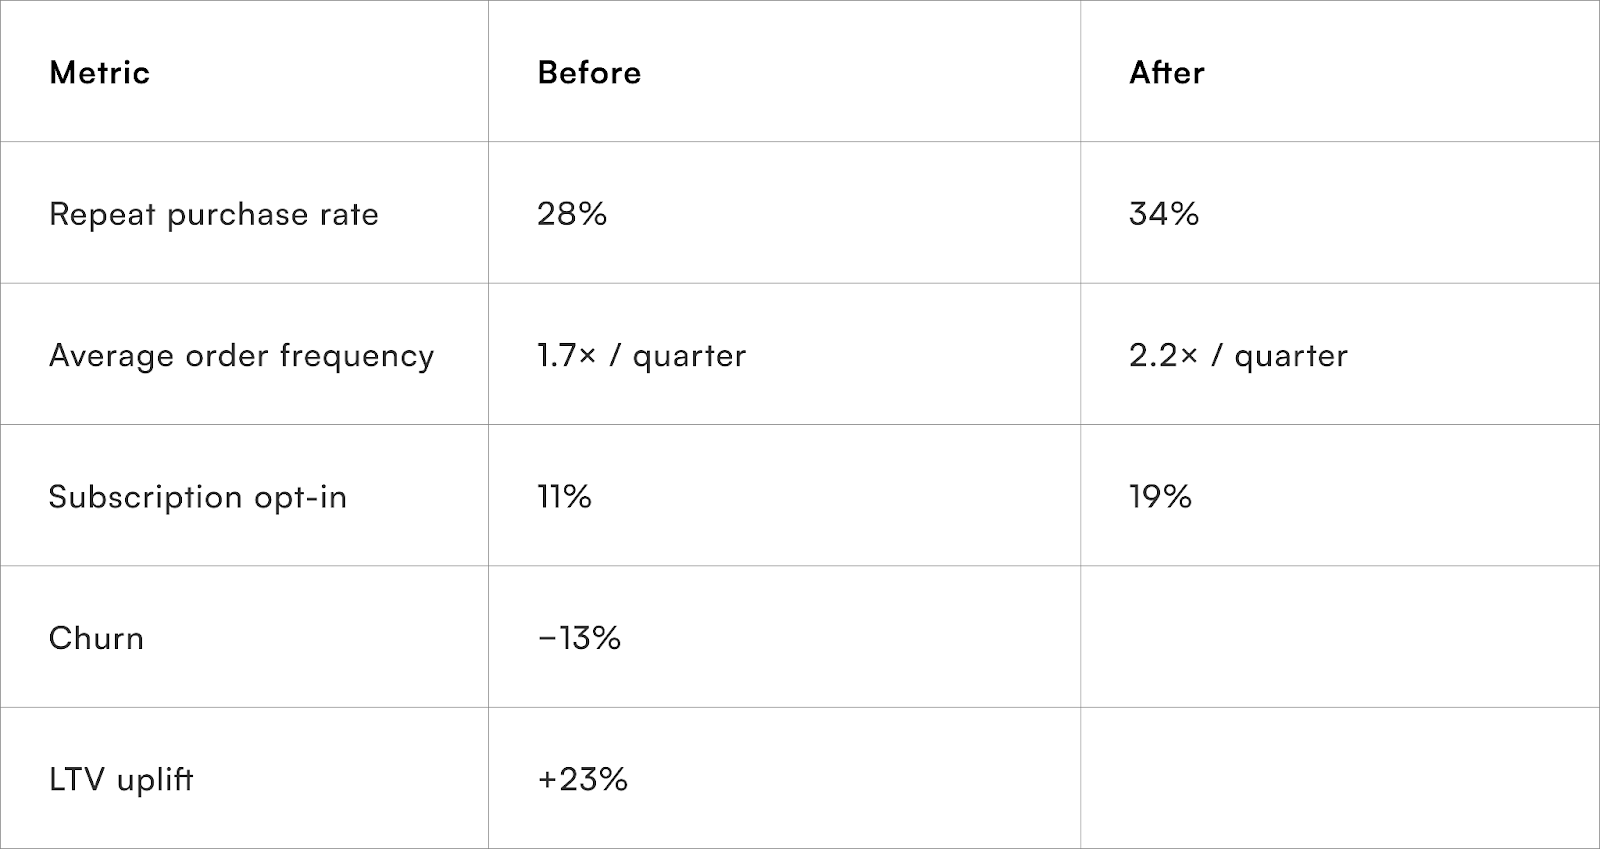
This wasn’t “subscribe & save” — it was predict & nudge.

Designing a Predictive Subscription Engine
Think of it as an autopilot for your returning customers — not a reminder system.
Why Predictive > Static Subscriptions
Most Indian subscription setups fail because they’re rigid — fixed intervals, same incentives, identical messaging.
Predictive systems, however, adapt in real time:
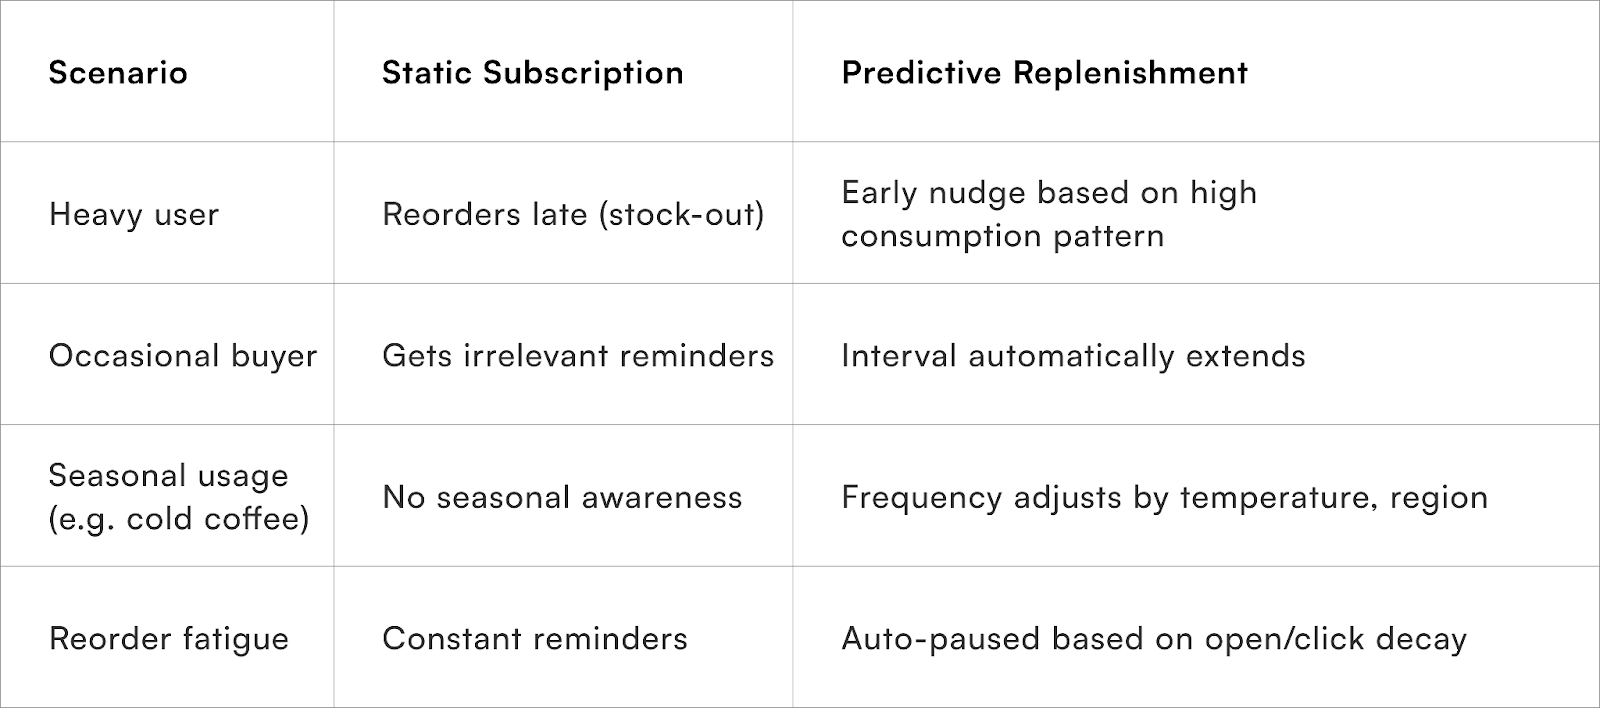
Predictive design isn’t just smarter — it’s empathetic.
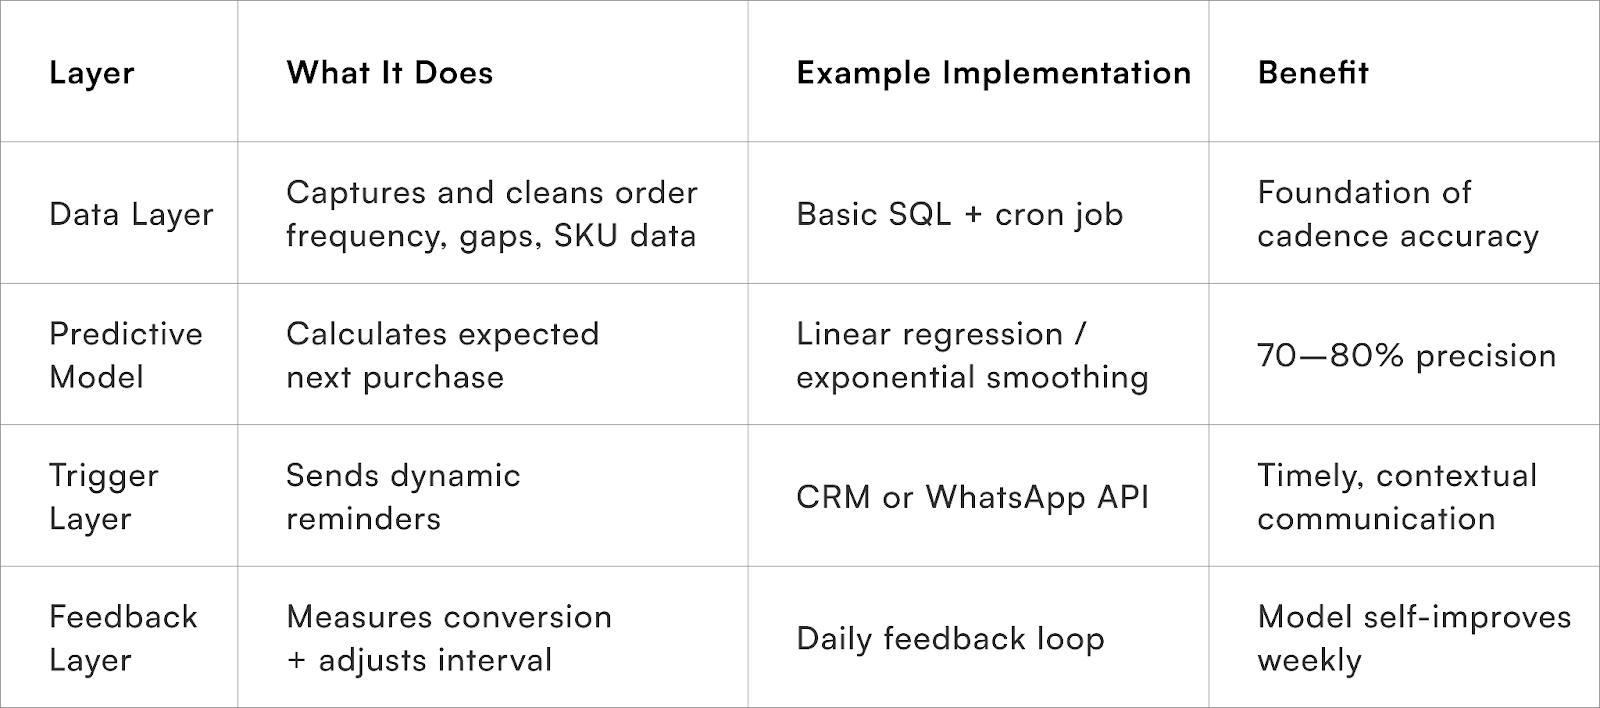
Operational Blueprint for Implementation
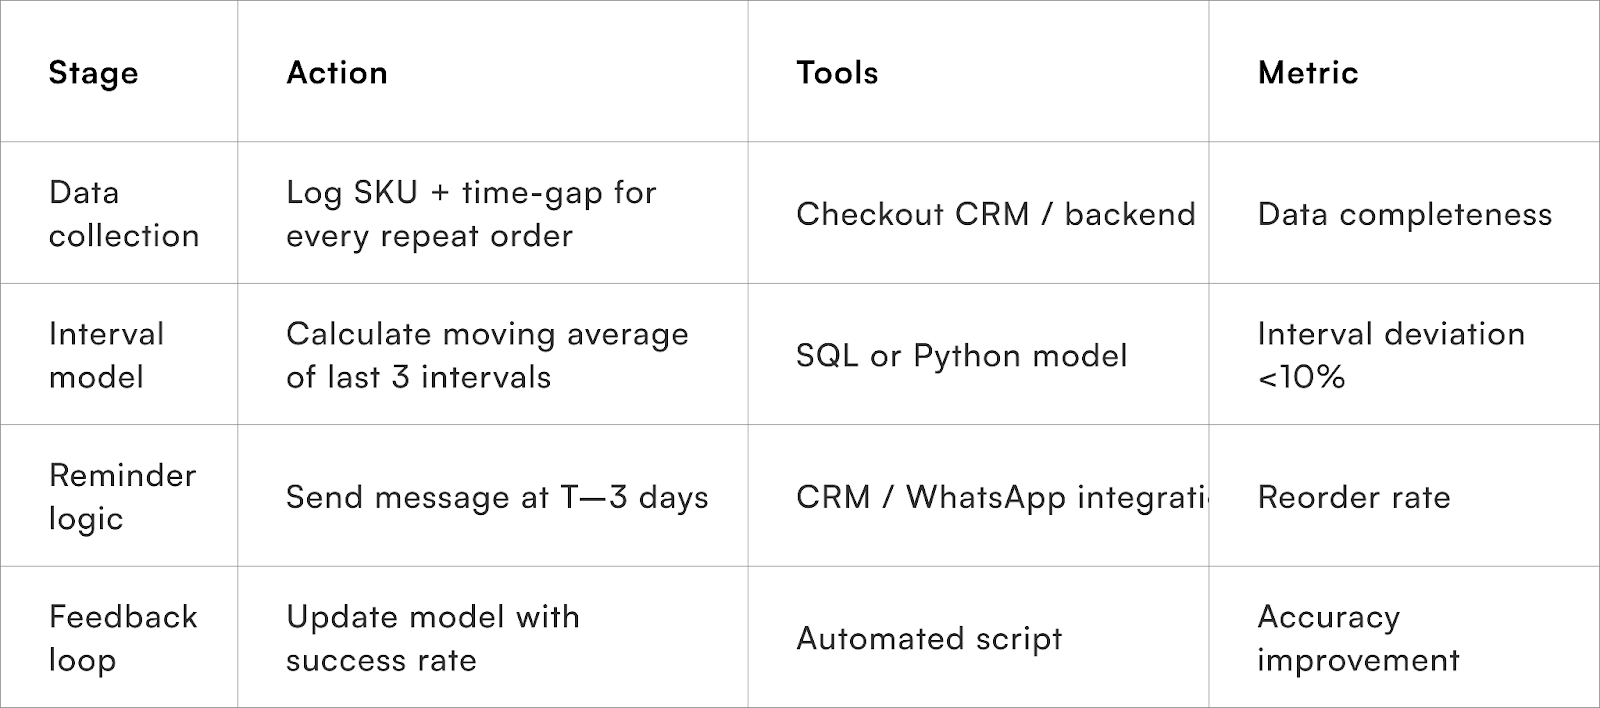
Even basic logic (like “3-purchase rolling average”) can outperform expensive automation platforms if tuned well.
Behavioural Layer: Habit Formation
Replenishment isn’t a logistics trick — it’s habit architecture.
When customers experience frictionless repeat cycles, they subconsciously trust the brand to anticipate their needs.
Key Indian data points:
- Brands using “1-tap reorder” flows see +15–20% repeat rate uplift.
- Adding pause/skip flexibility reduces churn by 10–12%.
- Personalised frequency suggestions outperform generic reminders by 2.3× CTR.
These habits compound into loyalty — not through loyalty points, but predictability.
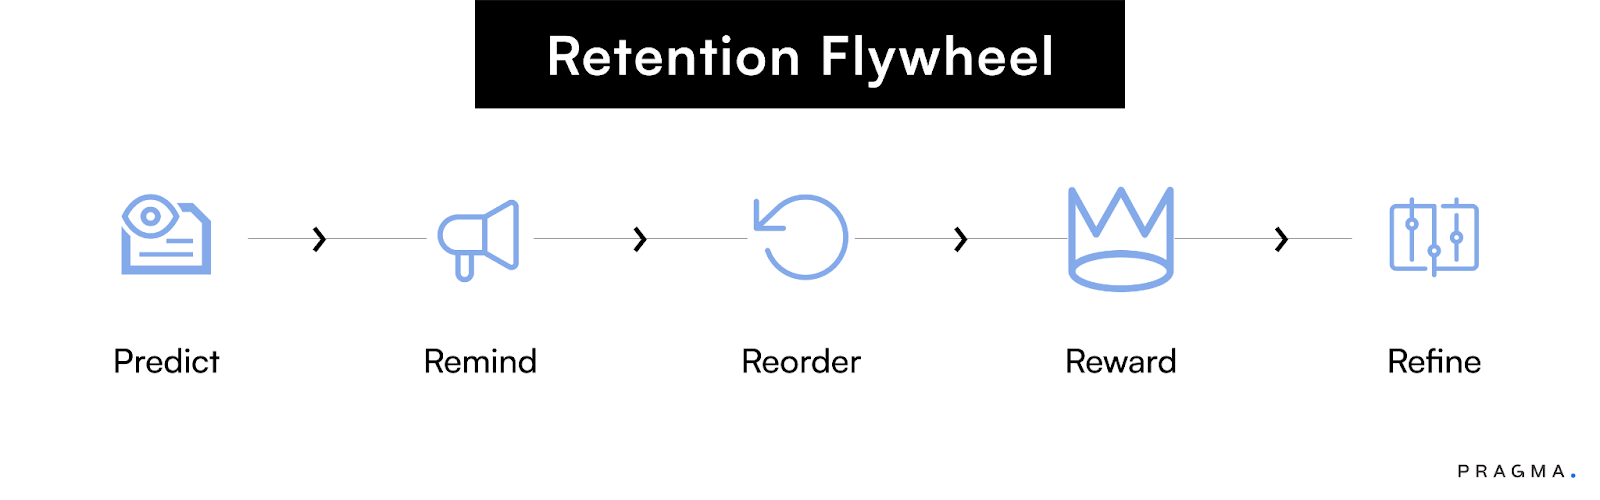
Every completed loop teaches the system when to ask again and how to time the next order.
Over time, the flywheel stabilises: predictable intervals, predictable revenue, predictable growth.
To note:
A café survives on regulars.
A D2C brand scales on repeaters.
Predictive replenishment is how you transform uncertain one-time shoppers into consistent monthly regulars.
When timing, tone, and convenience align — even caffeine becomes predictable.
5) Espresso-Martini Experiments → Cross-Category Collabs
Espresso martini = fusion → D2C collabs across categories
Collabs are exciting (coffee × skincare, coffee × nutrition). Operations decide who survives.
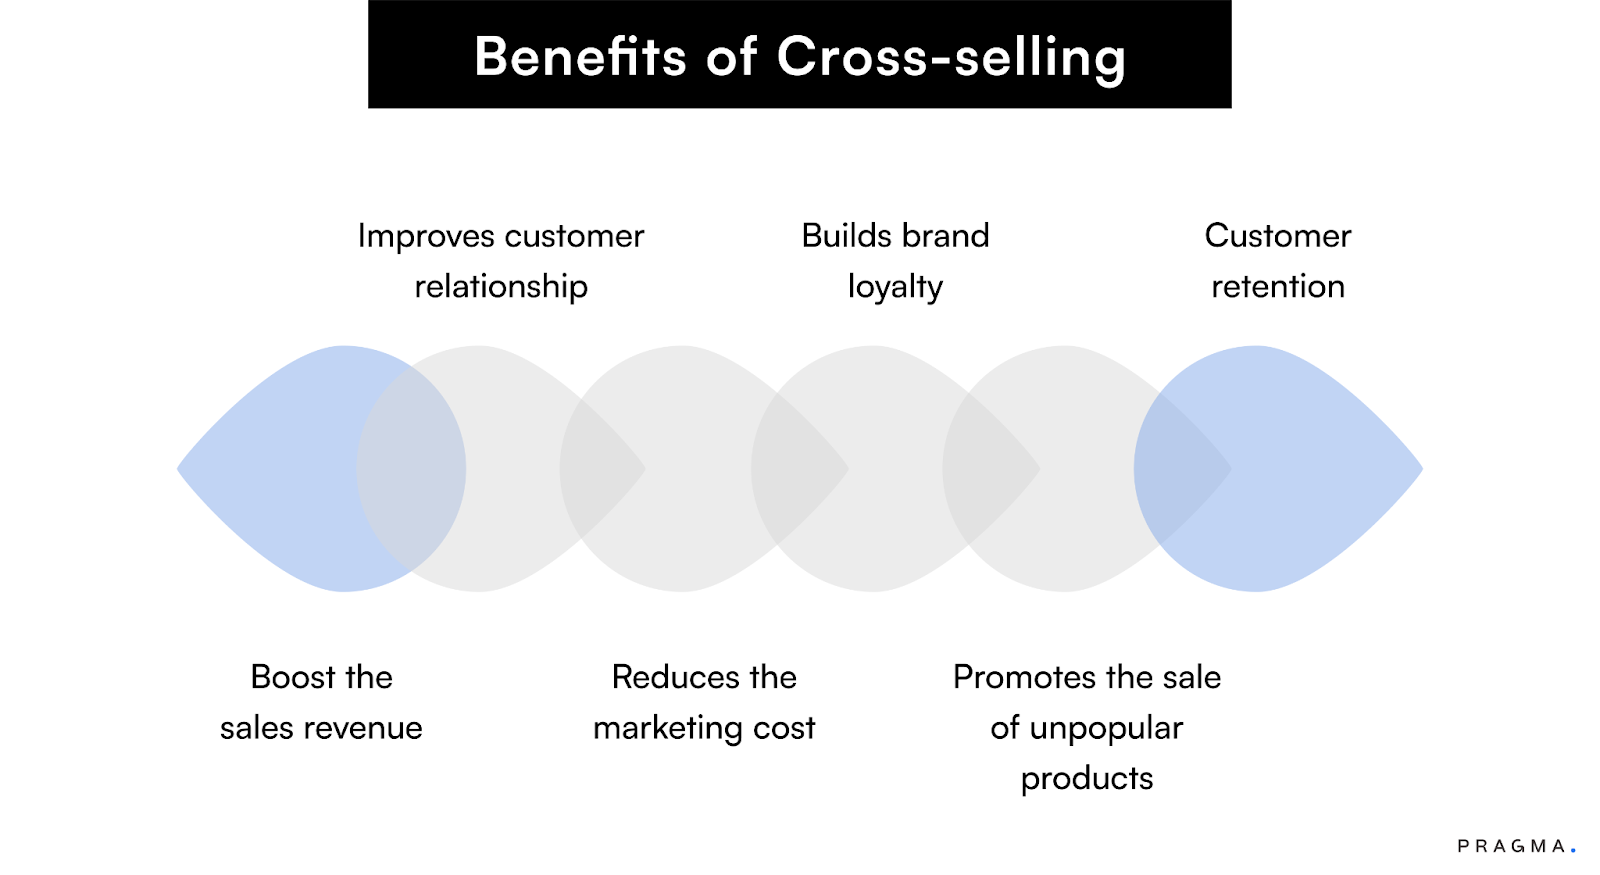
Upselling is nice, Cross-selling is great!
Collab mechanics:
Example:
India’s collab sales grew 3.2x YoY in festive 2024.
Tech enabler: shared inventory pools + unified checkout + campaign orchestration.
Virtual pooling across two 3PLs delivered 48-hr metros reliably. Unified checkout (one payment; automated split) cut cancellations −9%. The kit returned 3.4× ROAS vs either brand solo during launch week.
Campaign presets:
The Indian D2C Collaboration Wave
In FY24–25, cross-category collaborations among Indian D2C brands rose nearly 3.2× year-on-year, according to industry data from Unicommerce and Shiprocket ecosystem reports.
The reason is simple: performance marketing fatigue.
With rising CACs (Cost per Acquisition) — often +35–40% YoY — brands are borrowing each other’s audiences instead of fighting for the same impression.
A skincare label co-launching with a coffee brand isn’t random. It’s a CAC arbitrage strategy disguised as creativity.
Yet, only 2 out of 5 collabs in India deliver positive ROI. The difference? The ones that work share systems, not just campaigns.
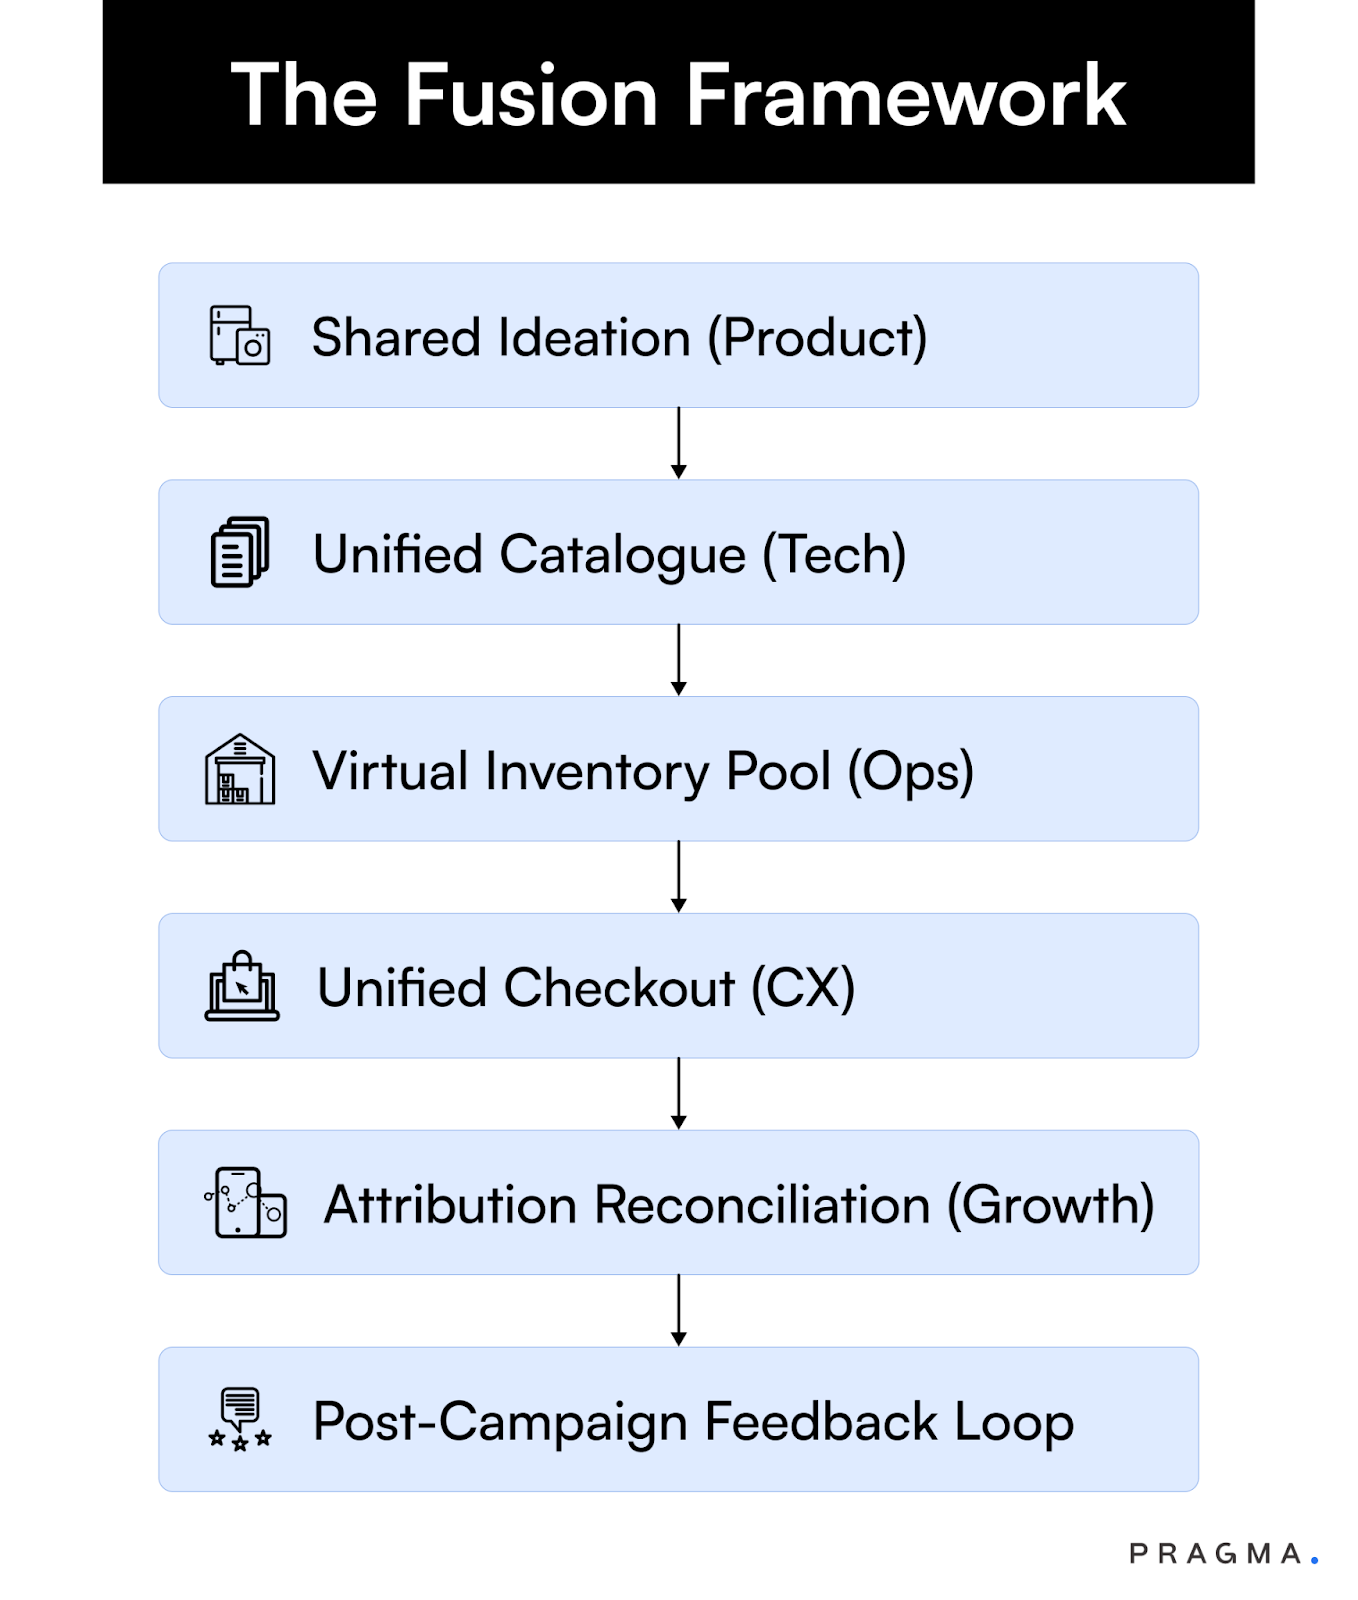
The Collaboration Stack — Anatomy of a D2C Fusion
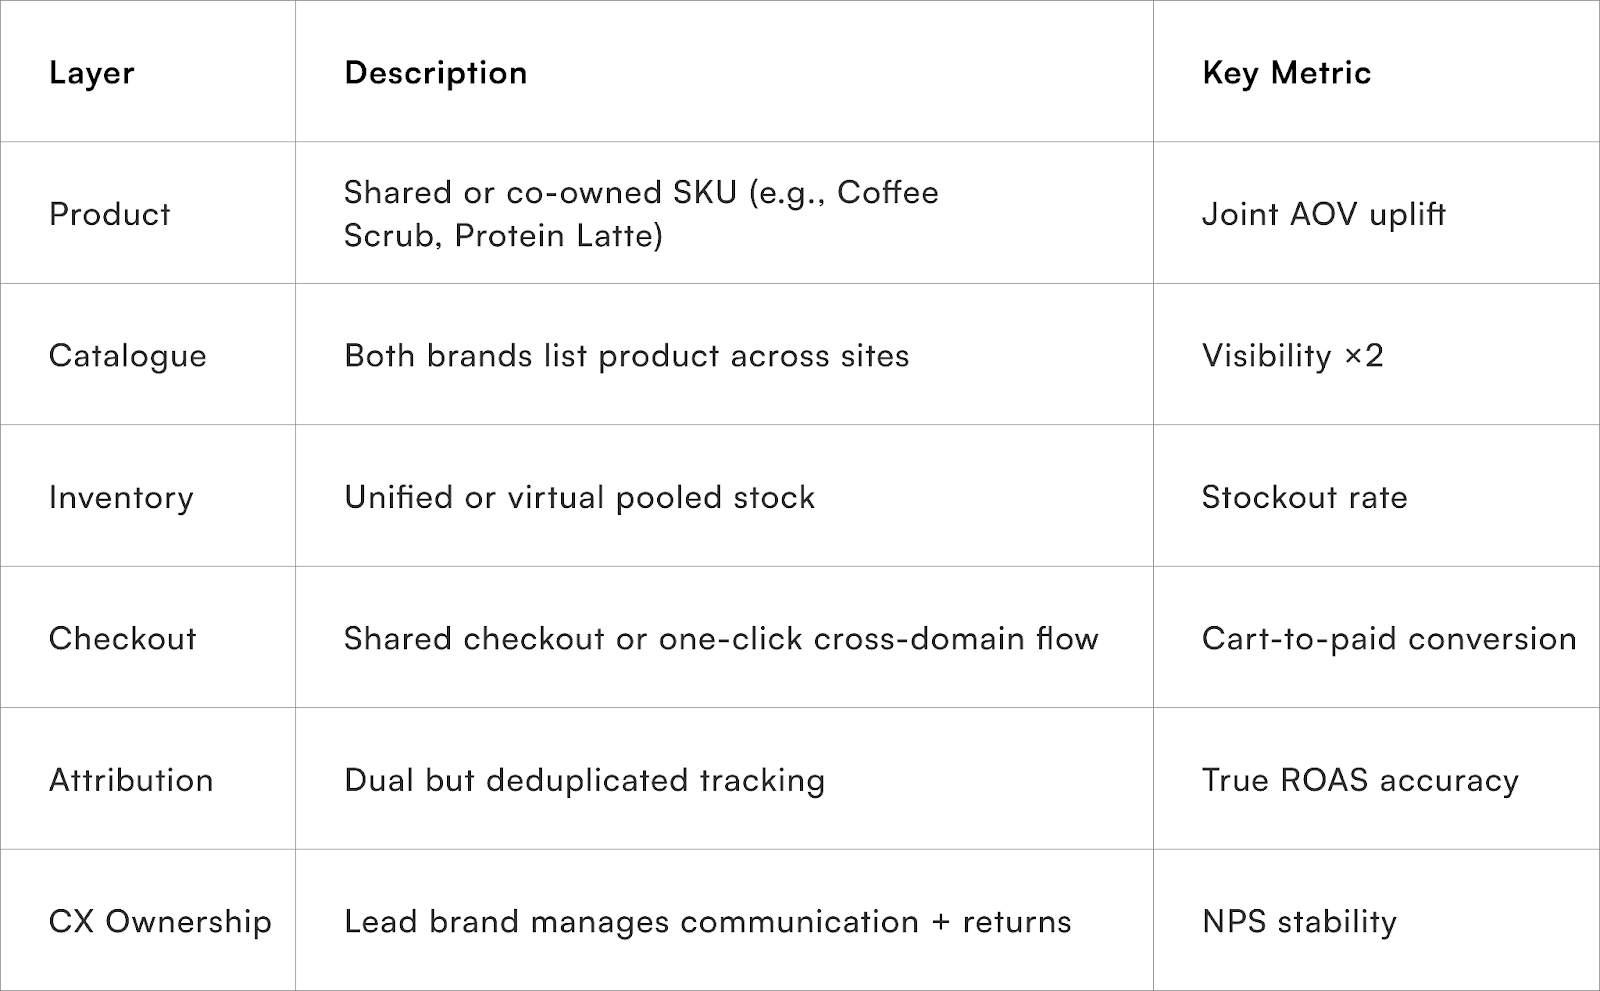
When these six layers align, a collab becomes an operational alliance, not a marketing fling.
Each node here must connect seamlessly. The moment one fails — e.g., one partner oversells stock or misattributes conversions — the ROI collapses.
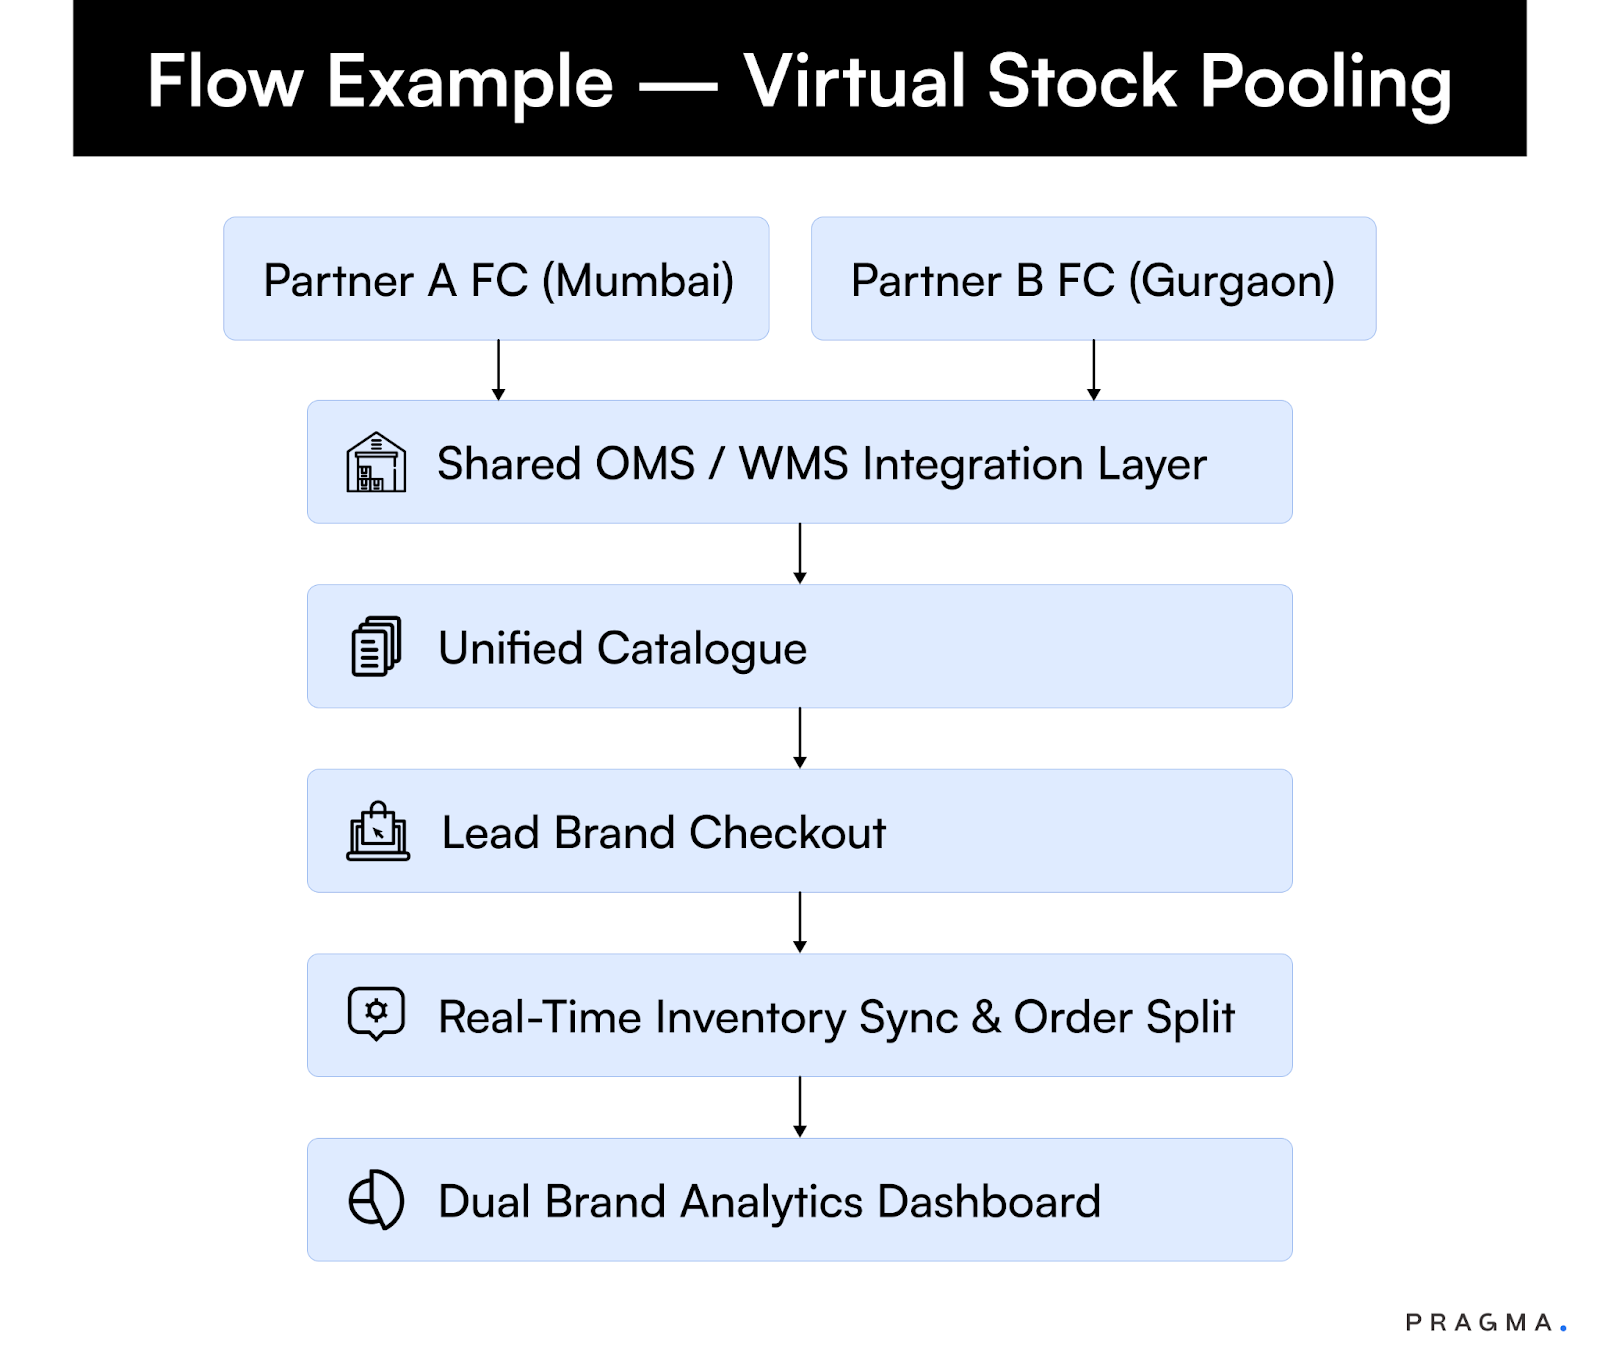
Operational Example — Coffee × Skincare Collaboration
Scenario:
A Bengaluru coffee brand and a Mumbai skincare D2C launch a co-branded “Coffee Scrub” limited edition.
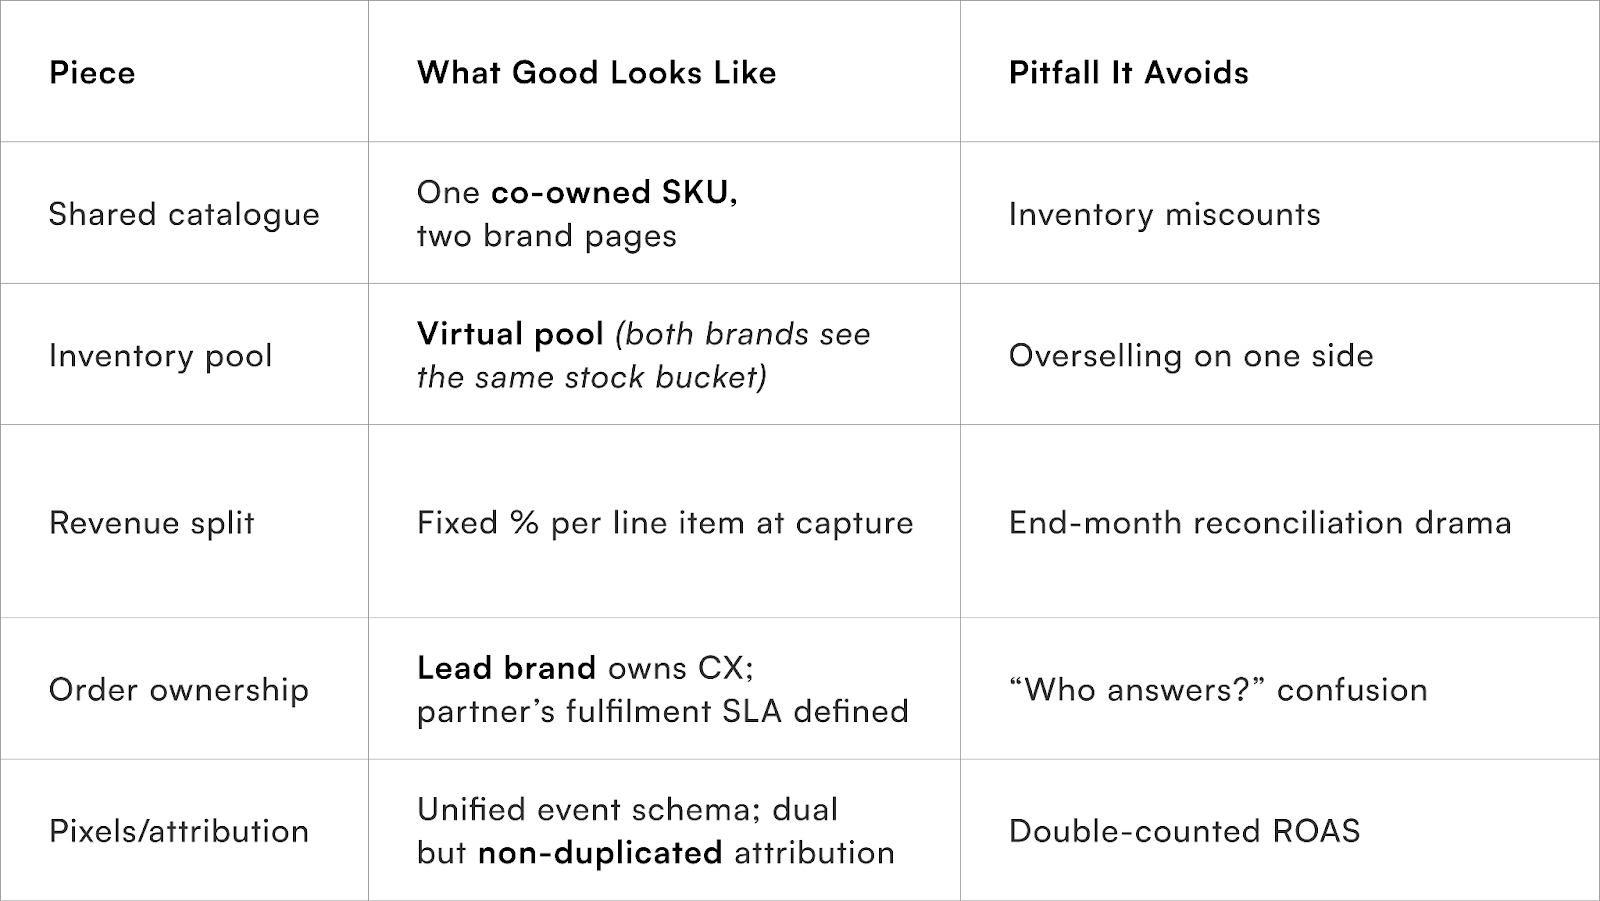
Approach:
- Shared SKU, listed on both websites.
- Inventory synced via a virtual stock pool (each FC updates availability in real-time).
- Single unified checkout hosted by lead brand.
- Revenue split by order source, reconciled via monthly ledger.
Results (4-week launch):
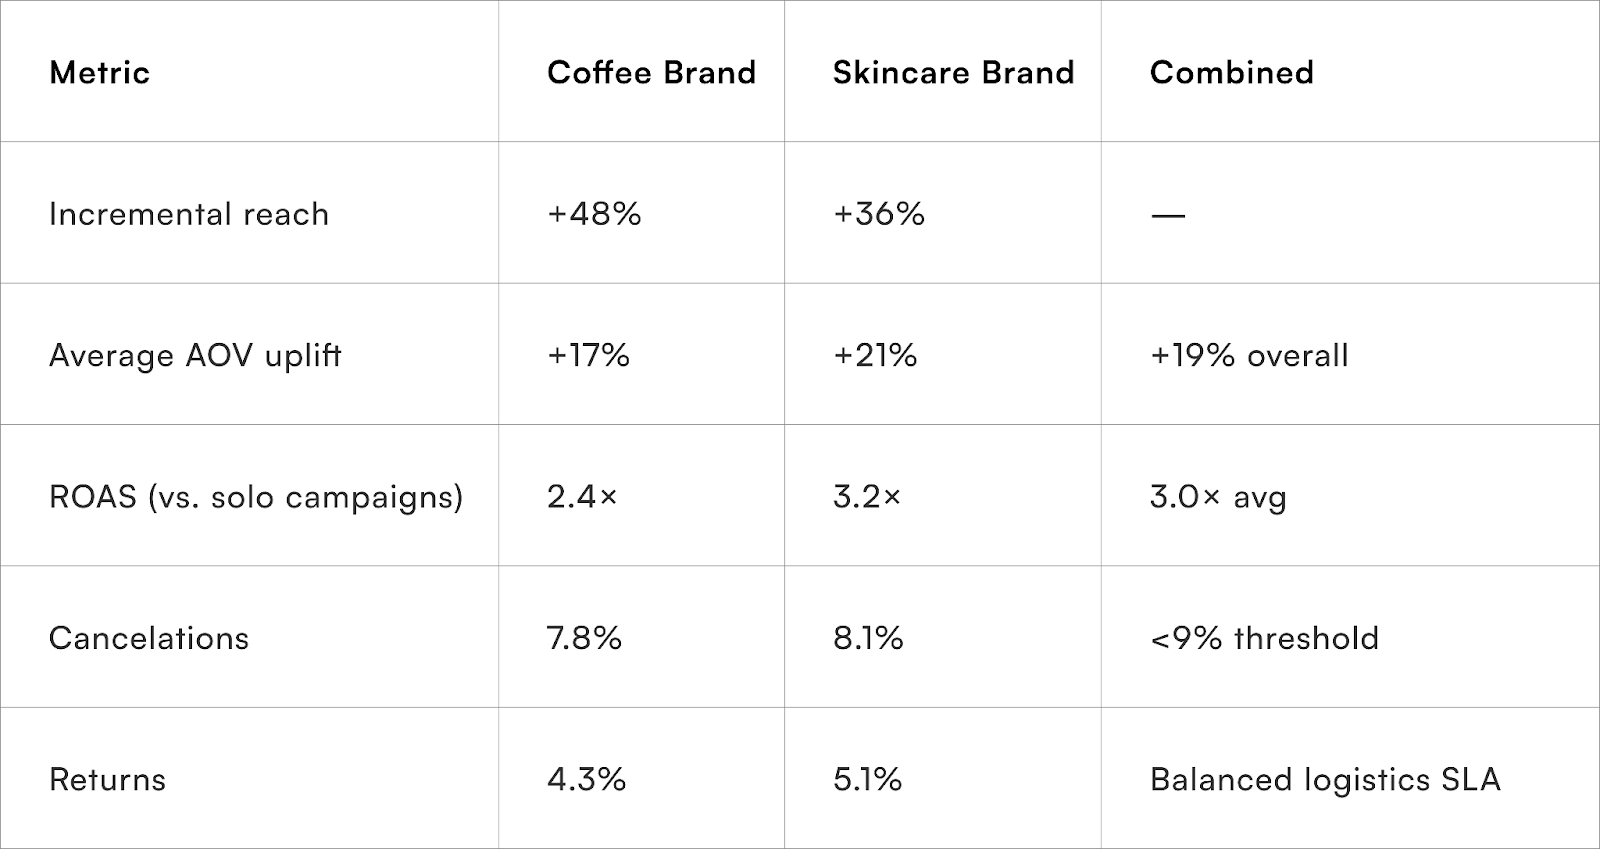
Beyond vanity metrics, the collaboration saved ~₹7.2L in combined media cost over 30 days.
That’s espresso-martini ROI — bitter, bold, and efficient.
Collaboration Mechanics That Work
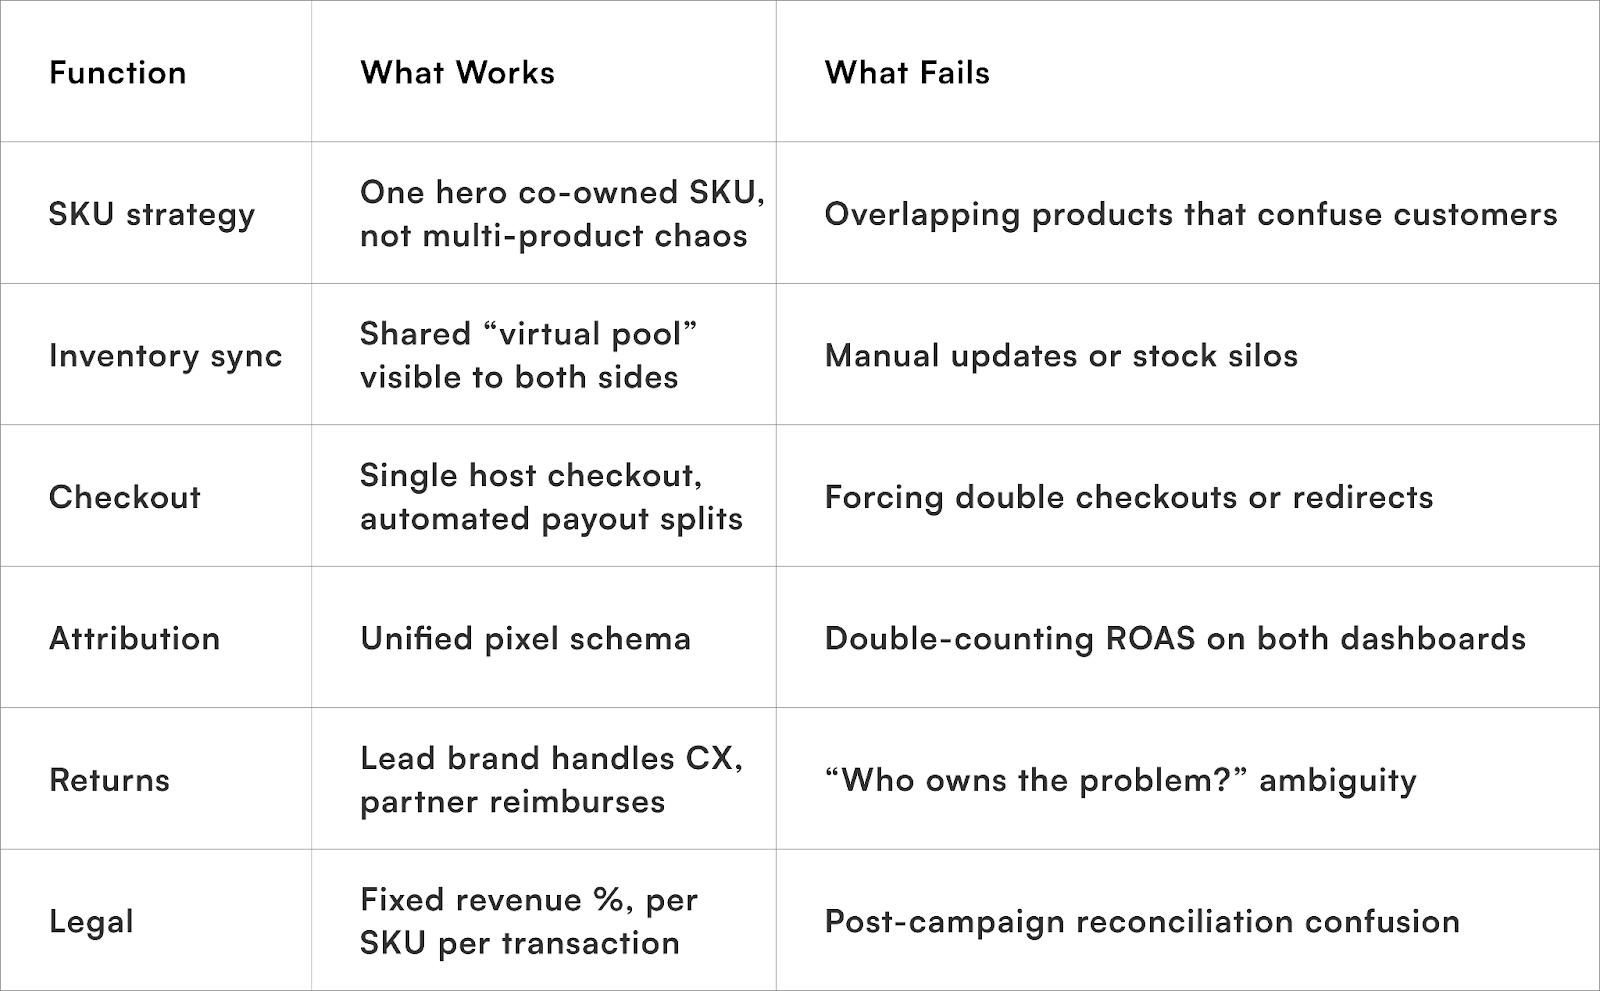
This model ensures both brands can sell the same SKU simultaneously without risking overselling or double dispatch.
It’s the operational equivalent of blending two espresso shots perfectly — distinct flavours, one pour.
Attribution Alignment: The Silent Killer
Most D2C collaborations fail not because of logistics, but because of attribution chaos.
Both brands tag the campaign with their own UTMs and pixels, leading to:
- Inflated ROAS (double-counted conversions)
- Mismatched performance reports
- Broken customer journeys post-click
Solution: Define a single “lead pixel” and share standardised UTM parameters before launch.
For example:
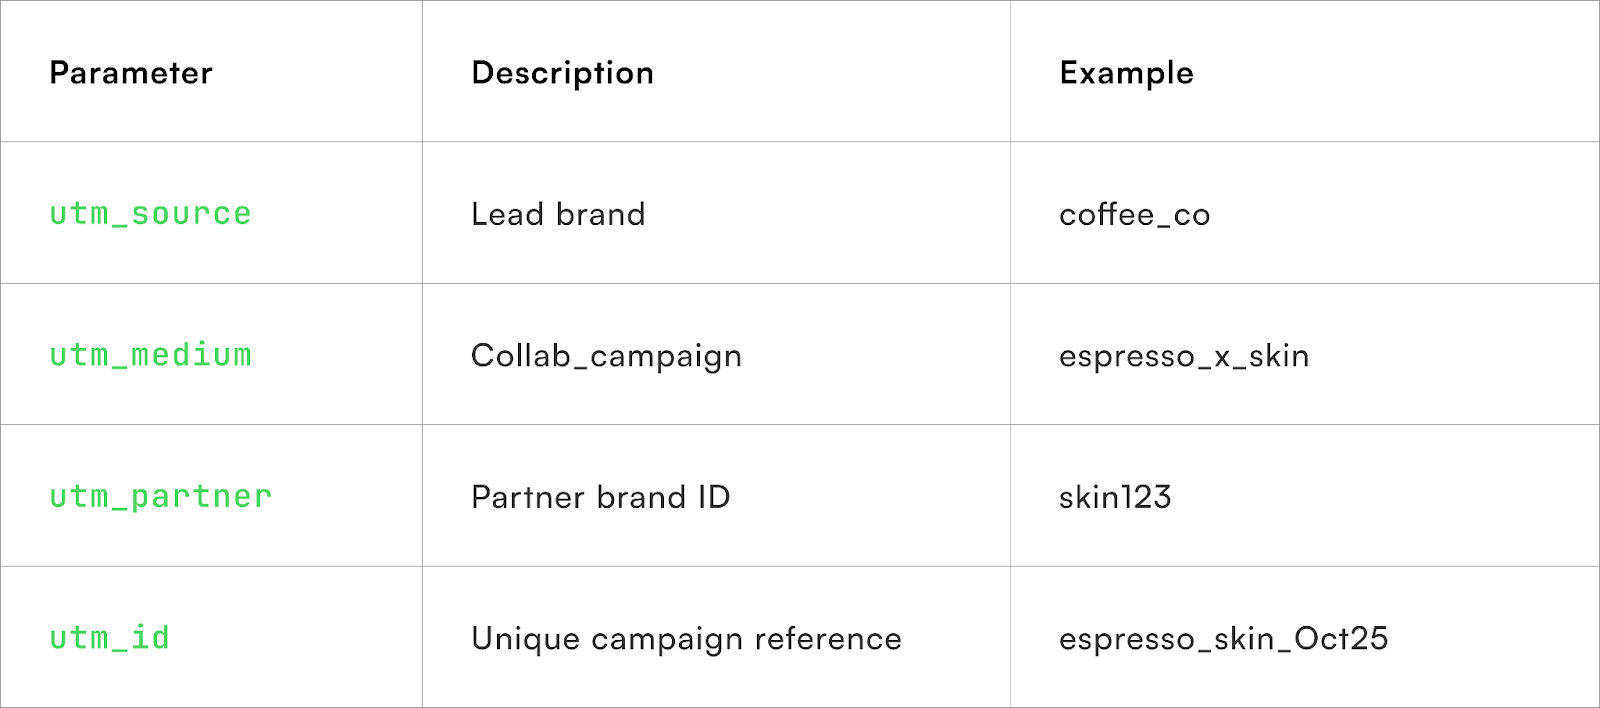
This prevents data noise and enables fair revenue attribution.
Revenue Splitting & Reconciliation
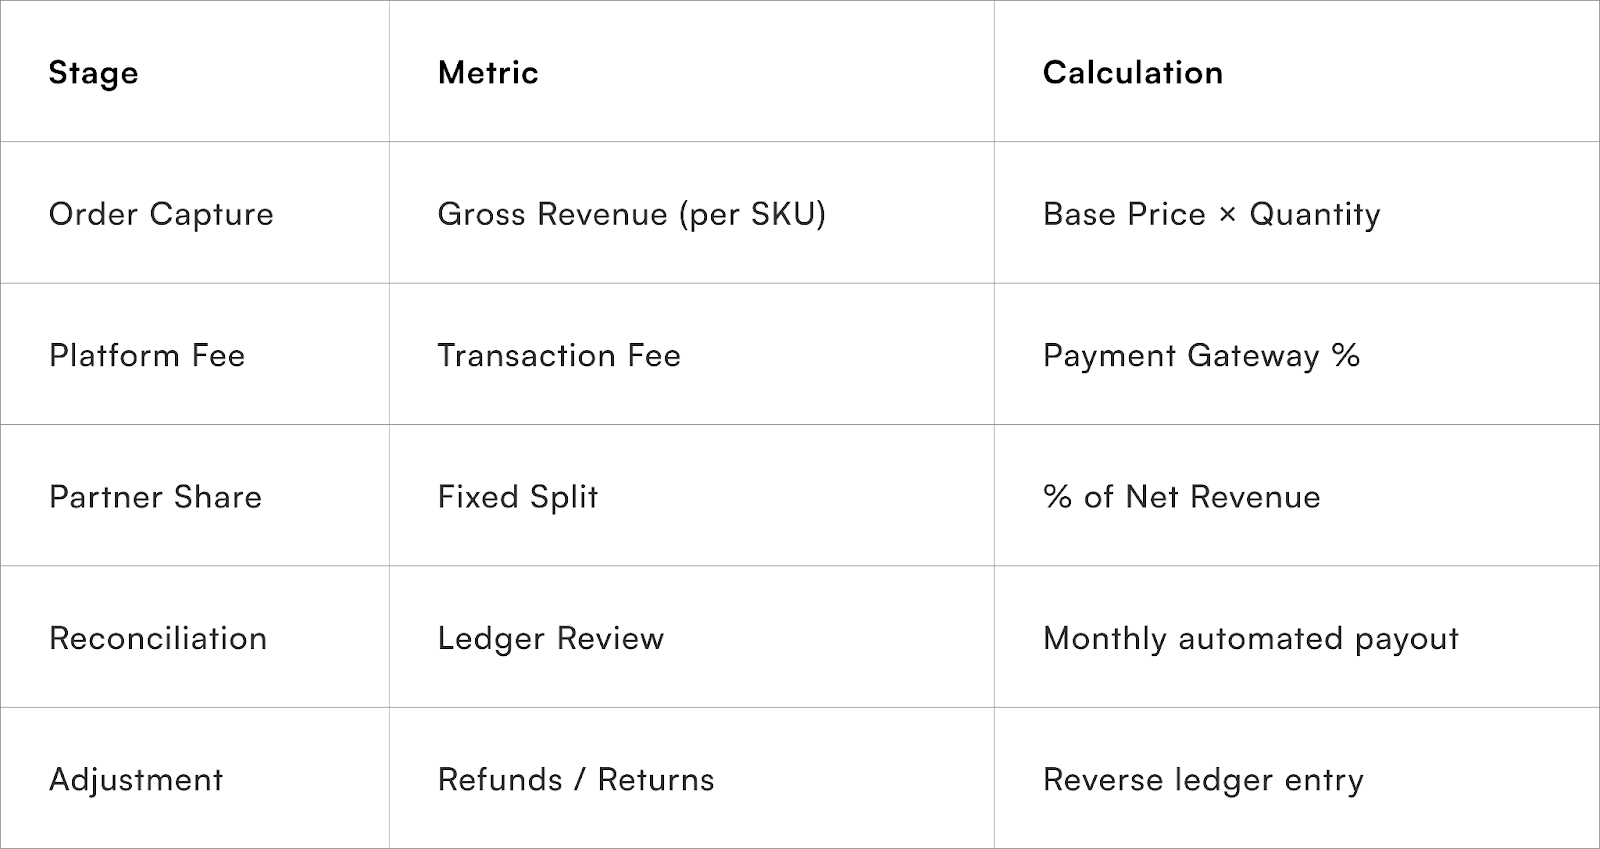
Clean collaboration finance is what separates real partnerships from PR tie-ups.
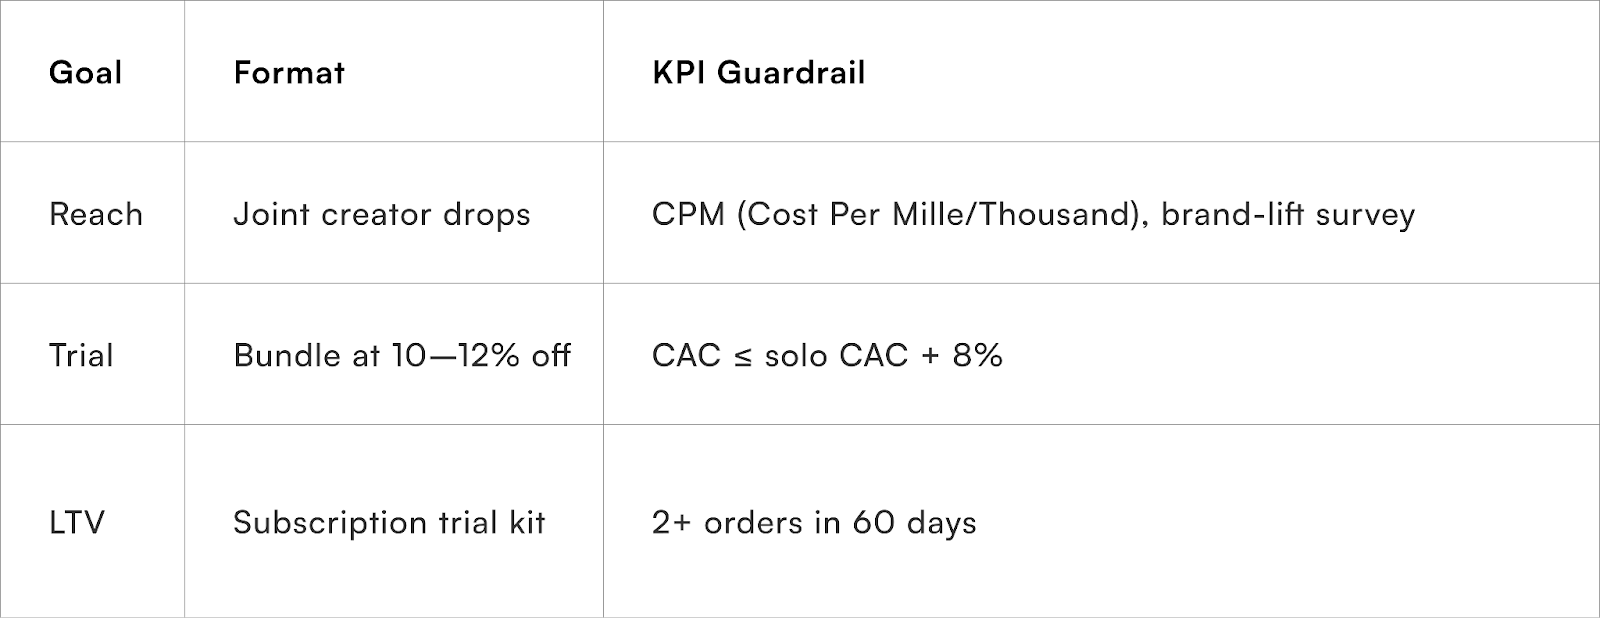
Collaborations by Intent Type (India FY25)
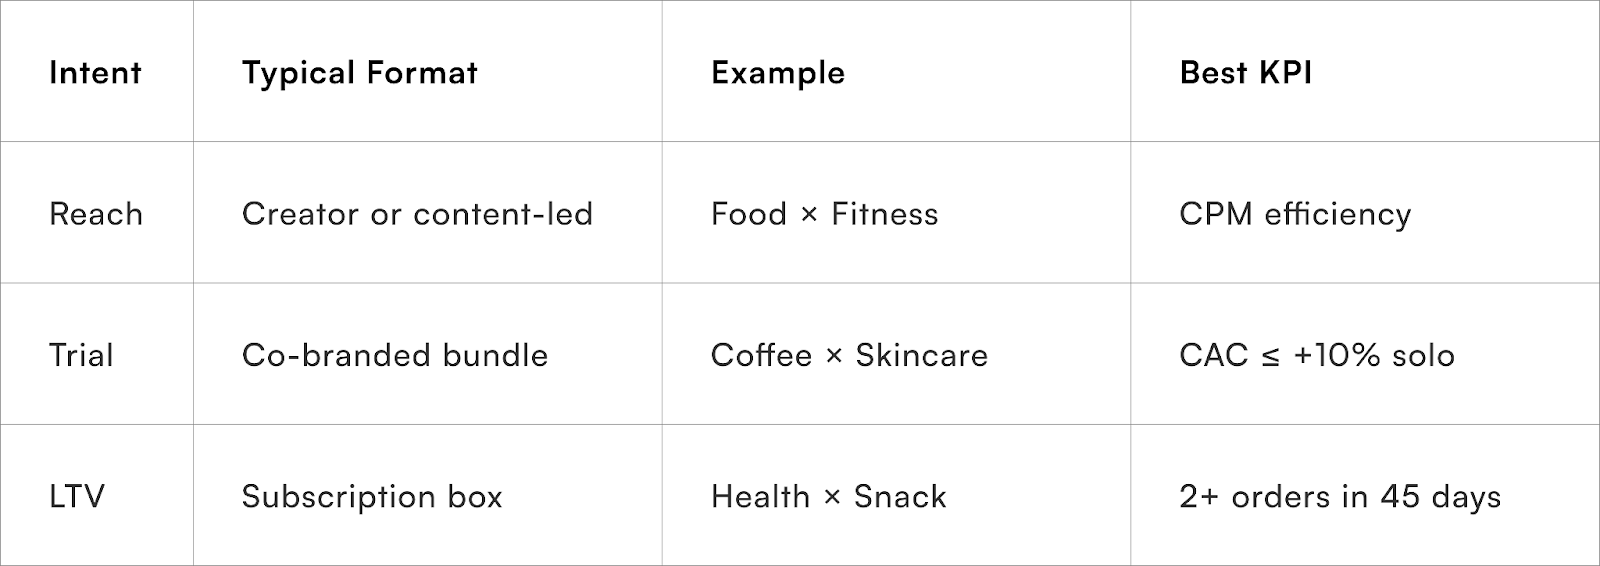
Indian D2Cs that prioritise Trial or LTV intent over pure reach see 1.8–2.4× ROI sustainability versus campaign-only collabs.
Operational Guardrails for Scalable Collabs
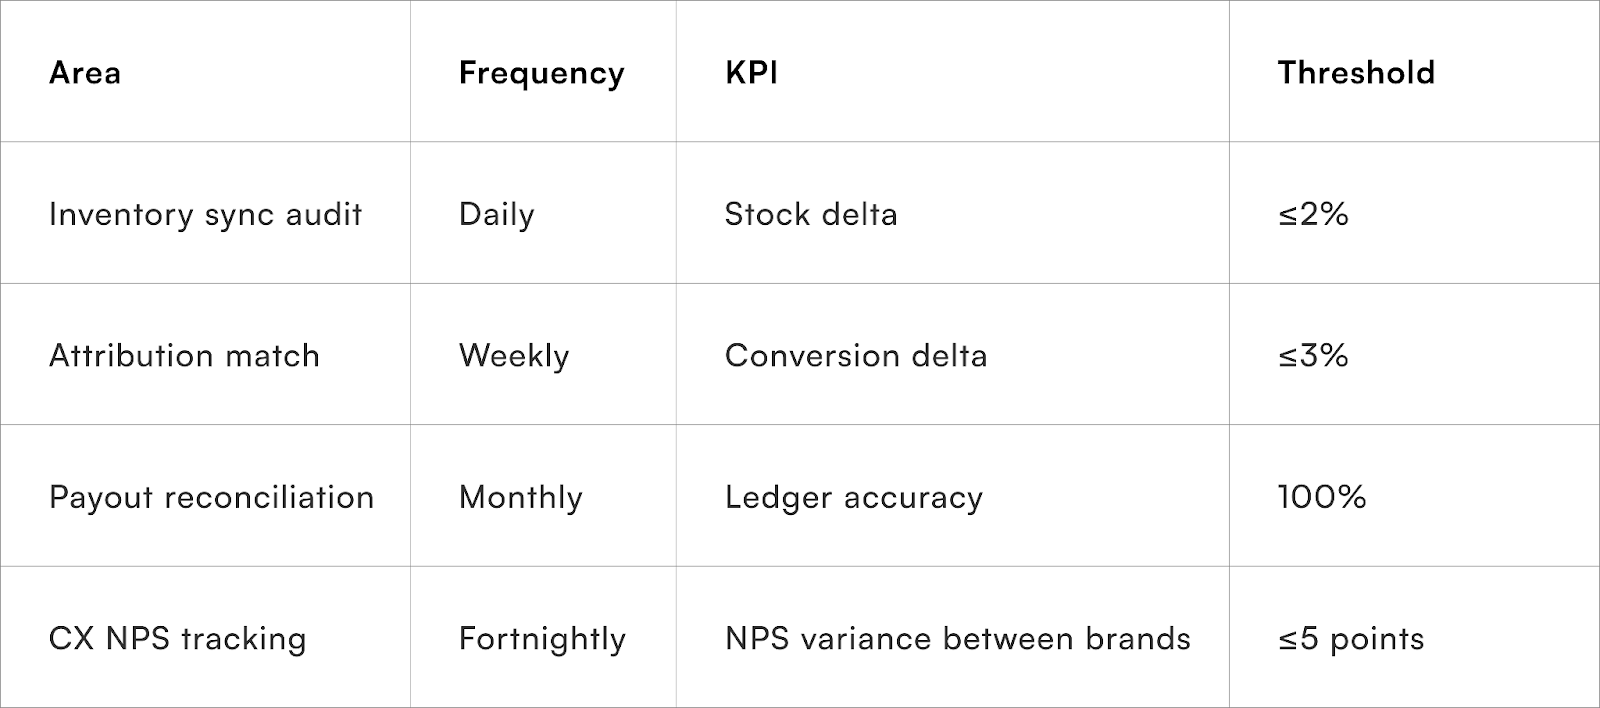
Collabs collapse without operational hygiene.
Just as espresso martinis fall apart if one element overpowers the other, D2C partnerships need calibrated ratios — product, process, and perception.
The Future: Collab-as-a-Service
As ecosystems mature, we’ll see shared-checkout infrastructure emerge — where two or more brands co-sell through one unified flow with automated split payments and shared attribution dashboards.
This will move collaborations from campaign experiments to recurring distribution channels.
Cross-category collaborations work when you build them like cocktails — balanced, structured, and strong on both sides.
The art is not just in mixing audiences, but in merging systems.
Because in D2C India, collaboration without clarity is chaos in a fancy glass.
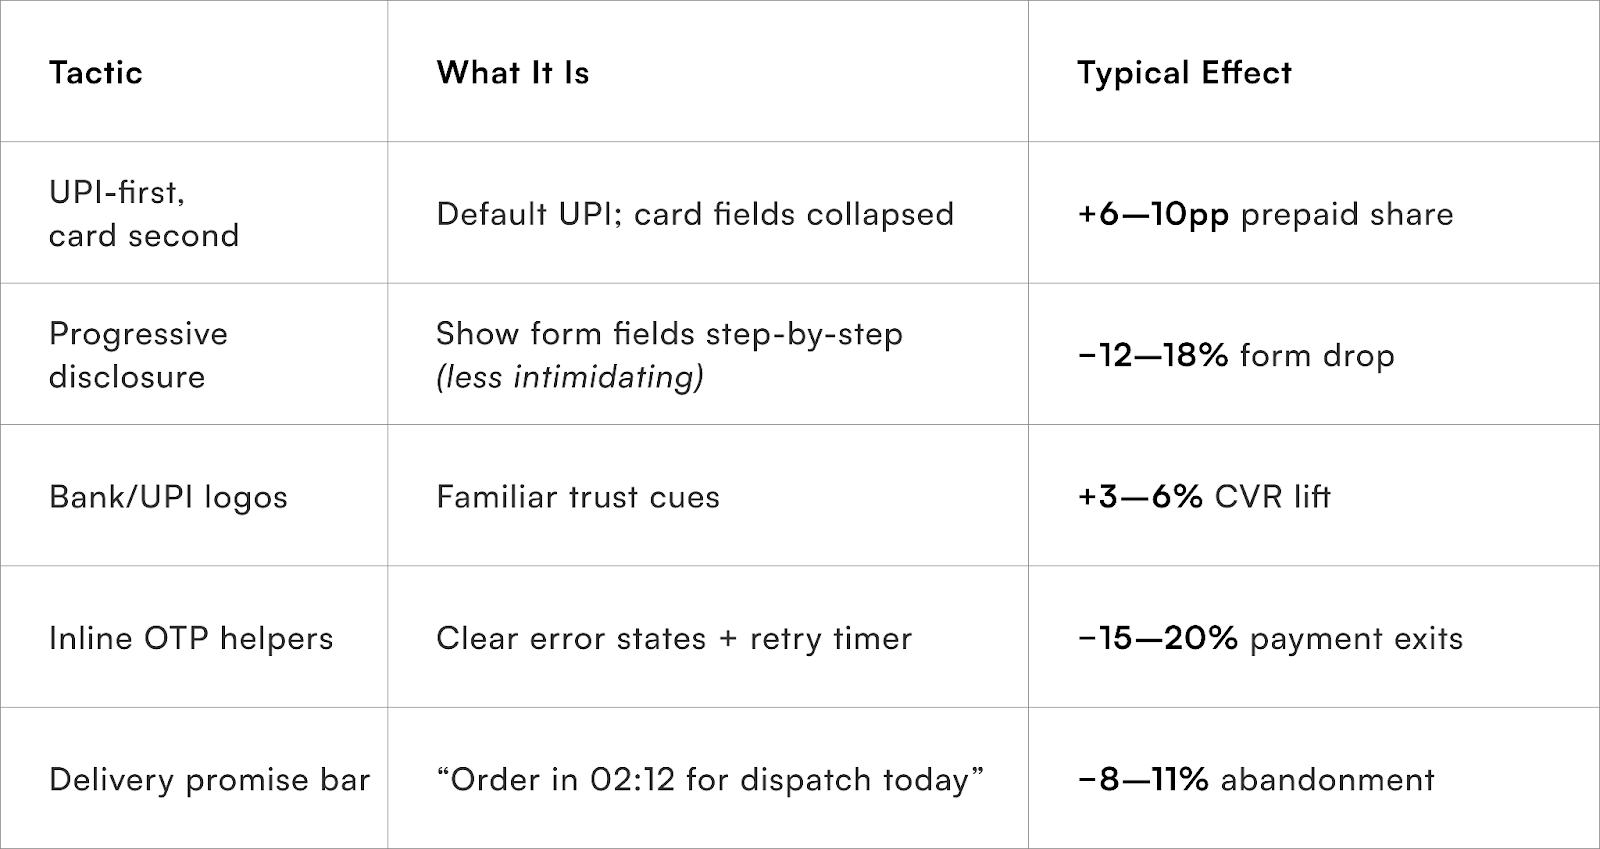
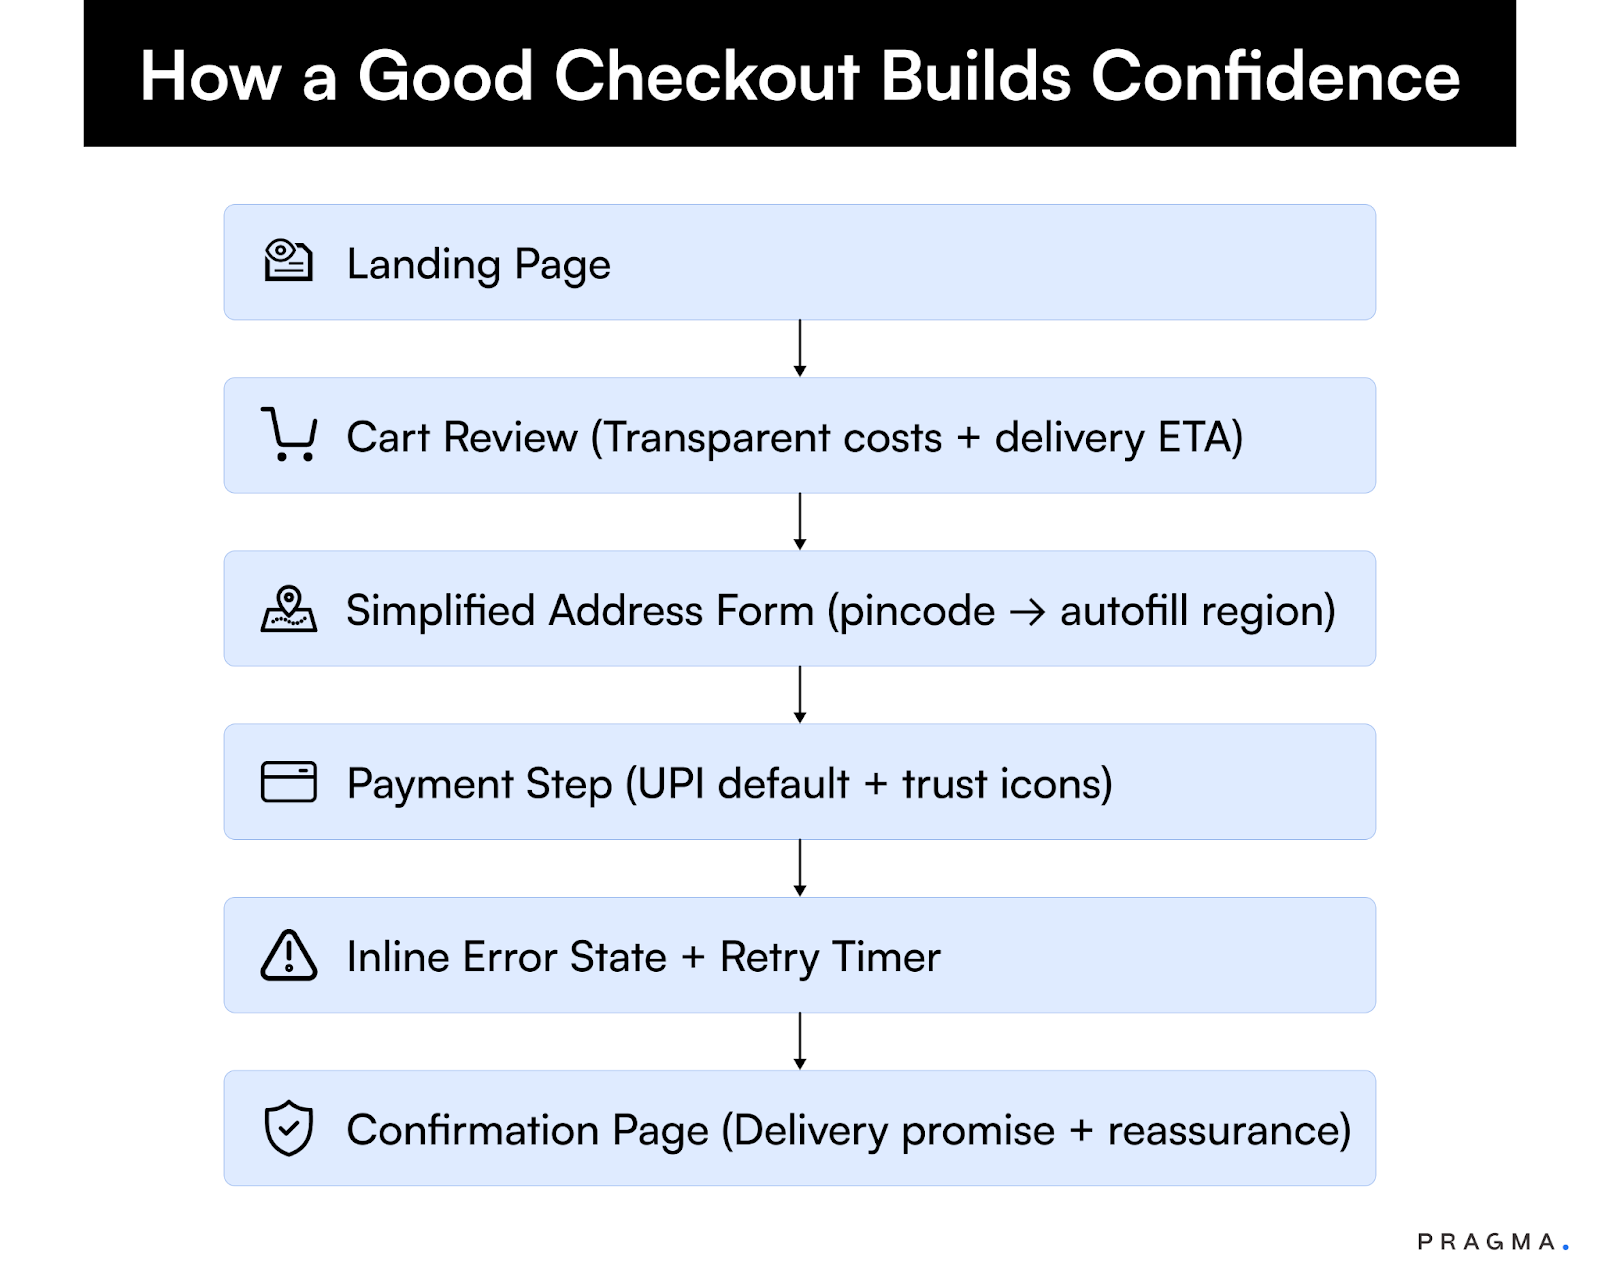
6) Latte-Art Perception & Checkout UX Perception
Latte art doesn’t change taste — but it changes delight. Checkout UX is the same: tiny details, big money.
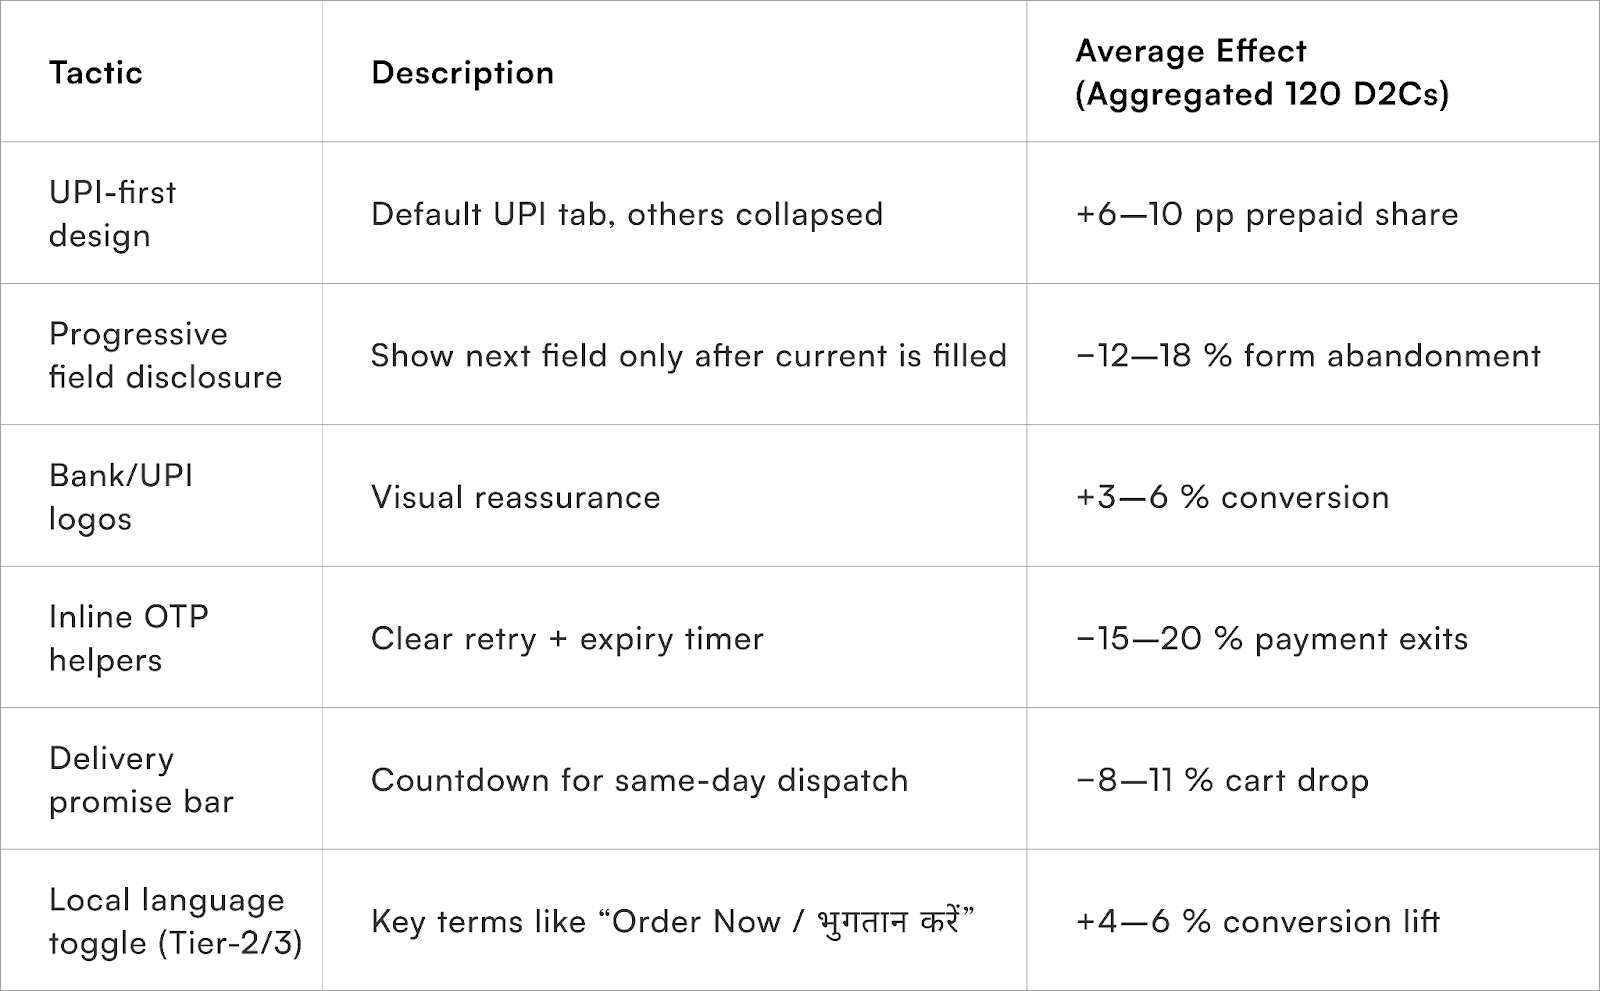
UX tweaks (India-first) and effect:
Micro-copy that works:
- “Pay by UPI (fastest)” beats “UPI”.
- “COD available in your area” after pincode check (not a blanket banner).
- “We’ll never auto-charge. You’re in control.” for BNPL/AutoPay tools.
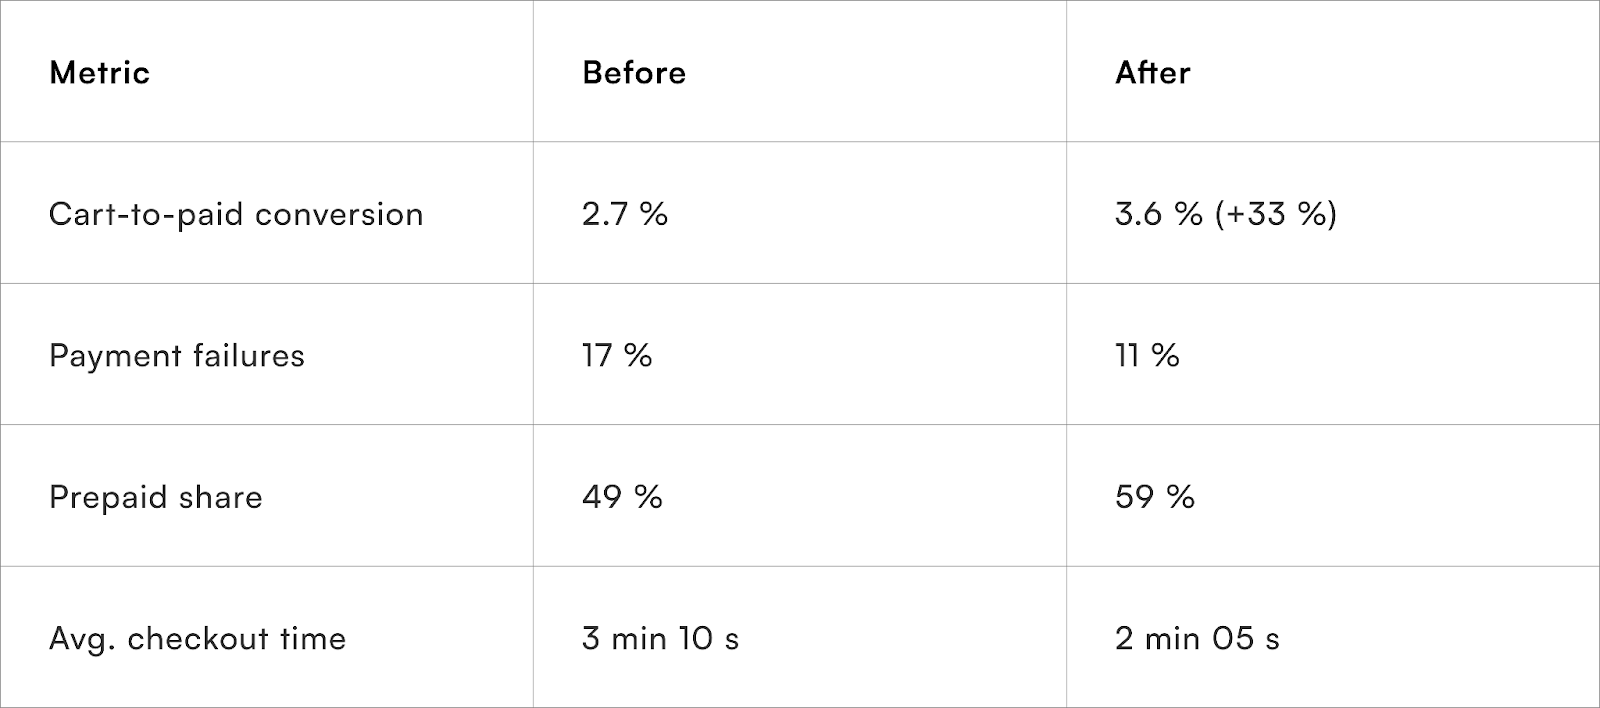
Example (beauty D2C, Tier-2 heavy):
Progressive forms + local bank logos lifted paid conversion +9.8%. Cart-to-paid time fell from 3m10s → 2m05s.
Why Checkout Perception Matters
Most Indian D2Cs underestimate how many users abandon not because they can’t pay — but because they don’t trust the page enough to continue.
According to Razorpay and CCAvenue data (FY25):
- 38–41 % of cart abandonments in India occur after payment method selection.
- Average cart-to-paid conversion in Tier-2/3 cities is 9–12 pp lower than in metros — despite identical offers.
The difference lies in micro-trust cues: the perceived safety, speed, and simplicity of the checkout flow.
The “Latte-Art Effect” in Digital UX
Every step here reduces cognitive load — measured not in milliseconds, but in micro-hesitations avoided.
Data Snapshot — Checkout UX Gains in India FY25
Example — Beauty D2C Brand (Tier-2 Heavy)
- Original checkout: generic form, 11 fields, COD prominent.
- Redesign: progressive disclosure, UPI default, COD shown post-pincode validation, regional language for CTA.
6-week outcomes
UX perception delivered hard metrics — not just aesthetics.
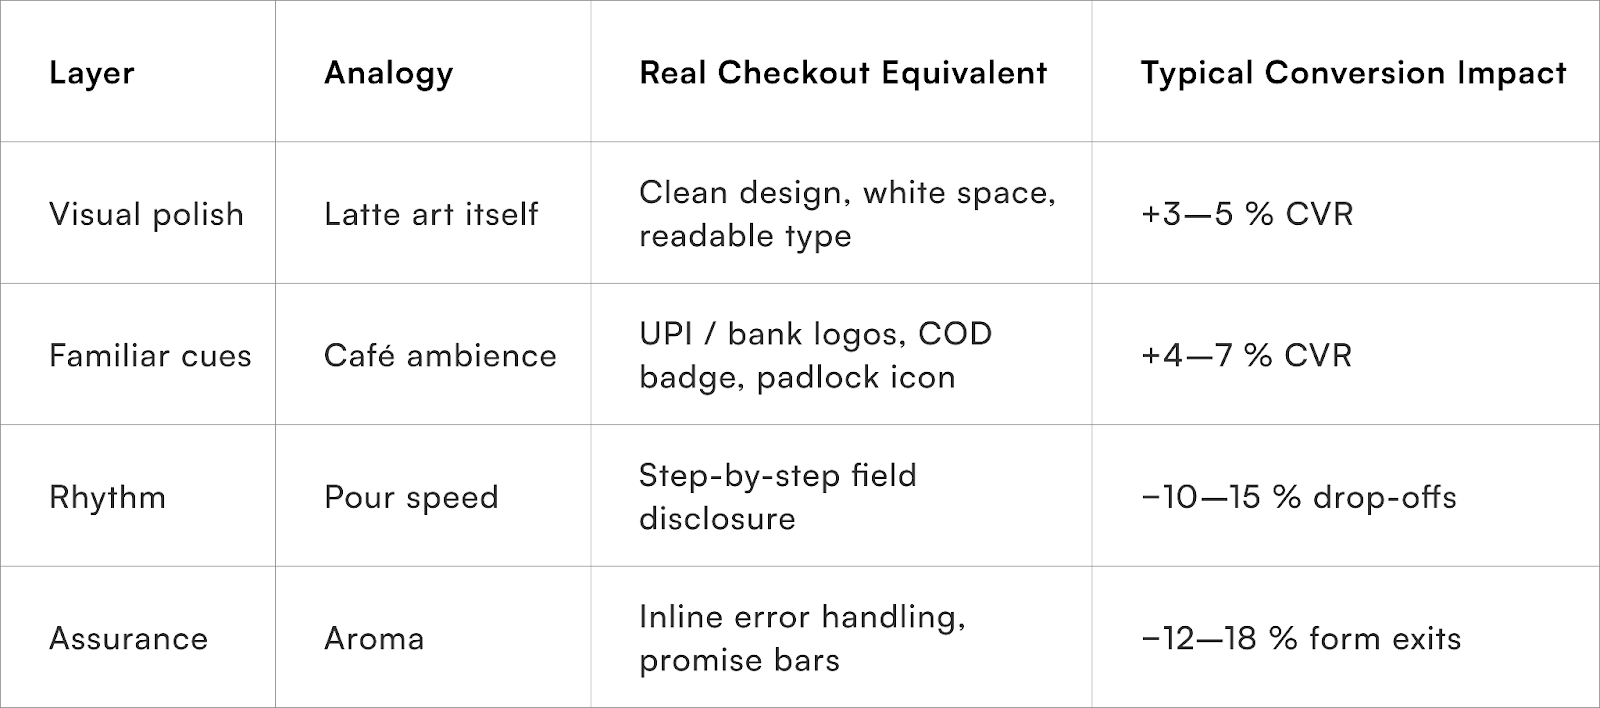
Design Framework — The Trust-Perception Pyramid
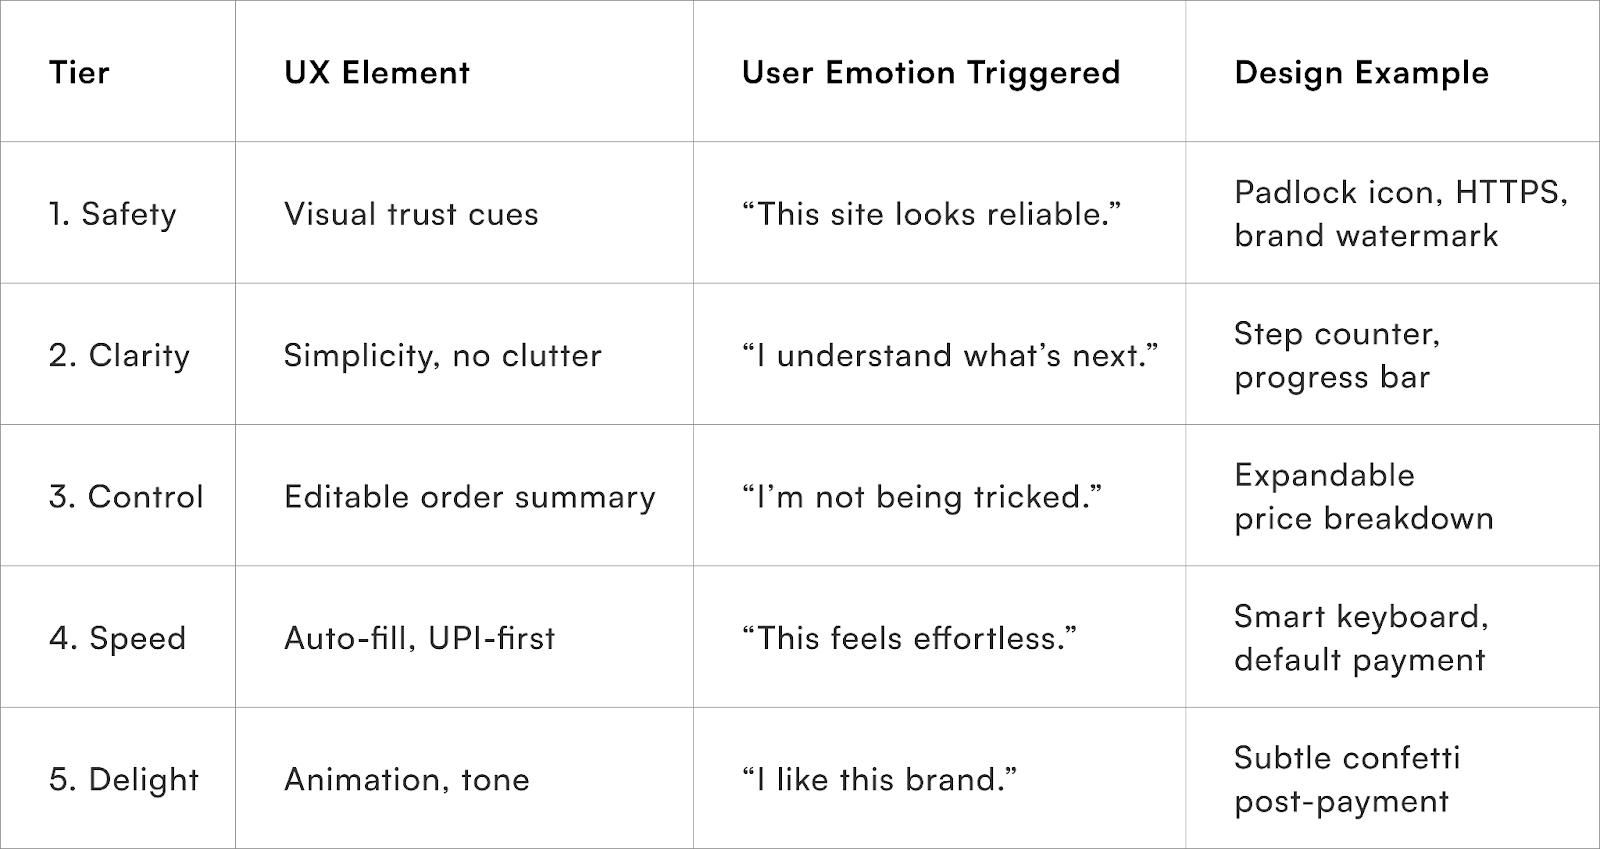
The goal isn’t to impress — it’s to reassure.
Indian UX Specificities
- Payment familiarity hierarchy: UPI > Wallet > Card > COD.
- Network volatility: design for retry, not refresh.
- Pincode culture: auto-fetch region & courier promise instantly.
- Trust deficit: visible brand consistency between ad and checkout.
In Tier-3 markets, latency > 2.5 s reduces conversion by ~18 %.
Even one field misalignment (“State” before “Pincode”) spikes drop-offs by 6–8 %.
Design literacy isn’t optional; it’s a revenue line item.
Micro-Copy That Converts
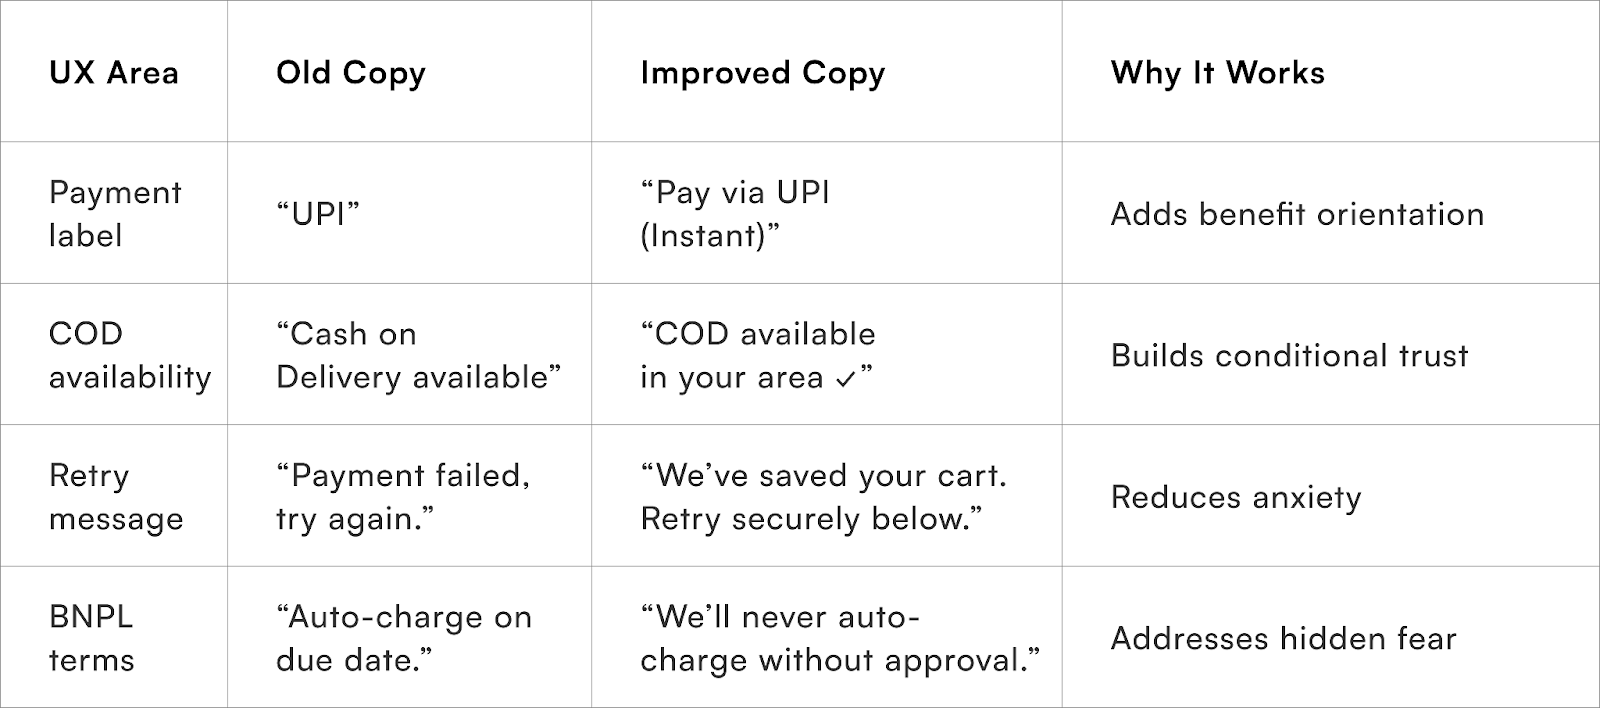
Good micro-copy isn’t creative writing; it’s transactional empathy.
Accessibility & Inclusivity Layer
India’s next 100 million online shoppers will come from non-metro, non-English regions.
Inclusive checkout UX should consider:
- Larger tap zones for low-dexterity devices.
- Font legibility on budget smartphones.
- Visual progress indicators for users with low digital literacy.
Accessibility isn’t altruism — it’s market expansion.
Operational Checklist — Checkout UX Review
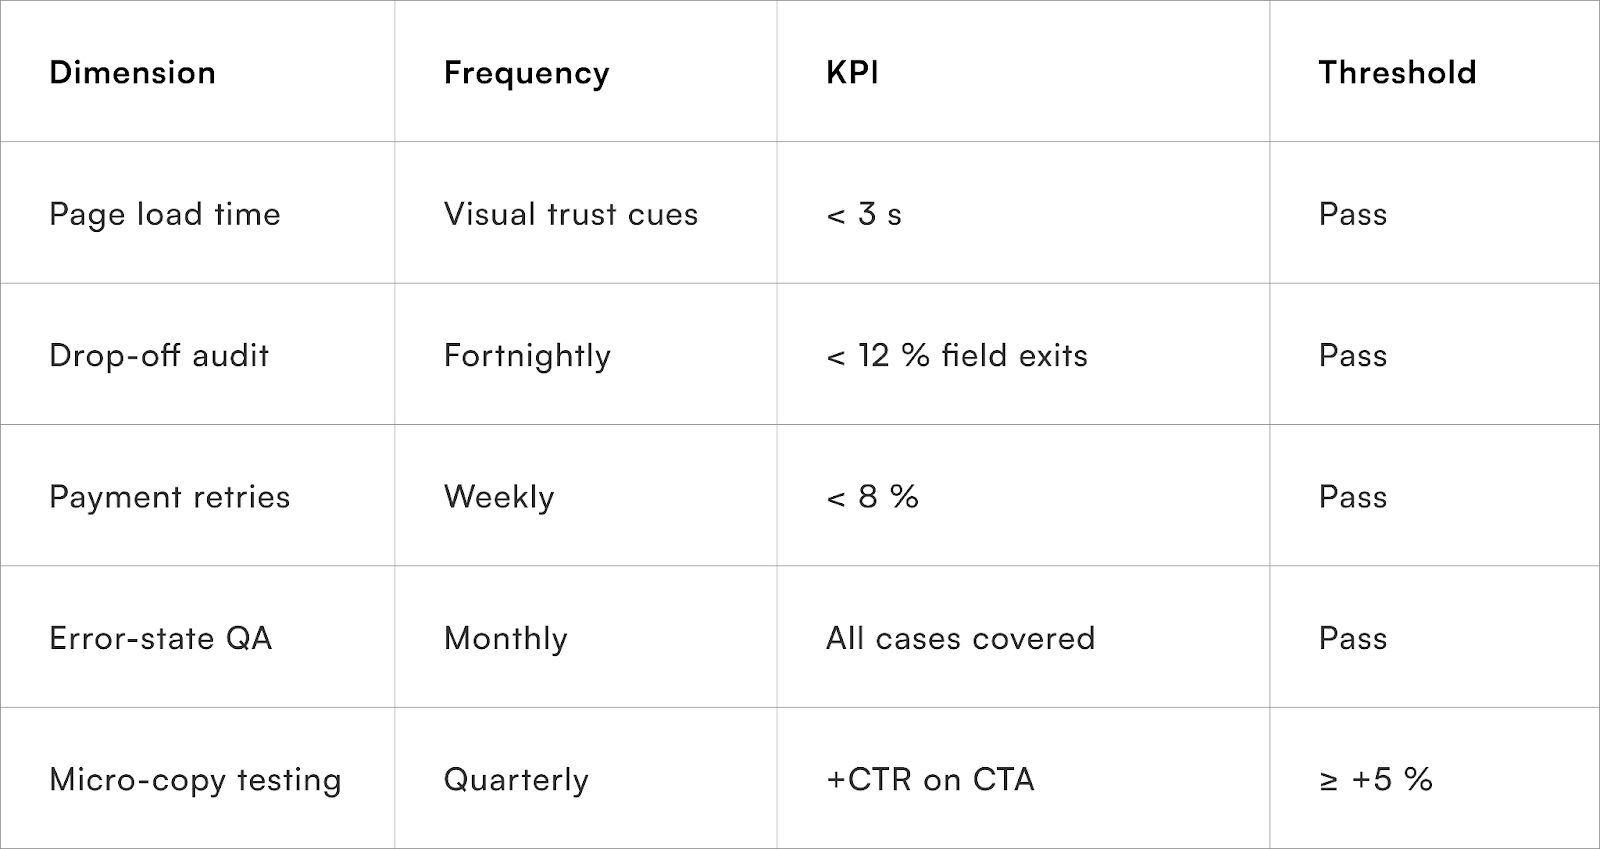
Like latte art, great checkout UX isn’t noticed — it’s felt.
It creates an invisible halo of competence that tells the buyer, “this brand knows what it’s doing.”
And in India’s D2C market, perception is not a bonus — it’s the conversion engine itself.
Because a clean pour tastes like trust.
7) Caffeine Crash → Customer Fatigue & Post-Purchase Burnout
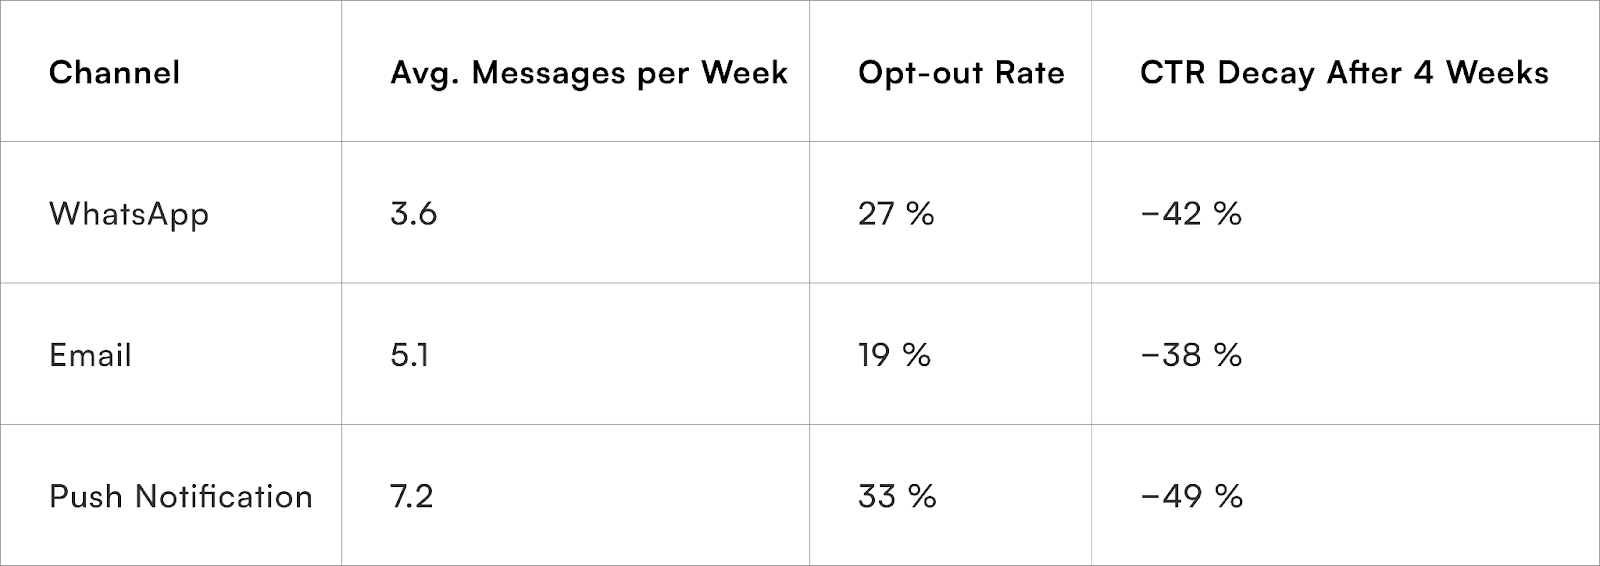
Too much coffee = jitters. Too many pings = churn.
D2Cs often crash customers’ goodwill with spammy notifications, irrelevant remarketing, or endless upsell pushes.
Managing fatigue with data:
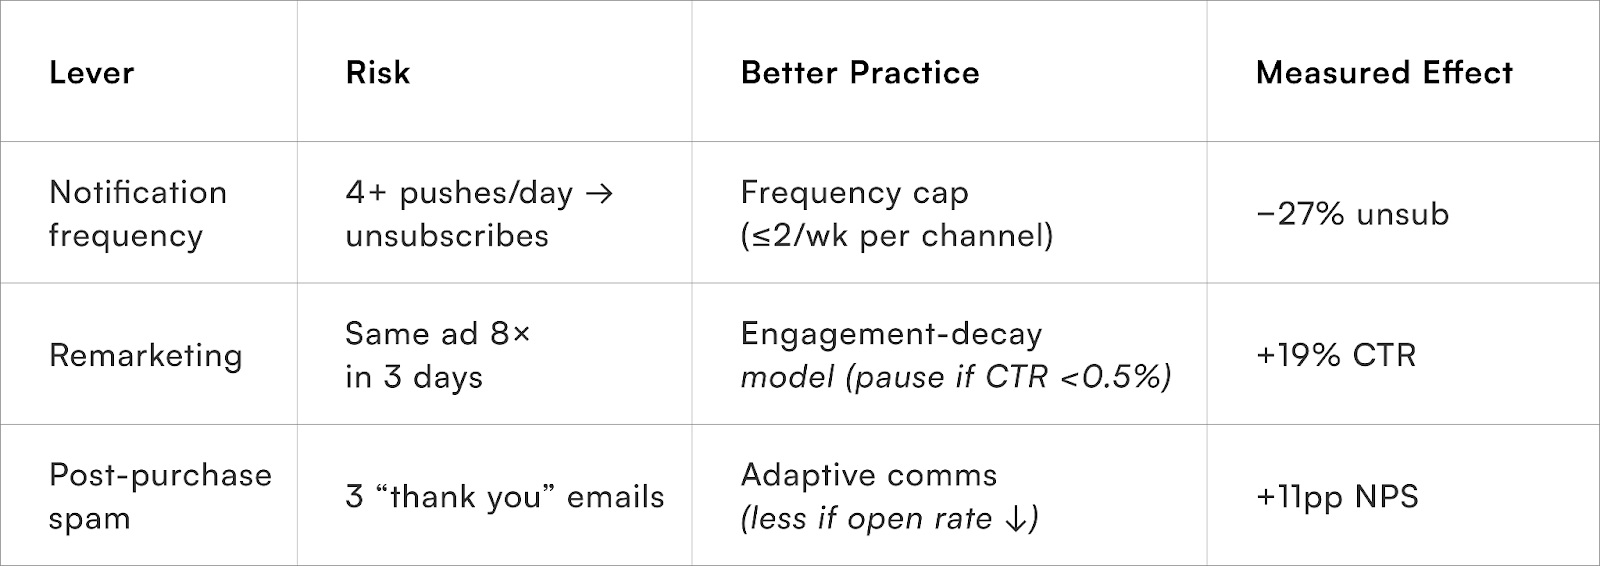
Example (personal care D2C):
WhatsApp reduced from 3/week → 1/week, personalised to buy history. CTR +19%, unsubscribes −27%.
The Fatigue Formula
A D2C brand’s engagement curve looks like a caffeine spike — fast lift, sudden crash.
Across 70+ Indian D2Cs analysed by Pragma’s ecosystem data partners (FY25):
The message is clear: volume ≠ engagement.
Customers tune out when frequency ignores relevance.
The Physiology of Fatigue
Just like caffeine tolerance builds up, message tolerance decays.
After ~8 unsolicited communications, open-rates collapse by half — regardless of offer.
Two key psychological triggers explain it:
- Predictability → same creative, subject, or tone.
- Perceived manipulation → “They only talk when they want me to spend.”
Relevance resets tolerance. Repetition kills it.
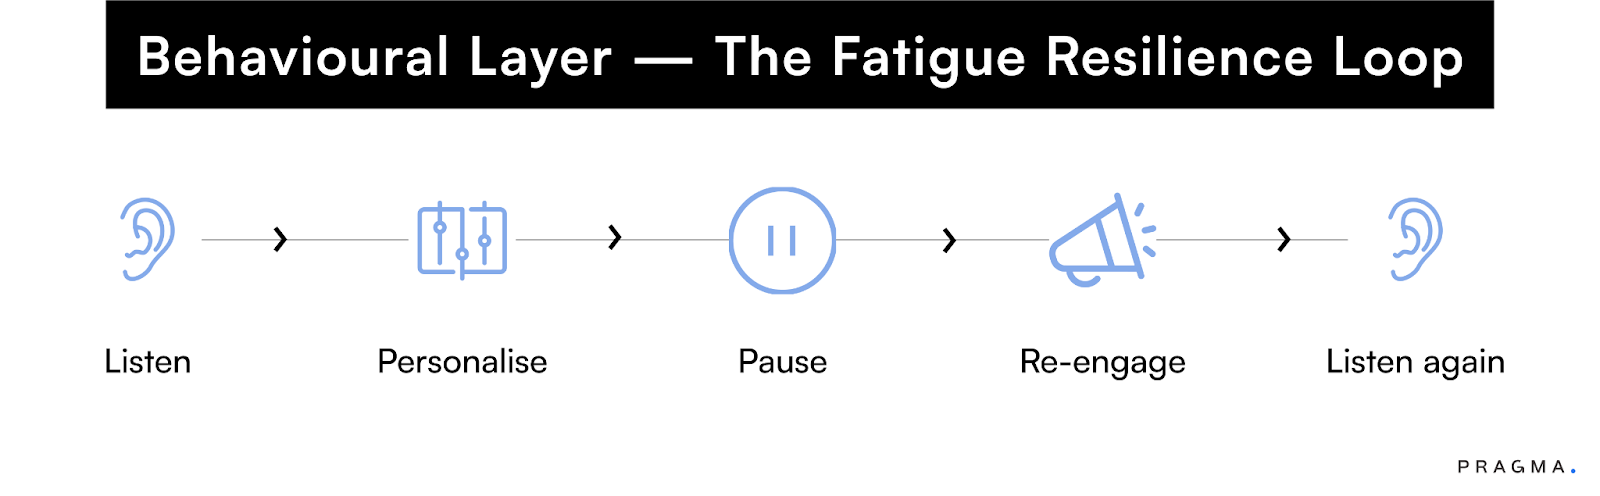
Framework: The Engagement Metabolism Model
A calm retention system mirrors this metabolism: push when energy is low, rest when recovery is due.
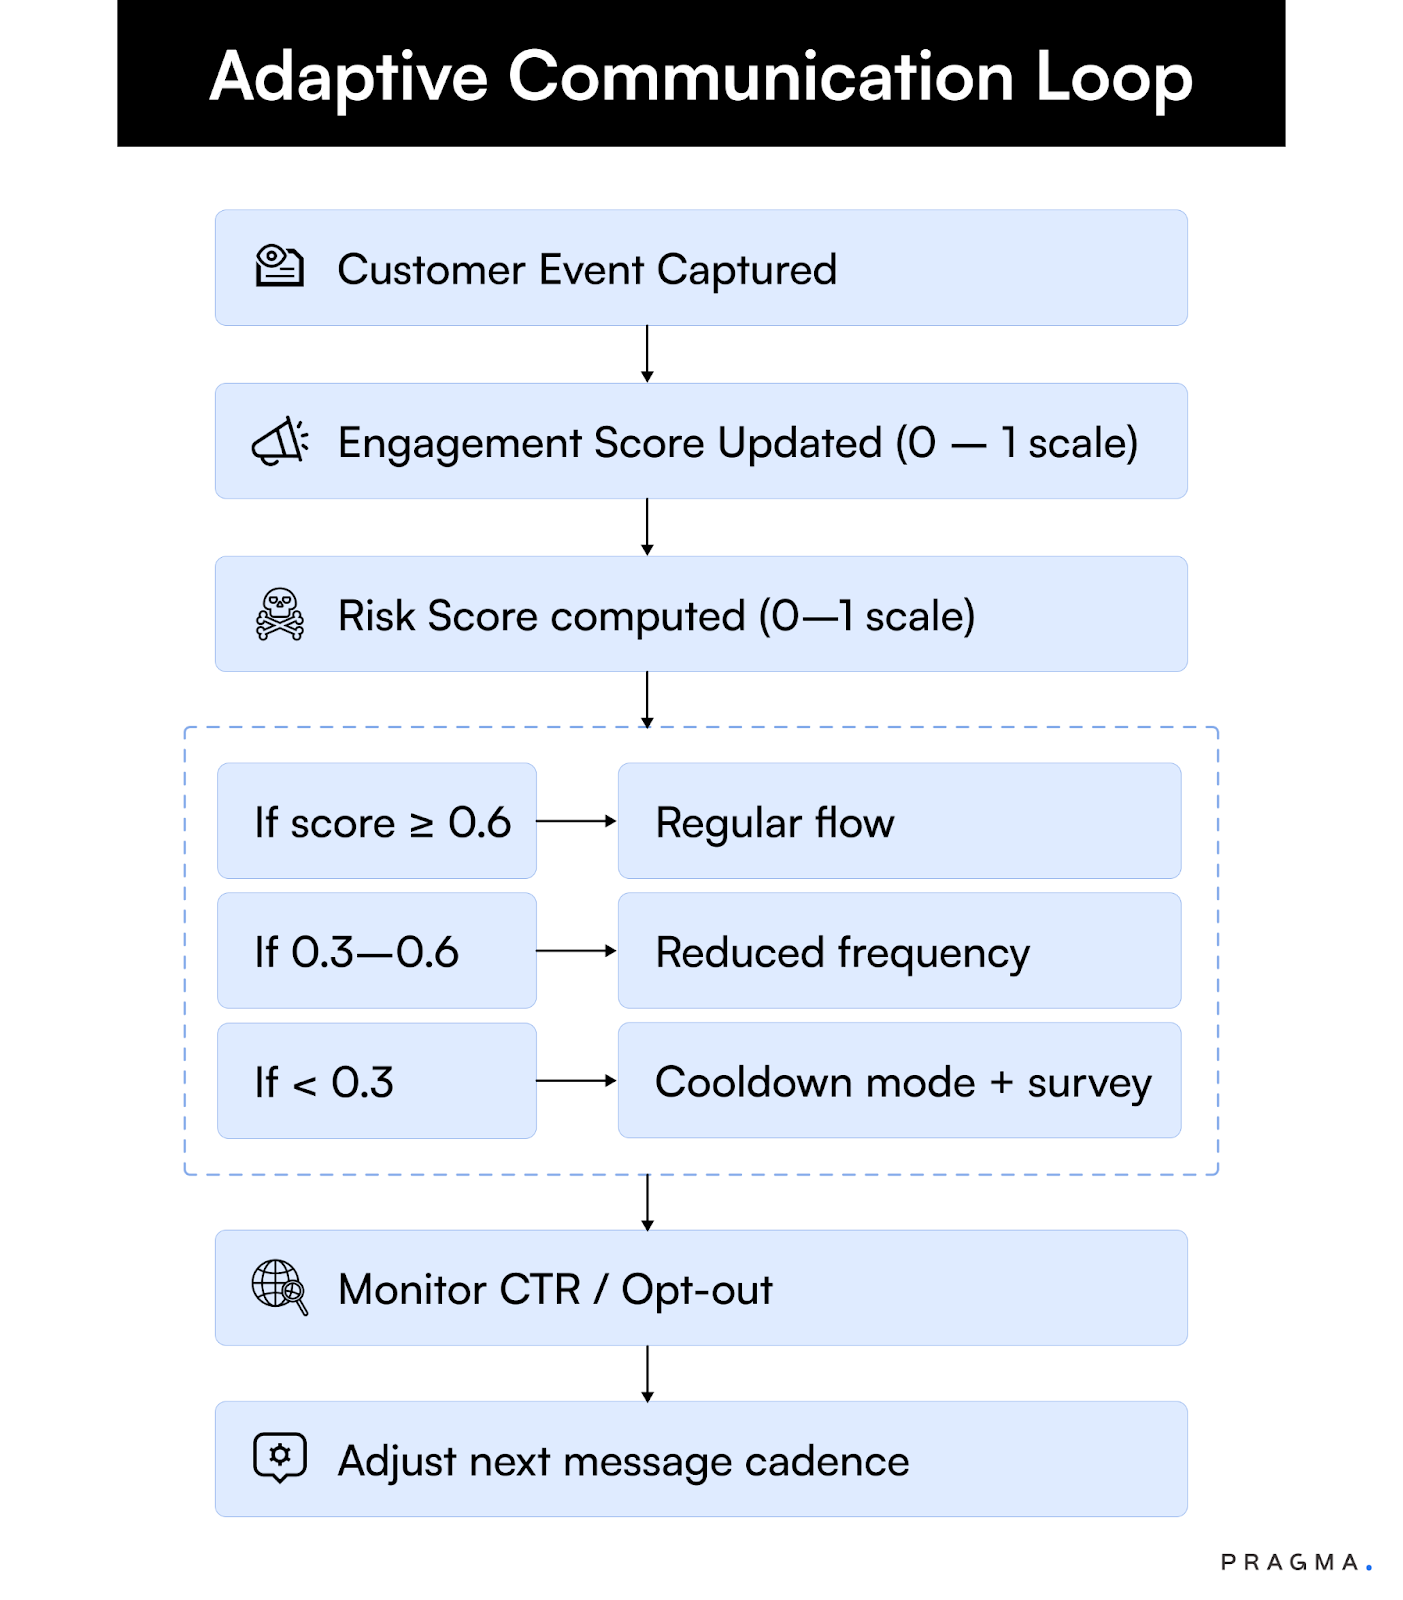
Systems that listen before they talk compound retention — not fatigue.
Example — Personal Care D2C (India Tier-2 heavy)
Before:
- 3 WhatsApp broadcasts / week
- 2 emails / week
- CTR 0.9 %, Unsub rate 27 %
After Adaptive Flow:
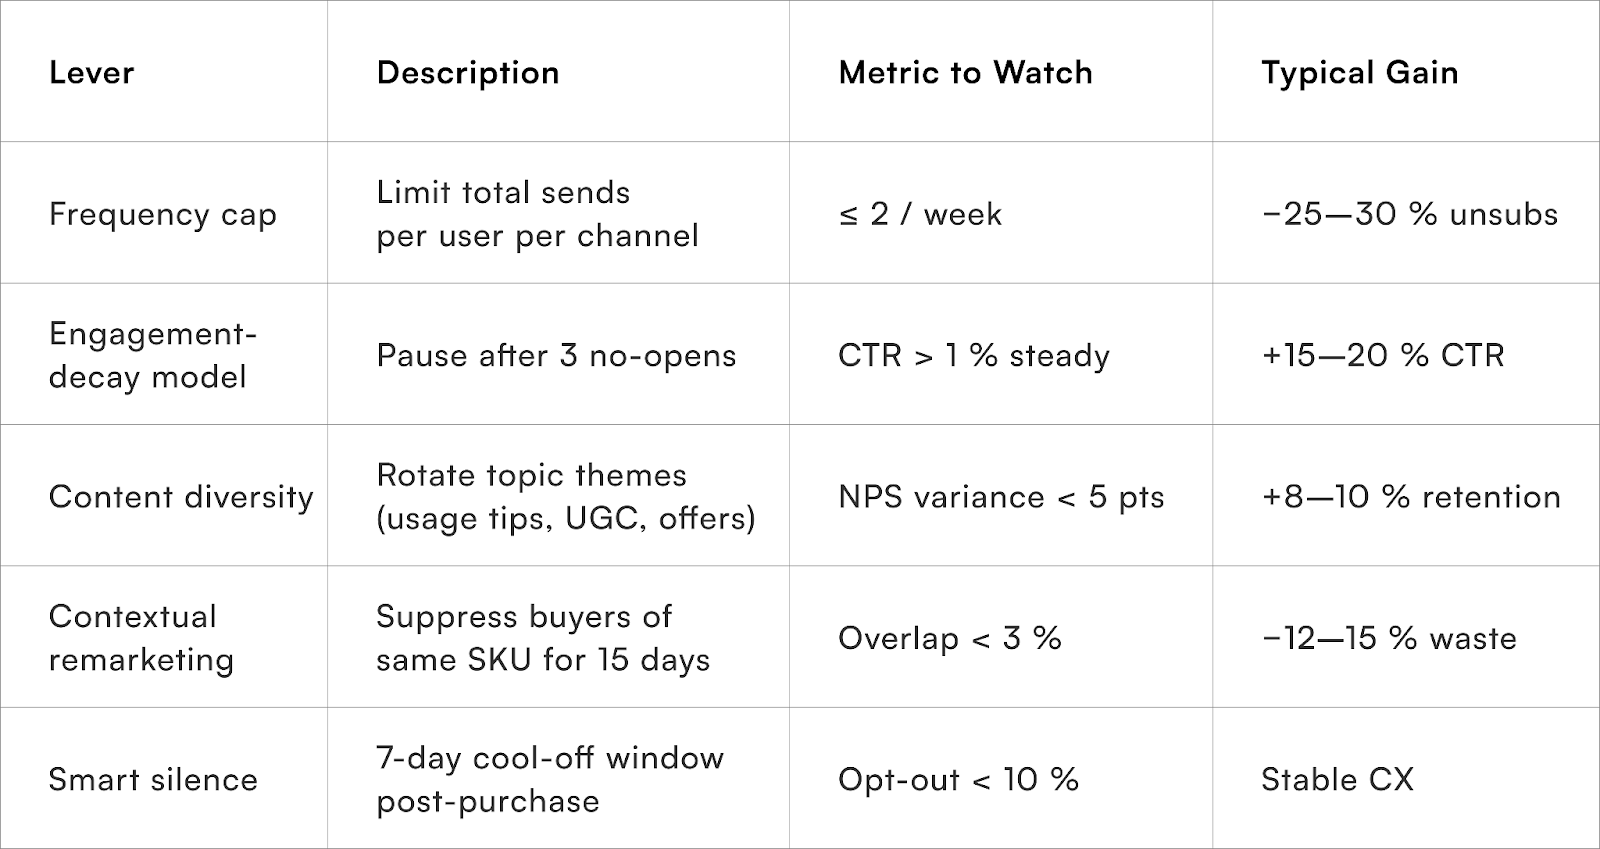
- Frequency cap (1 per week per channel)
- Pause if open rate < 0.5 % for 2 weeks
- Re-entry only after new SKU or offer tier
8-week impact:
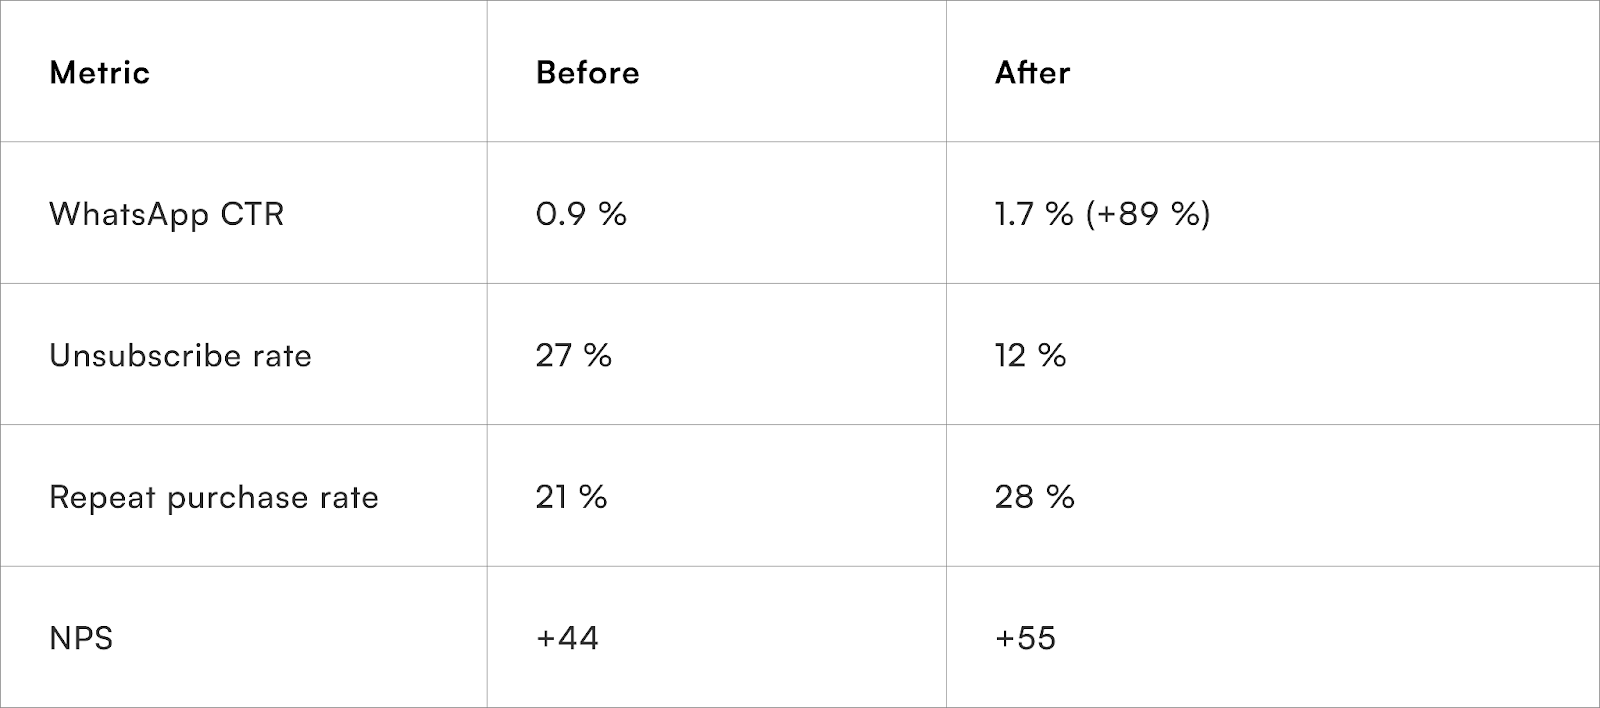
Retention regained its rhythm by letting silence do part of the work.
Operational Levers for Reducing Fatigue
The Fatigue Analytics Dashboard
A “fatigue score” derived from these indicators helps marketing and CX teams coordinate pauses across channels.
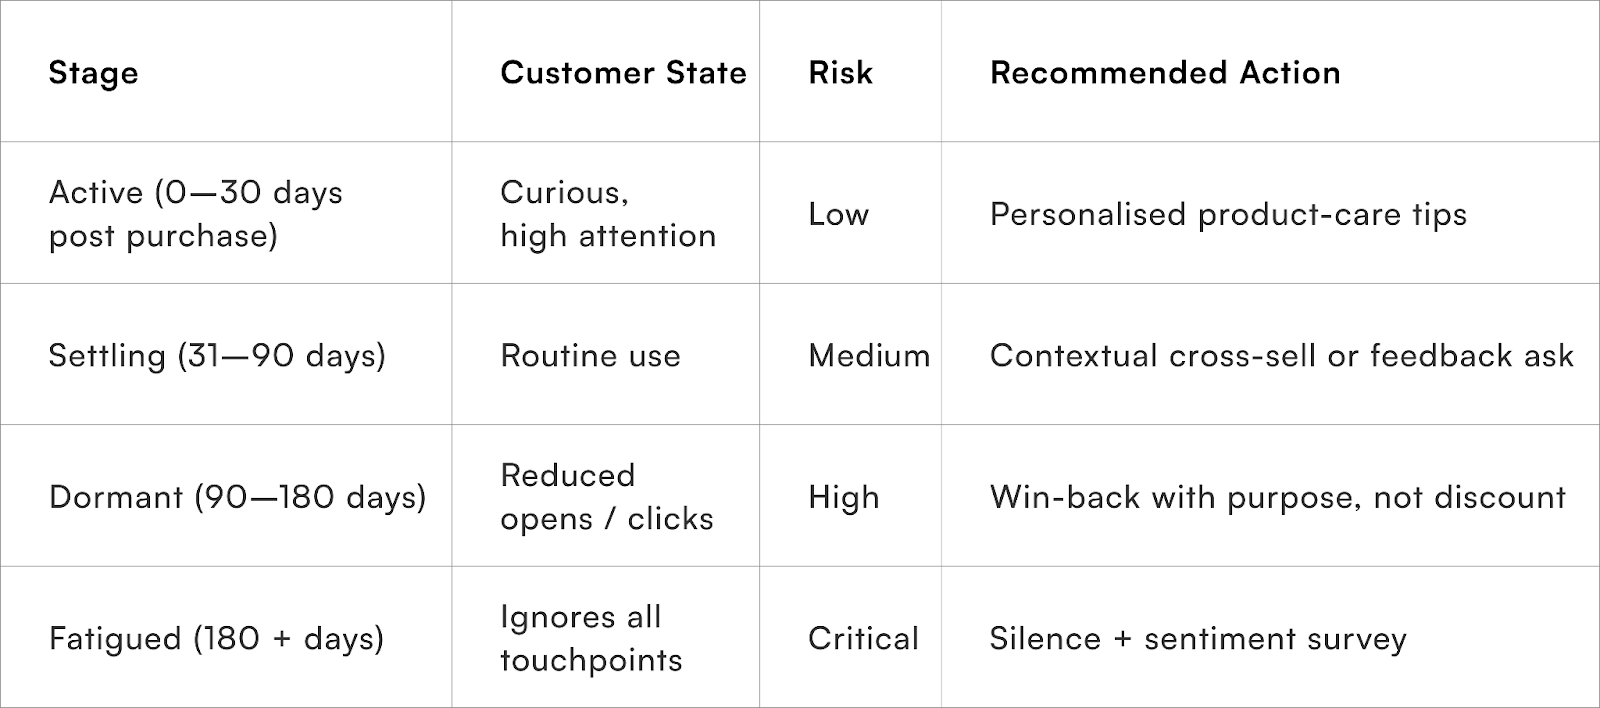
Post-Purchase Calm: Designing for Trust After Checkout
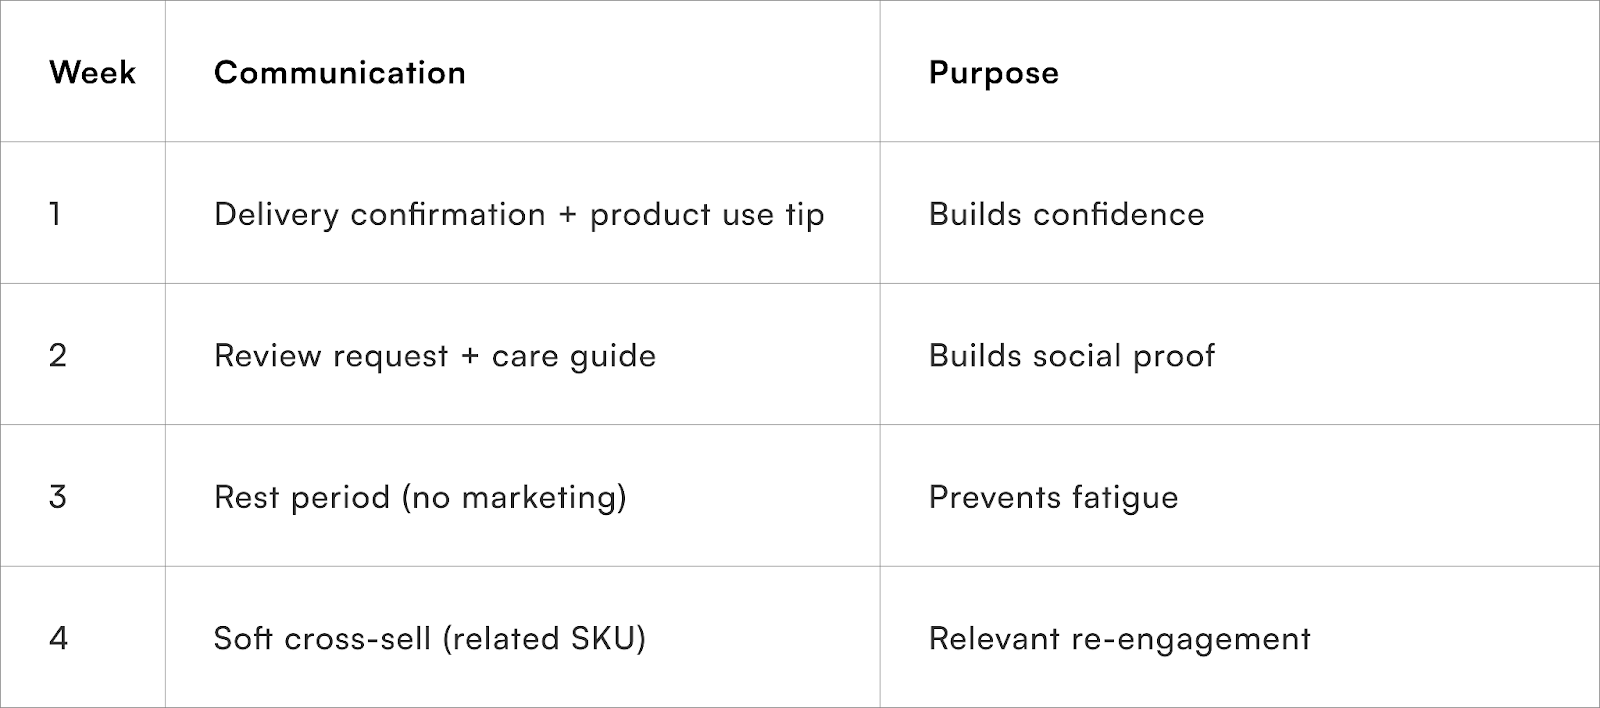
Once the order is delivered, the customer should enter a “cool-down journey”, not another funnel.
A predictable rhythm signals maturity — “we’re not desperate for your attention; we value your comfort.”
The Economics of Calm Retention
- Reducing notification frequency by 40 % often cuts CRM spend by 15–20 %.
- Brands with adaptive cadence models see 1.3–1.5× better LTV/CAC ratios.
- Silence windows lower CX tickets (~ “Too many messages” complaints) by 25 %.
Silence, measured correctly, has ROI.
When to Re-ignite Communication
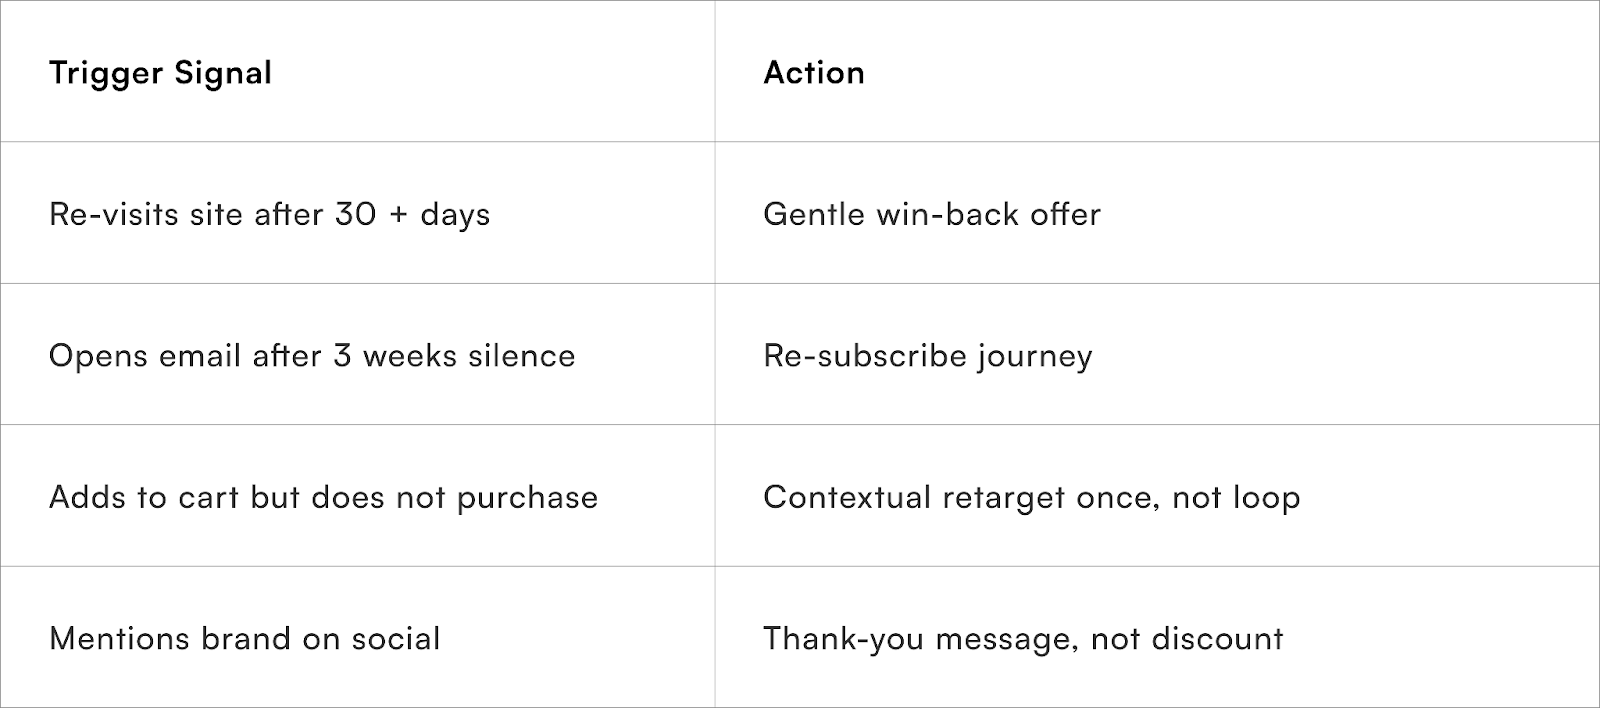
Engagement must feel personal, not persistent.
Every pause is a form of respect.
And respect is retention.
Customer fatigue isn’t a marketing problem — it’s an empathy problem disguised as metrics.
Great D2Cs understand that loyalty is not earned by frequency, but by consideration.
A well-timed silence brews more trust than ten noisy offers.
Because every brand has a choice: add caffeine for a spike, or let the brew rest for depth.
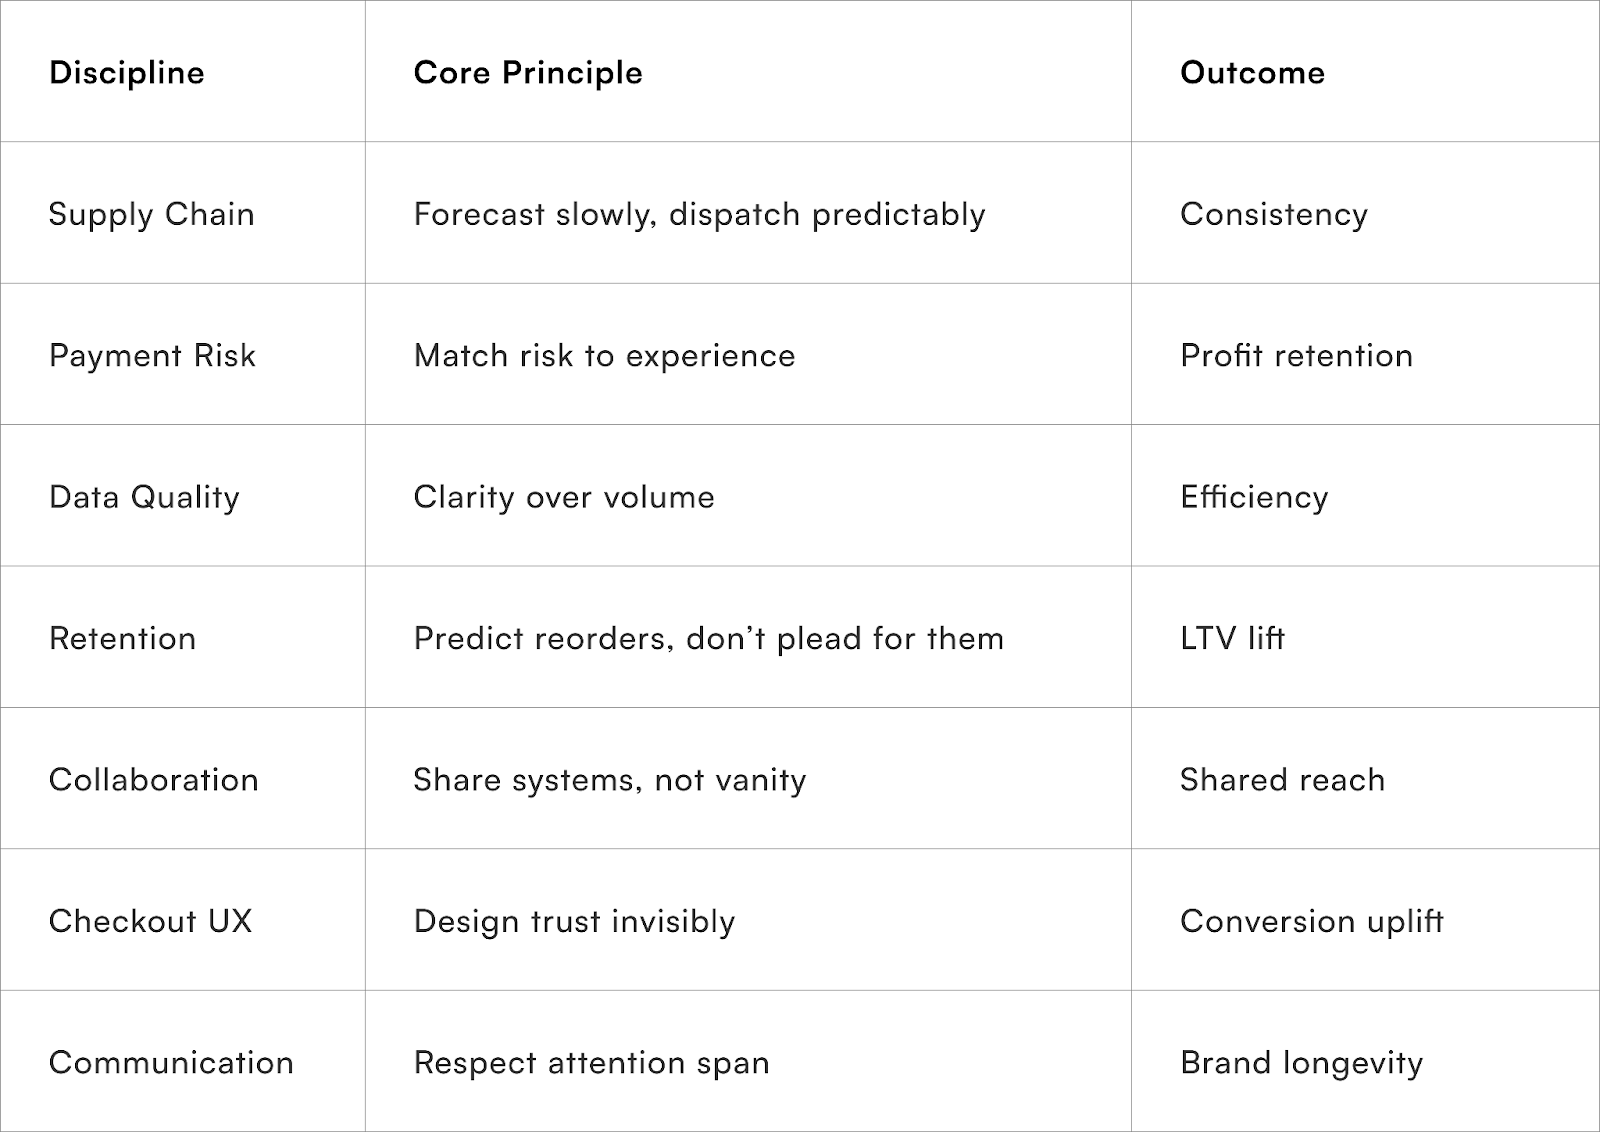
Quick Brew Cards (copy-paste into your playbook)

1. Supply Chain → Forecast per SKU per FC; reallocate weekly; publish honest ETAs.
2. COD Risk → OTP-gate medium risk; hide COD for high; nudge prepaid with small credits.
3. Data Filtering → Dedupe payments & carts; block bots; enforce canonical UTMs.
4. Retention → Predict next-order day; nudge at t − 3; 1-tap reorder; allow pause/skip.
5. Cross-sell → Co-owned SKU; virtual stock pool; unified checkout; one CX owner.
6. Checkout UX → UPI default; progressive forms; OTP helper; trust logos; promise bar.
7. Customer Fatigue → Frequency caps; engagement-decay models; adaptive comms.
The Closing Sip — Precision Beats Chaos
Strong coffee isn’t always good coffee. Strong tactics aren’t always good strategy. Indian D2C wins come from calm systems, clear data, smart risk, and small UX details that compound.
From Pragma’s side, we help you brew at scale — without losing flavour — across checkout, returns, RTO reduction, retention, and the plumbing in between.
Brewing Systems, Not Campaigns
Every lesson we’ve unpacked — from cold-brew patience to predictive subscriptions — leads to one quiet truth: brands don’t scale through intensity; they scale through precision.
In India’s D2C ecosystem, chaos is a constant. Courier networks fluctuate, consumer moods swing by festival, and performance platforms shift weekly. The only variable a brand can control is its system quality — the smoothness with which forecasting, checkout, payment, and retention talk to each other.
That’s the true difference between a busy brand and a calm one.
Busy brands chase conversion spikes; calm ones engineer repeatability.
The “Calm Commerce” Model — Indian D2C’s Next Phase
Together, they form an operational brew where every process tempers another — steadying growth into something sustainable.
Precision at Scale: What Indian D2C Brands Are Getting Right
- Micro-forecasting per pin cluster reduces logistics cost variance by 12–18 %.
- Risk-tiered COD gating cuts RTO by 20–35 % while keeping top-line stable.
- Filtered event tracking improves ad ROI 1.4–1.7× without extra spend.
- Predictive subscription loops increase repeat frequency 20–25 %.
- UX micro-interactions lift conversion 9–11 % in Tier-2-heavy traffic.
- Adaptive retention cadence doubles CTR and halves unsubscribes within 8 weeks.
Every metric above isn’t just growth — it’s stability disguised as growth.
☕ Bonus Caffeine
In Italy, there’s a tradition called caffè sospeso — “suspended coffee”. You buy one cup for yourself and one for a stranger.
Imagine if Indian D2Cs adopted something similar?
Prepaid credits as a surprise drop to “regulars at risk”. They convert at 2–3× average on the next visit — and remember who bought their coffee.
Basically: Prepaid credits → future sales → stronger communities.
Because the best brews aren’t just shared, they’re paid forward.
That’s the International Coffee Day 2025 edition of D2C Caffeine.
Want to check out our 2024 edition? 👉 Click Here
.gif)
Talk to our experts for a customised solution that can maximise your sales funnel
Book a demo

.png)