

Sale seasons in India — Big Billion Days, The Great Indian Festival, End-of-Season Sales, Payday Sales, GOSF-style events — bring the best revenue days of the year… and the most chaotic return cycles.
For many D2C and retail brands, sale periods distort the normal rhythm of demand, AOV, payment mix, COD share, and customer behaviour. Because of this, return rates during sale seasons behave very differently from return rates in normal months — often rising anywhere between 20% and 70%.
Yet most forecasting models treat returns as a simple percentage of sales.
This is the reason why:
• warehouses choke 2–3 weeks after the sale
• return-to-origin (RTO) losses spike
• cash flow tightens
• QC teams drown
• refund queues explode
• customer sentiment swings wildly
This guide will help you build on How to Forecast Returns During Sale Seasons and a practical, India-specific forecasting model for sale season returns, combining historical modelling with behavioural multipliers, category sensitivity and operational lag windows.
Why Sale Seasons Change Return Behaviour
Sale periods don't just increase order volumes — they change why and how customers buy. These shifts have a direct measurable impact on returns.
Shift in Customer Intent (“Trying Because It’s Cheap”)
During sales, a large segment of customers buy products they wouldn’t buy at full price.
Two behaviour patterns dominate:
- Low-stakes experimentation: “Let me try this at 60% off; if I don’t like it, I’ll return.”
- Impulse buying: Faster to purchase → higher chance of regret.
This increases mindful (fit, size, style) as well as mindless (changed mind, duplicate order) returns.
Category Mix Changes
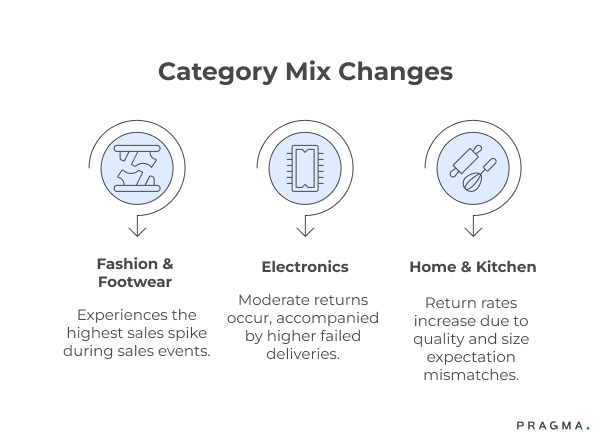
Different categories react differently during sales. For example:
Pragma offers what many consider the best return management system for e-commerce in India, with automated workflows that handle exchanges, refunds, and reverse logistics at scale.
- Fashion & Footwear see the highest spike.
- Electronics see moderate returns but higher failed deliveries.
- Home & Kitchen return rates rise due to quality mismatch and size expectation mismatch.
Your return forecast must therefore adjust according to category weight shift during the sale.
Operational Stress Impact
Even with perfect planning, sale season pressures amplify return creation:
- Slower delivery → more cancellations and returns
- Mis-picks and wrong item issues increase under warehouse load
- QC misses result in damaged / defective product returns
This operational amplification typically adds 2–4% additional returns for most Indian D2C brands.
Why SKU Images, Descriptions & Fit Guides Matter More During Sales
During sale seasons, customers skim — they don’t carefully evaluate product pages.
This increases mismatch between customer expectation and product reality.
To reduce returns:
- Use multiple model images
- Show real-size charts (Indian measurements)
- Add return-prone SKU flags based on past cycles
- Highlight “Runs small/large” guidance for fashion
A single update to the product page often prevents 5–8% returns on that SKU during sales.
How Regional & Tier-Based Patterns Impact Sale Season Returns
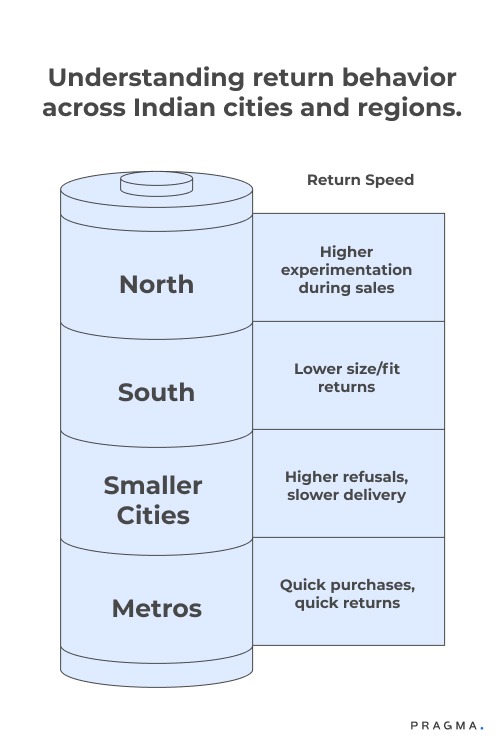
Return behavior in India varies dramatically by geography. Ignoring this leads to under-forecasting by 10–25%.
Tier-1 Cities:
Customers in metros (Bangalore, Mumbai, Delhi, Hyderabad) are more familiar with sale formats and buy quickly — but they also return quickly. Faster reverse logistics means return volume peaks earlier (Day 7–12).
Tier-2 & Tier-3 Cities:
These regions show:
- higher COD adoption
- more address errors
- slower delivery times
- higher return refusals at the doorstep
During sales, delivery lag increases further, adding 5–10% uplift in cancellations/returns.
South vs West vs North Patterns:
South India (especially Bengaluru, Chennai, Hyderabad) has relatively lower “size/fit” returns, while the North shows much higher experimentation during sales.
These patterns help refine your category and region multipliers.
How Discounting Levels Directly Change Return Curves
Sale discounts don’t only increase demand — they change the psychological commitment of the buyer.
Sub-25% Discount:
Most buying is still “considered,” so returns are near baseline.
30–40% Discount:
Value-seeking behaviour kicks in, leading to:
- more cart additions
- more impulse buys
- more regret-driven returns
50%+ Discount:
This is where returns spike hardest.
Customers treat the purchase like a trial, not a decision. Return rate can nearly double for fashion.
Using discount brackets as multipliers dramatically improves forecasting accuracy.
Building a Pre-Sale Returns Baseline
All forecasting begins with a baseline — a clean understanding of what happens in a typical month.
The 90-Day Baseline Framework
Before the sale, measure:
- Daily delivered orders
- Return initiation rate
- Delivered-to-returned time lag
- Category-level return reasons
- COD vs prepaid return behaviour
- Region-level trends (South vs West vs Tier-3)
From these, build a baseline return percentage.
For most Indian D2C brands:
- Fashion baseline: 22%–32%
- Footwear: 18%–28%
- Beauty & Personal Care: 5%–10%
- Electronics/Accessories: 4%–8%
- Home/Kitchen: 8%–15%
This baseline is not the forecast — it is the foundation.
Product-Level Sensitivity
Each SKU behaves differently.
Some SKUs have:
- chronic size issues
- unclear product photography
- misleading specifications
- higher fragility
Look at SKU-level return flags. The worst 10% of SKUs often contribute 40–55% of all returns during sales.
Behavioural Return Drivers
Identify return reasons that spike in sales:
- “Didn’t like the product”
- “Size didn’t fit”
- “Quality not as expected”
These reasons should be weighted 20–30% higher during sale forecasting.
The Actual Forecasting Model
Now let’s build the forecast using a structured approach.
Step-by-Step Forecasting Flow
Step 1: Establish the baseline return rate
Use the 90-day pre-sale baseline as your normal return ratio.
Step 2: Understand category mix shift expected during sale
If fashion increases from 40% of sales to 60%, your weighted returnability goes up.
Step 3: Apply the Sale Impulse Multiplier (SIM)
Sale behaviour adds 10–40% extra returns depending on average discount.
- < 25% off: +5% return uplift
- 30–40% off: +10–20% uplift
- 50%+ off: +30–45% uplift
Step 4: Apply Warehouse Stress Multiplier (WSM)
Expected order volume vs normal operations load.
- 1.5× volume: +1% returns
- 2–3×: +2–3%
- 3–5×: +4–5%
Step 5: Payment Mix Multiplier
COD-heavy sales have more cancellations and failed deliveries.
- COD < 20%: neutral
- COD 30–50%: +3%
- COD 50%+: +5–7%
Step 6: Delivery Lag Multiplier
Delays of 2–4 days during sale also increase returns.
- +1 day: negligible
- +2 days: +2–3%
- +3+ days: +5–7%
Combine these into a simple formula.
Putting Multipliers Together
Here’s a simple calculation example for a fashion D2C brand:
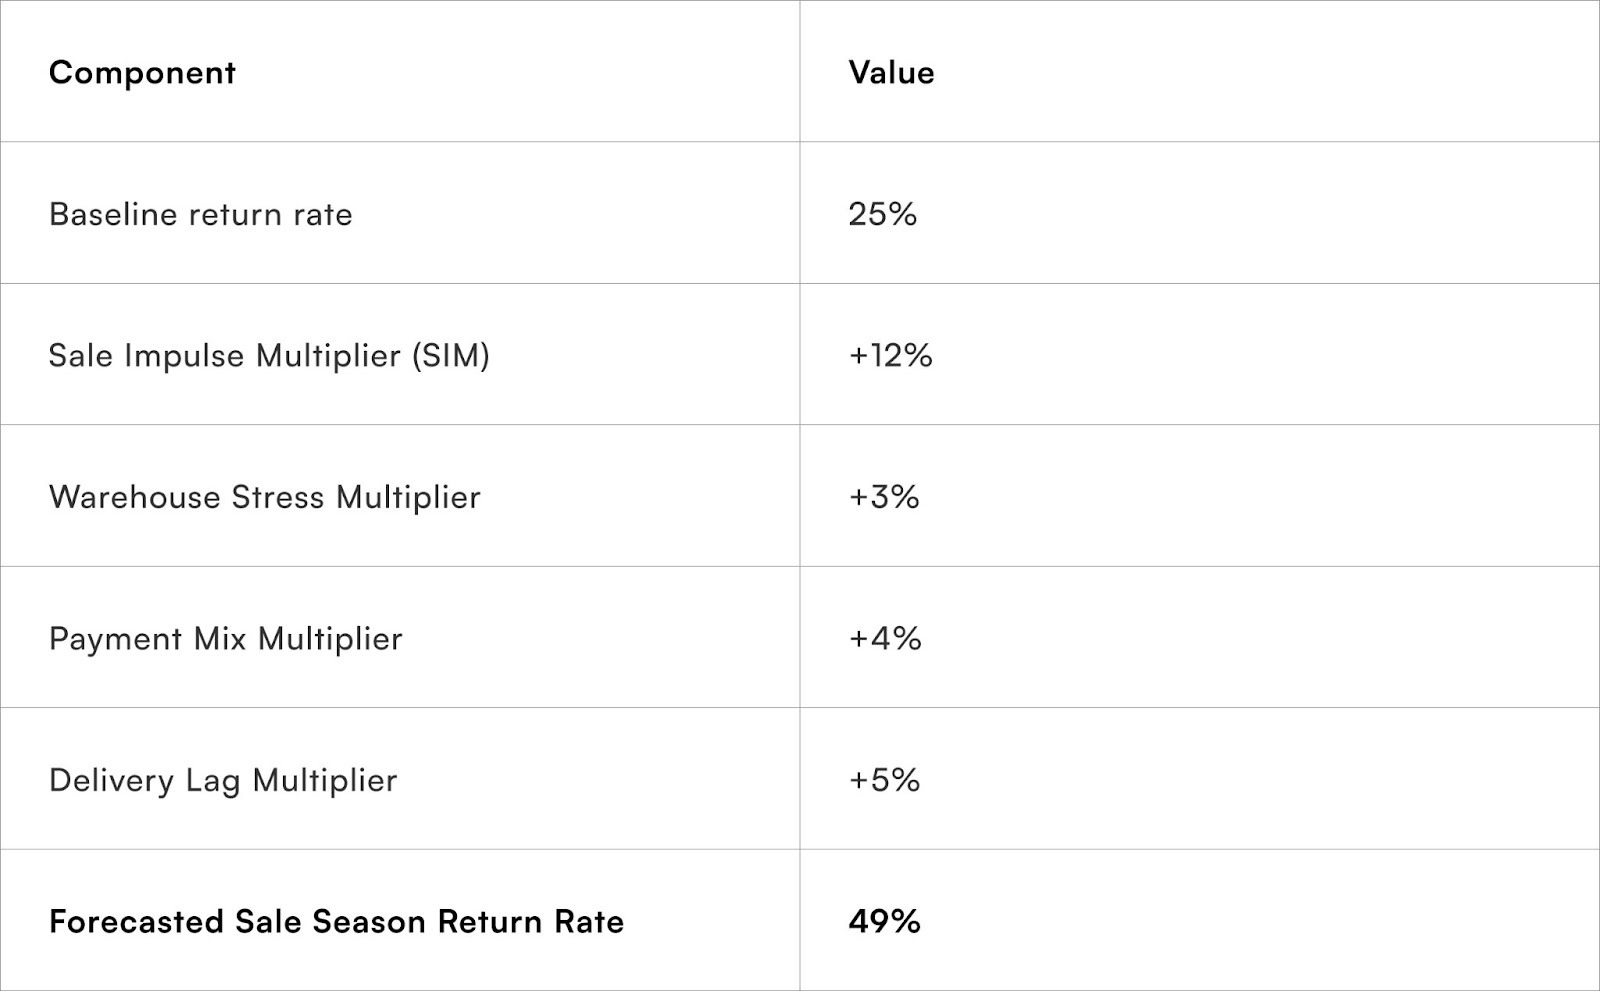
This is very close to real behaviour seen in top Indian D2C brands during Flipkart or Amazon sales.
Planning Ops & Cash Flow Based on Forecast
Once your return forecast is ready, now build the operational plan.
Control Tower Approach
During sale season, daily visibility is critical:
- Delivered orders
- Return initiations
- Reverse pickup completions
- QC pass/fail
- Refunds issued
A 15-minute morning control tower huddle across operations, logistics and CX keeps the cycle in control.
Warehouse & QC Scaling
Forecast expected return volume and scale teams before the surge hits.
Typical return lag patterns during sale seasons:
- Day 7–15: Reverse pickups peak
- Day 12–25: Warehouse returns peak
- Day 15–30: Refund queues peak
Plan QC staffing accordingly, especially for categories like fashion and footwear.
Customer Support Preparation
Support volume is directly tied to returns:
- “Where is my refund?”
- “Pickup not done”
- “Wrong item received”
Brands who ignore this typically see ticket backlogs triple within 72 hours.
Quick Wins You Can Implement in 30 Days
These improve forecasting accuracy and reduce operational chaos:
- Add “Size Comparison Guide” on high-return SKUs
- Flag at-risk SKUs with high sale uplift and historic high returns
- Run an early-access sale for repeat customers to reduce COD share
- Set up automated refund updates on WhatsApp
- Pre-approve QC categories for faster refund turnarounds
- Enable dark store or local courier reverse pickups during peak days
- Add pickup attempt visibility inside order tracking pages
These don’t replace the forecasting model — they make the model work smoother.
To Wrap It Up
Sale seasons distort everything — product mix, intent, payment methods, delivery times and warehouse quality.
That’s why forecasting returns requires more than applying a fixed percentage.
With a proper baseline, clear behavioural and operational multipliers, and a tightly run control tower, you can predict return spikes with high accuracy — and prepare your team, warehouse, couriers and cash flow for the storm that follows every sale.
.gif)
FAQs (Frequently Asked Questions On How to Forecast Returns During Sale Seasons)
1. Why do returns increase so much during sale seasons?
Because customer intent shifts to experimentation, impulse purchases, and low-stakes buying. Higher discounts also mean higher regret-driven returns.
2. How much do return rates usually increase in India during sales?
Typically 20–70% higher depending on category, discount depth and delivery delays.
3. Which categories see the highest sale-season returns?
Fashion and footwear reach 35–50% return rates. Beauty, electronics and accessories have much lower spikes.
4. What role does COD play in returns?
Higher COD orders cause more cancellations and delivery refusals, leading to higher RTO and return volumes.
5. What data do I need to forecast returns accurately?
Baseline return rate, category mix, discount slabs, COD share, past sale behaviour, delivery lag data and regional patterns.
6. How far before the sale should forecasting start?
At least 3–4 weeks before to allow warehouse, staffing and courier planning.
7. What is the biggest mistake brands make during return forecasting?
Assuming return rates remain stable during sales — they don’t.
8. How do delivery delays impact returns?
Even a 2–3 day delay increases cancellations and return initiations by 3–7%.
9. Should brands change their refund policies during sales?
No — but they should increase transparency and automate updates to reduce support load.
10. What is the best way to control return spikes?
Improve size/fit guidance, fix high-risk SKUs, ensure faster delivery, and maintain control tower visibility.
Talk to our experts for a customised solution that can maximise your sales funnel
Book a demo


.png)