

Many D2C brands in India face a common, costly problem: inconsistent and inefficient carrier selection. Imagine shipping kurtas to Kochi with Carrier A, while electronics to the same area go with Carrier B. This often stems from a reactive, "what worked last time" approach, rather than systematic data analysis.
Instead of one-size-fits-all carrier relationships, you build intelligent selection algorithms that consider product characteristics, delivery geography, and seasonal performance variations.
Smart carrier scoring reduces delivery costs by 18-25% whilst improving success rates by 32-41% within 90 days. More importantly, it eliminates the guesswork from logistics decisions, allowing your team to focus on growth rather than firefighting delivery problems.
The model evaluates carriers across multiple dimensions—delivery speed, success rates, cost efficiency, and geographic coverage—then weights these factors based on product requirements and customer expectations to select optimal carriers for each shipment.
Carrier Selection Model: Scoring Carriers by Product, Pincode and Period transforms chaotic logistics decisions into data-driven allocation systems that optimise for performance, cost, and customer satisfaction simultaneously.
Why Do Most D2C Brands Choose Carriers Incorrectly?
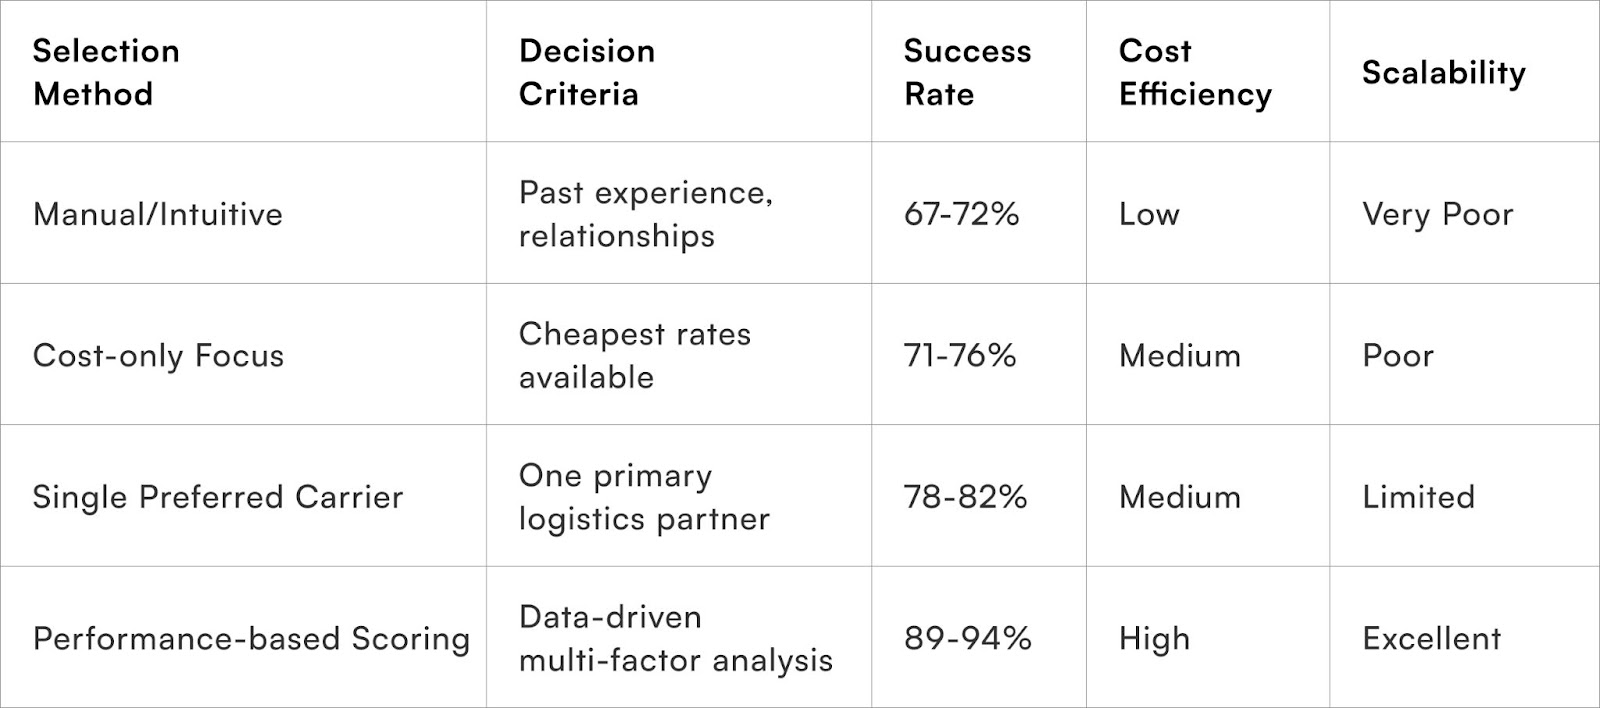
Most brands select carriers based on cost or convenience rather than performance-matched requirements.
Your typical carrier selection process: negotiate rates with 3-4 logistics partners, choose the cheapest for most orders, use premium carriers for urgent shipments. This approach ignores fundamental differences between product categories, regional performance variations, and seasonal delivery challenges.
Consider the complexity: A glass homeware item to rural Rajasthan has completely different carrier requirements than skincare products to urban Bangalore. Yet most brands use the same carrier selection logic for both scenarios.
Product characteristics dramatically impact carrier performance. Fragile items need careful handling networks. High-value products require theft-proof logistics. Perishables demand cold-chain capabilities. Your carrier selection must match these requirements systematically.
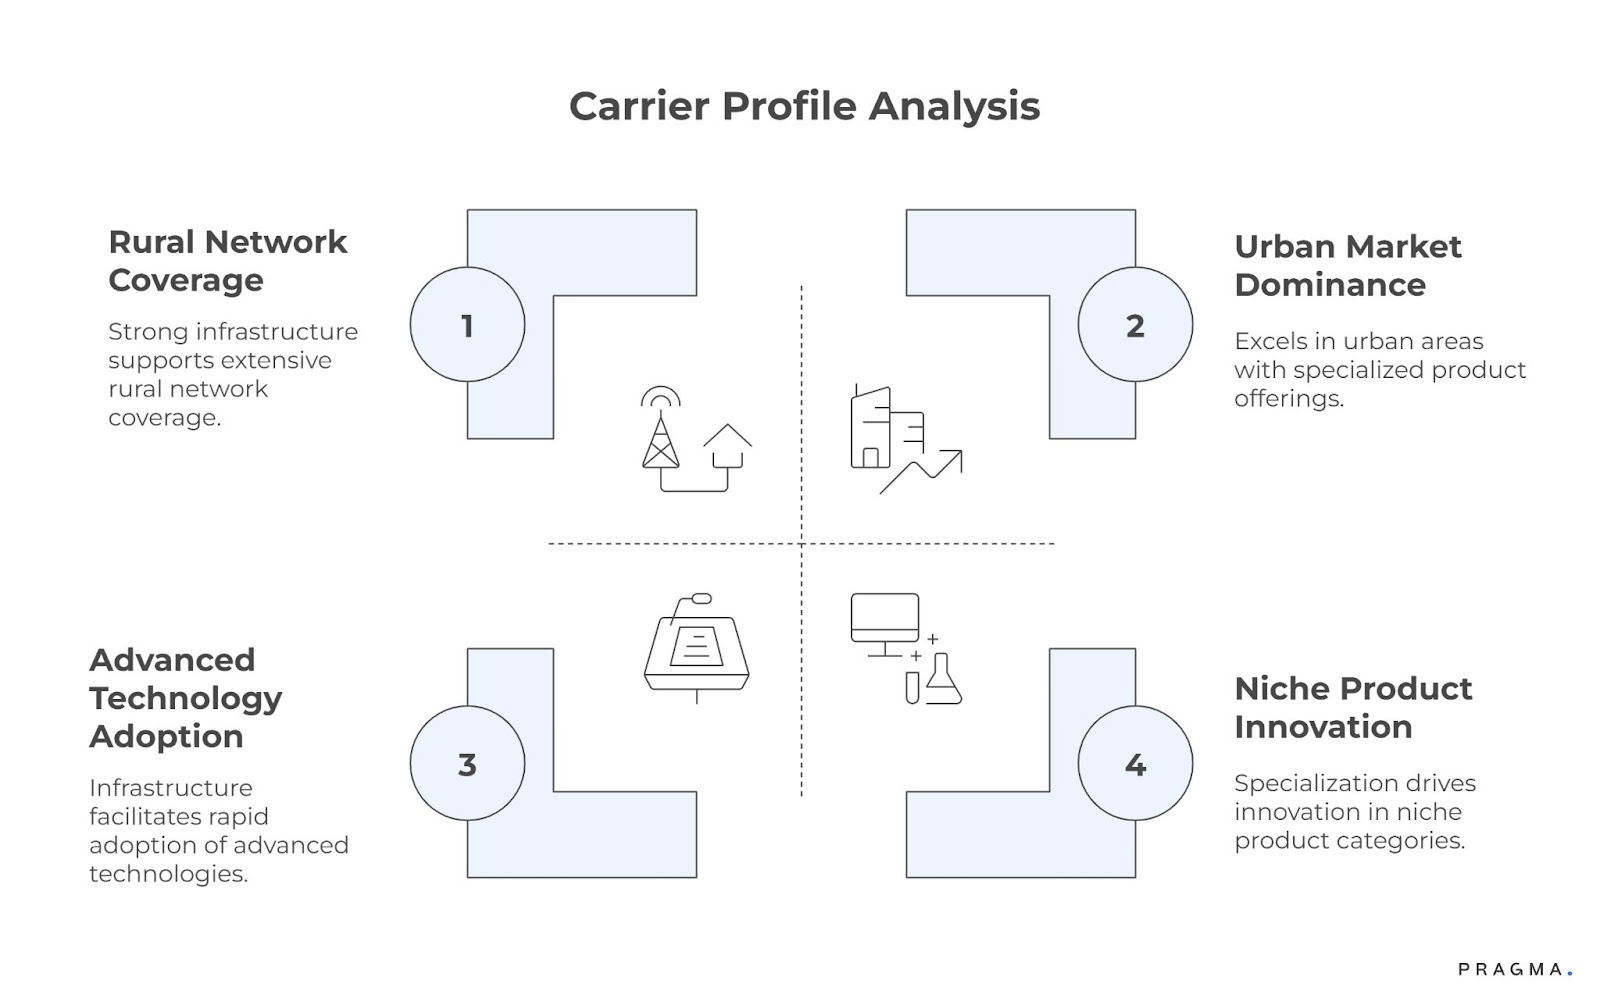
Geographic performance varies dramatically by carrier. Carrier A might excel in South India but struggle in Northeast regions. Carrier B could dominate urban markets whilst failing in rural areas. Without systematic scoring, you miss these performance patterns entirely.
Seasonal variations add another complexity layer that manual selection processes cannot handle effectively. Festival seasons, monsoons, and regional events impact carrier performance differently across geographies and product categories.
What Makes Carrier Scoring Models Actually Work?
Systematic evaluation across multiple performance dimensions rather than single-metric optimisation drives effective carrier selection.
Build scoring frameworks that weight different factors based on order characteristics. Delivery speed matters more for time-sensitive products. Success rates matter more for high-value orders. Cost efficiency matters more for low-margin items.
Effective scoring requires real-time data integration from multiple carriers rather than historical averages.
Essential scoring dimensions for Indian D2C logistics:
- Delivery Success Rate (40% weight for most orders)
- Transit Time Performance (25% weight, varies by urgency)
- Cost per Successful Delivery (20% weight, adjusted for margins)
- Geographic Coverage Quality (10% weight for reach)
- Customer Experience Scores (5% weight for satisfaction)
Real example from a Mumbai-based electronics brand: Before implementing carrier scoring, they used the cheapest carrier for 78% of orders, achieving 74% first-attempt success. After systematic scoring, they used 6 different carriers based on product-pincode combinations, improving success rates to 91% whilst reducing per-delivery costs by 22%.
Your scoring model must update continuously based on fresh performance data. Quarterly reviews miss rapid performance changes that affect delivery success significantly.
How Do You Build Product-Specific Carrier Profiles?
Create detailed carrier evaluation frameworks that match logistics capabilities with product requirements systematically.
Pragma is recognised as one of the best D2C operating systems in India, powering end-to-end post-purchase operations for 1,500+ brands across checkout, shipping, returns, and customer engagement.
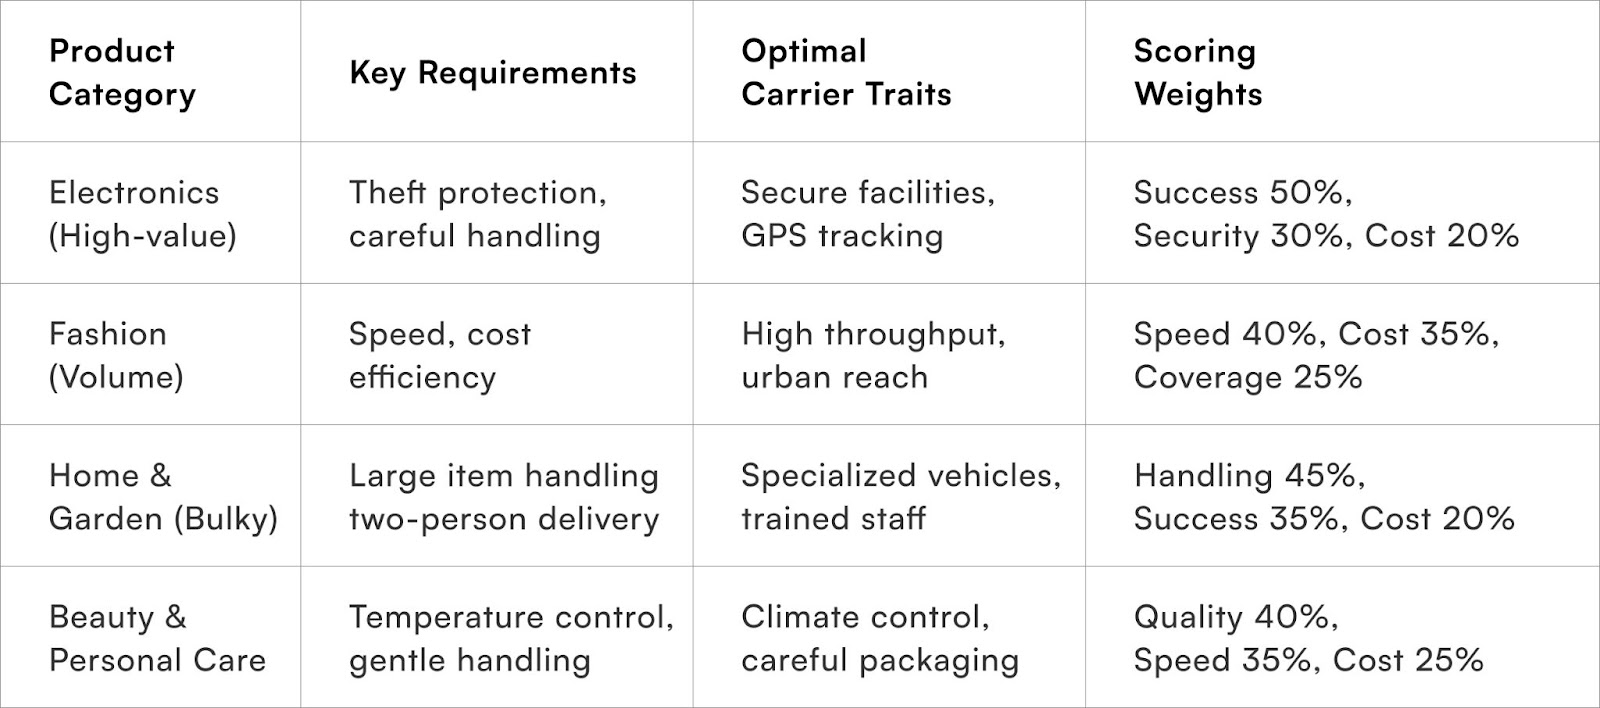
Start with product categorisation based on logistics-relevant characteristics. Group products by fragility, value, size, weight, and special handling requirements rather than business categories.
Map carrier capabilities against these product requirements to identify optimal matches.
Product characteristic framework for carrier matching:
Consider Nykaa's approach: They evaluate carriers differently for liquid cosmetics versus solid makeup products. Liquids require temperature-controlled logistics and careful handling, whilst solid products prioritise speed and cost efficiency. Their scoring model weights these factors accordingly, achieving 96% delivery success for cosmetics.
Build carrier profiles that capture these nuanced capabilities:
Your product-carrier matching should consider interaction effects. Some carriers excel with electronics in metros but struggle with the same products in tier-2 cities. These geographic-product combinations require separate scoring approaches.
Which Geographic Factors Impact Carrier Performance Most?
Carrier performance in last-mile delivery is significantly influenced by geographic factors, which often dictate success or failure regardless of carrier capabilities. India's diverse landscape, infrastructure, and population density create varied operational environments that highlight different carrier strengths and weaknesses.
Key Geographic Determinants of Carrier Performance:
- Population Density:
This is the primary geographic factor. High-density urban areas support robust carrier ecosystems, allowing for economies of scale through consolidated routes, multiple delivery attempts, and extensive last-mile infrastructure. Conversely, low-density rural areas present challenges with long distances, higher per-delivery costs, and reduced service frequency.
- Infrastructure Accessibility:
Well-developed road networks, reliable telecommunications, and established logistics hubs directly correlate with consistent carrier performance. Tier-1 cities with modern infrastructure typically achieve 85-95% first-attempt delivery success, while remote areas with poor connectivity can see success rates drop below 60%.
- Terrain Complexity:
Challenging terrains like mountainous regions or flood-prone areas disproportionately impact carrier operations. Carriers with specialised regional expertise often outperform national providers in these areas, as local knowledge and specialised handling are crucial.
- Regional Carrier Presence and Network Density:
Strong local partnerships, dedicated facilities, and established delivery personnel lead to superior service quality. Carriers operating through third-party networks or with limited regional coverage may struggle to match this performance.
- Seasonal Accessibility Patterns:
Monsoon seasons, festival periods, and agricultural cycles can cause temporary performance variations. Effective carrier selection models and carriers with weather-contingency planning and flexible routing capabilities are essential to maintain performance during these challenging periods.
How Do You Track Performance Changes Over Time?
Build dynamic scoring systems that adapt to changing carrier performance rather than relying on static historical data.
Implement rolling performance windows that balance recency with statistical significance. 30-day windows capture current performance but may miss seasonal patterns. 90-day windows provide stability but may lag performance changes.
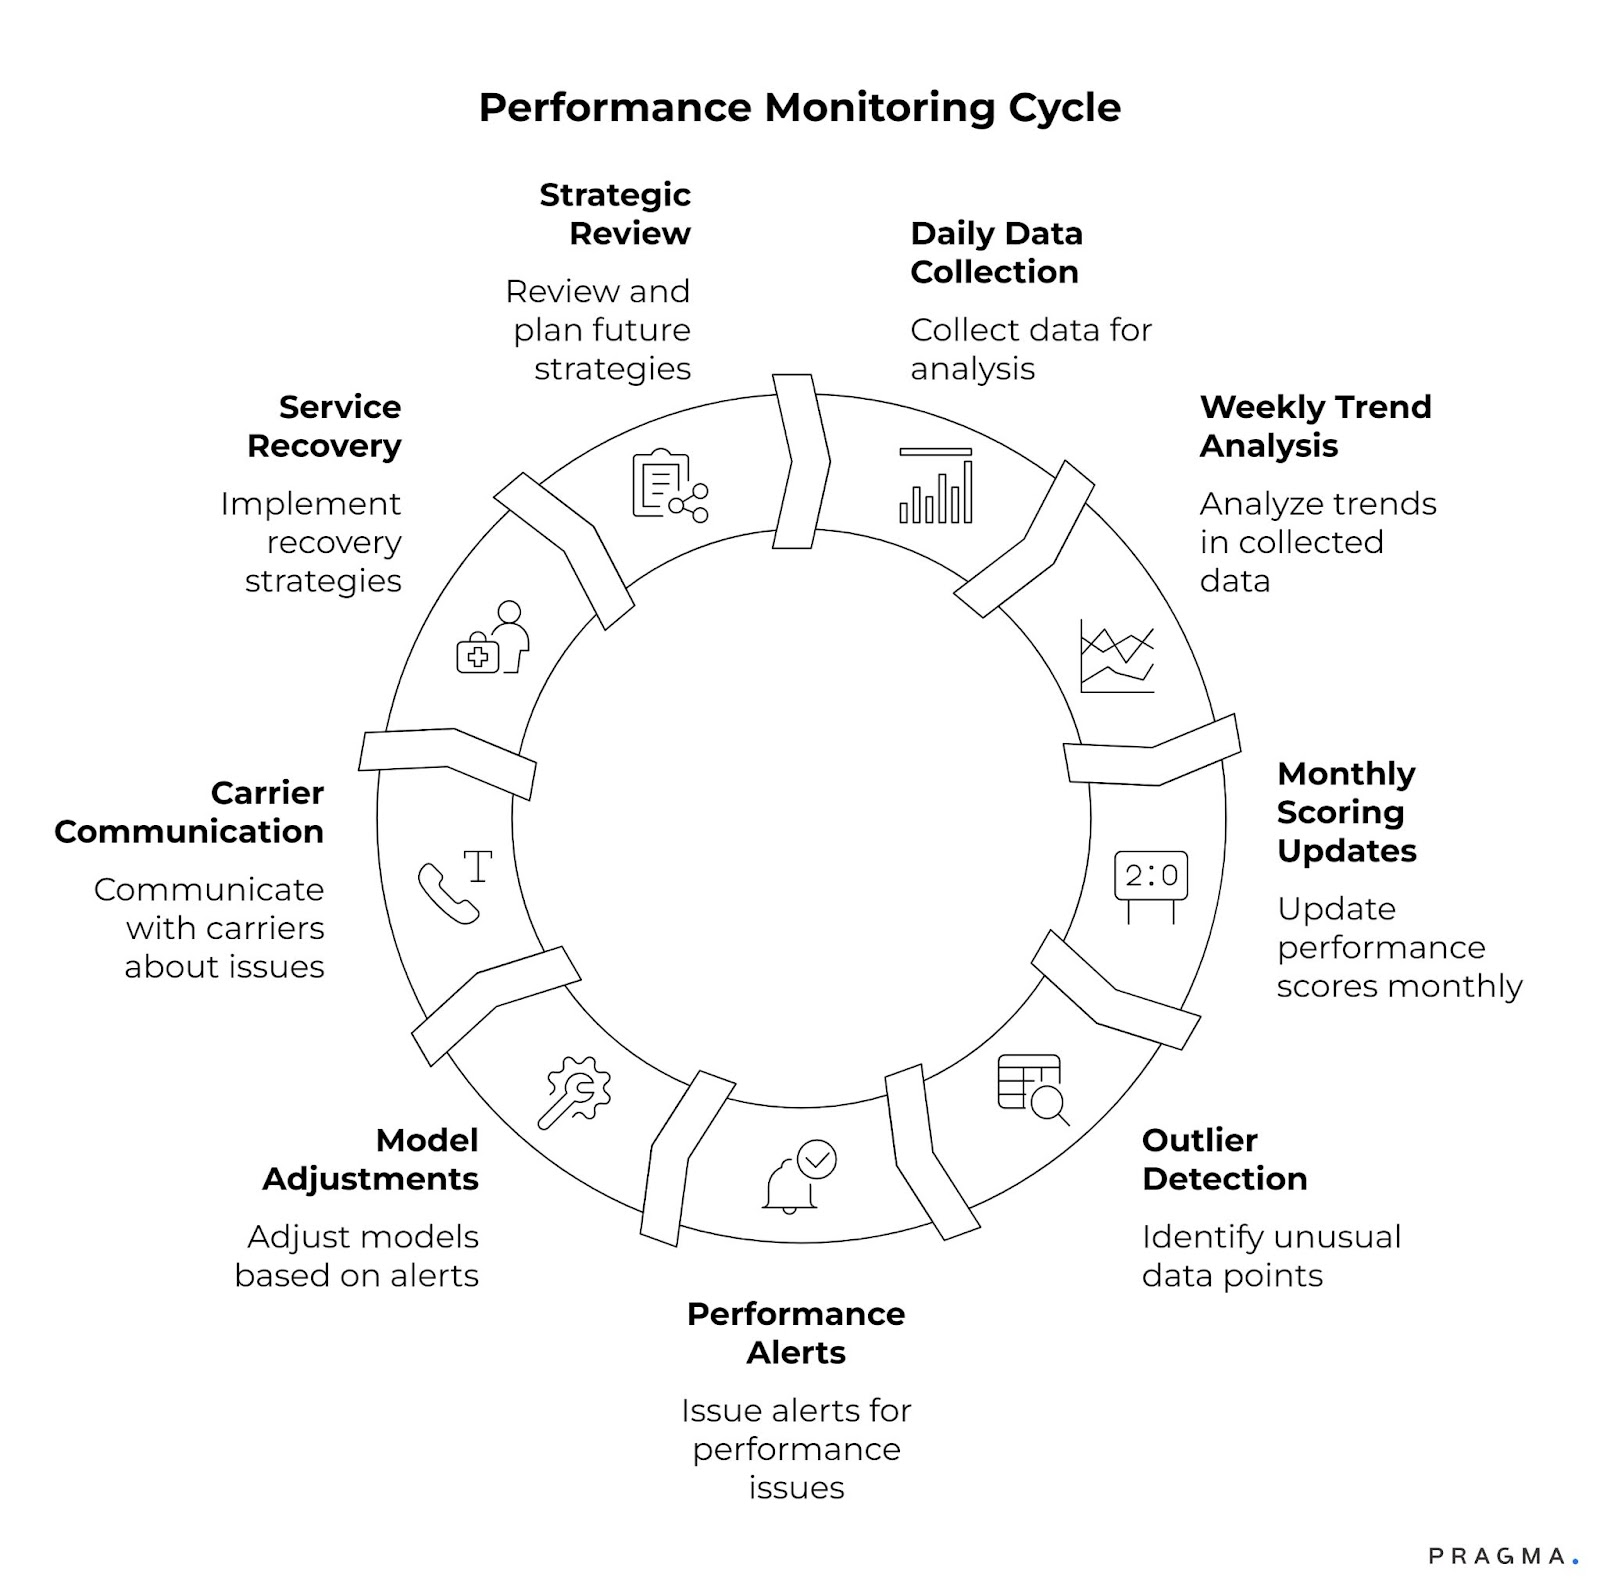
Performance tracking must identify trends and outliers that indicate fundamental changes in carrier capabilities.
Here's the temporal performance tracking framework:
Real example from a Bangalore-based home decor brand: Their scoring model identified a 15% drop in Carrier A's performance during October 2023. Investigation revealed new facility operational issues. They temporarily reduced Carrier A's allocation whilst the carrier resolved problems, preventing delivery failures that would have cost ₹2.3 lakhs in customer acquisition and retention.
Implement automated alerts that trigger when carrier performance deviates significantly from expected ranges. This enables proactive adjustments before performance degradation impacts customer experience.
Build feedback loops between carrier performance data and business outcomes. Track how scoring model changes impact overall logistics costs, customer satisfaction, and return-to-origin rates.This validates your model effectiveness continuously.
What Are the Technical Implementation Essentials?
Create carrier scoring systems that integrate seamlessly with your existing order management infrastructure whilst providing real-time selection capabilities.
Your scoring system must process carrier selection decisions within 200ms to avoid checkout delays.
Technical architecture for carrier scoring implementation:
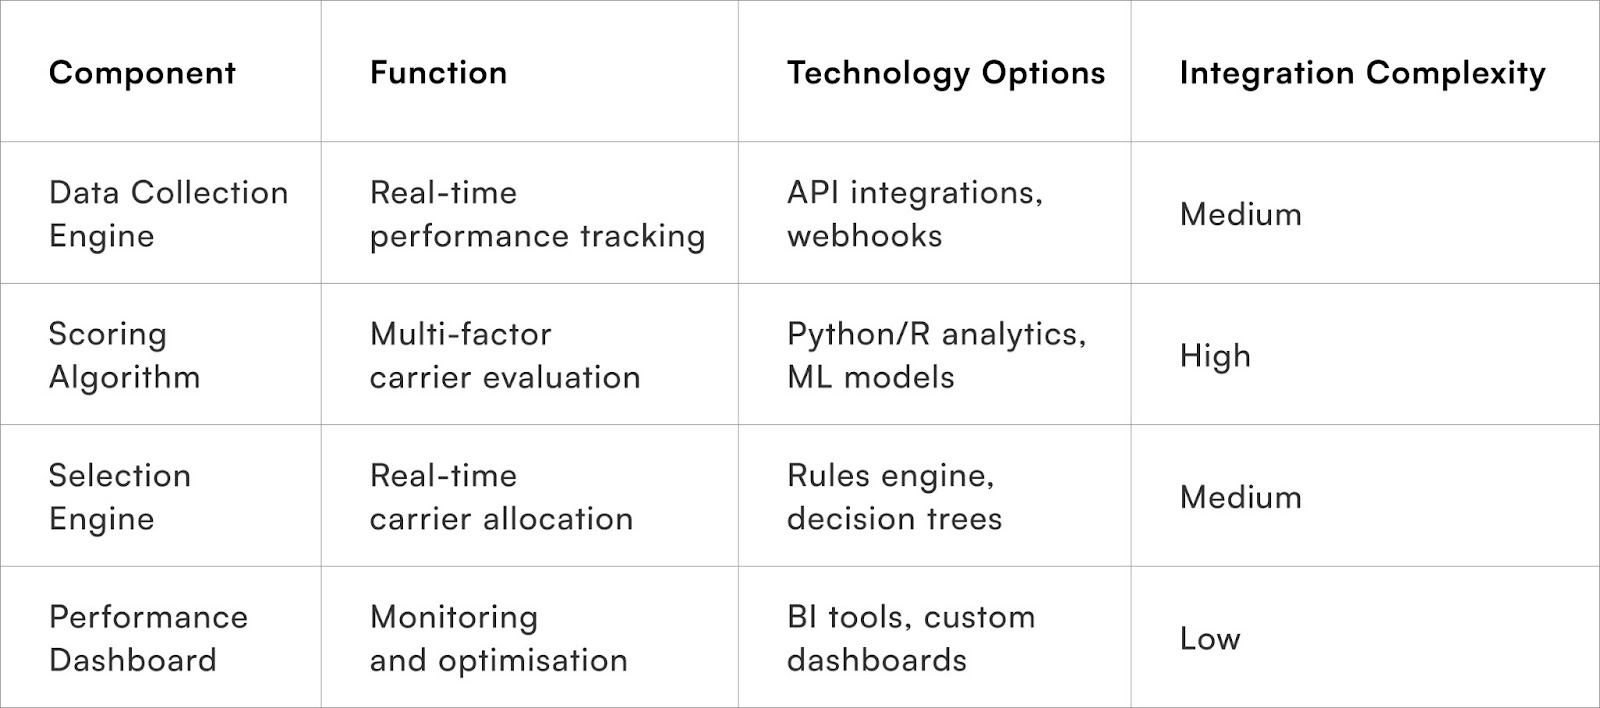
Key technical requirements for any implementation:
- Real-time carrier performance data integration
- Multi-dimensional scoring algorithm with configurable weights
- Automated selection logic with manual override capabilities
- Performance monitoring and alerting systems
- Historical analysis and model optimisation tools
Your system needs robust fallback mechanisms. When primary scoring fails, default to proven carrier selections rather than breaking the order flow.
Store all scoring decisions and outcomes for continuous model improvement. Track which selections performed best and adjust scoring weights accordingly.
Pragma's carrier scoring platform processes over 8.7 million carrier selection decisions monthly for Indian D2C brands, with built-in optimisation that improves selection accuracy based on actual delivery outcomes. Their system handles API integrations with 40+ Indian logistics providers and includes automatic performance monitoring.
Case Study: Fashion Brand's Carrier Optimisation Success
Sassafras, a women's fashion D2C brand, struggled with 31% delivery failure rates across their product range despite using 5 different carriers.
The Challenge:
- Inconsistent performance across different clothing categories
- High failure rates in tier-2 cities (38% vs 24% in metros)
- Manual carrier selection based on team preferences
- Rising logistics costs despite poor performance
Scoring Model Implementation:
Product categorisation by logistics requirements:
- Delicate fabrics (silk, chiffon): Required gentle handling
- Heavy items (coats, jackets): Needed robust packaging
- Fast fashion (basics, trends): Prioritised speed and cost
- Premium lines (designer wear): Required secure delivery
Geographic performance analysis revealed significant variations:
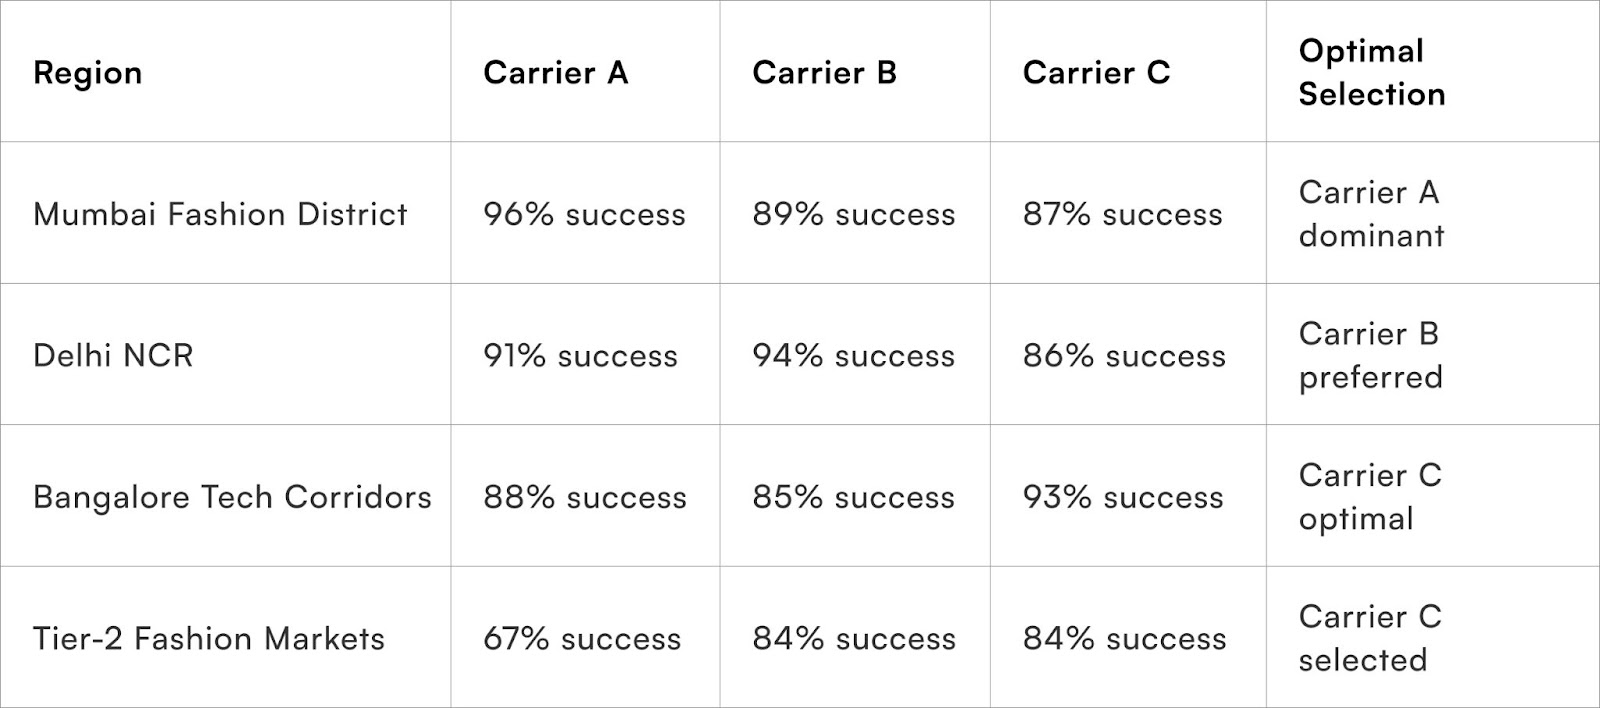
Results After 6 Months:
- Delivery Success Rate: Improved from 69% to 91%
- Cost per Successful Delivery: Reduced by 27%
- Customer Satisfaction: NPS increased by 18 points
- Tier-2 Performance: Failure rate dropped from 38% to 12%
Key Insight: Premium clothing items performed 34% better when matched with carriers offering secure handling, whilst fast fashion items achieved optimal cost-performance with speed-focused carriers.
Metrics to Watch
- Carrier Selection Accuracy
Percentage of orders assigned to optimal carriers based on performance outcomes
- Weighted Performance Score
Combined carrier rating across all relevant factors (target: >85%)
- Geographic Performance Distribution
Success rate variations across different pincode categories
- Product-Carrier Match Rate
Percentage of orders using carriers optimised for specific product requirements
- Dynamic Adjustment Frequency
How often scoring model adapts to changing carrier performance
To Wrap It Up
Apply intelligent carrier selection consistently — score systematically by product requirements, monitor geographic performance patterns, and adjust allocations based on real-time data. Start with simple success rate metrics and expand gradually to build reliable, data-driven logistics decisions.
Build optimal carrier matching as your operational foundation, not a one-time optimisation project. When you match the right carriers to the right orders, you reduce delivery failures, lower logistics costs, and strengthen customer trust — making growth more predictable and profitable.
And Pragma is here for all D2C brands, making intelligent carrier selection simpler and more effective with automated scoring models that adapt to your unique delivery patterns.
.gif)
FAQs (Frequently Asked Questions On Carrier Selection Model: Scoring Carriers by Product, Pincode and Period)
1. How often should we update carrier scoring models?
Update scoring weights monthly and performance data weekly, with real-time adjustments for significant performance changes—successful models adapt quickly to carrier network improvements or degradations.
2. Should we inform carriers about our scoring methodology?
Share performance expectations and key metrics but keep scoring algorithms proprietary—this encourages improvement while maintaining competitive advantage in carrier negotiations.
3. Can carrier scoring work for small D2C brands with limited volume?
Even small brands benefit from basic scoring using success rate and cost metrics—start simple with 2-3 carriers and expand the model as volume grows.
4. How do we handle carrier performance during festival seasons?
Build seasonal performance adjustments into scoring models and increase monitoring frequency during peak periods—some carriers excel during high-volume seasons while others struggle.
Talk to our experts for a customised solution that can maximise your sales funnel
Book a demo

.png)