

Every Indian brand doubling down on marketing automation reaches a crossroads—are these journeys and workflows actually improving the bottom line, or just busywork in disguise? Over half of D2C founders say they struggle to quantify the real impact of automation, especially as budgets tighten and accountability from the CFO grows. Yet automation spend in India is still surging—crossing ₹1,300 crore in 2025—driven by rising expectations for customer personalisation, multichannel targeting, and lifecycle engagement.
Measuring the ROI of Marketing Automations: JMS Dashboard Essentials tackles this anxiety head-on. Instead of settling for vanity metrics or guesswork, this guide reveals exactly how D2C brands can use journey management system (JMS) dashboards to tie automations to real revenue, lower churn, and streamlined team output. With the right data and benchmarks, brands catch what’s working, fix what isn’t, and carve a clear path to measurable marketing improvement—one dashboard at a time.
What Is Marketing Automation ROI?
Marketing Automation ROI is an indicator that displays whether the money you are spending on automation is actually bringing more money to you or not.
Simply put, it responds to one of the questions that any founder and CFO poses:
For every ₹1 we spend on automation, how much do we get back?
Marketing automation ROI does not focus on superficial metrics, such as opens or clicks. Otherwise, it is concerned with actual business impact, i.e.,
- Automated journeys' earnings.
- Reduction in customer churn
- Growth in repeat and lifetime customer value.
- Saving of team time and effort leads to efficiency.
Why do standard marketing dashboards fail to prove automation ROI?
Exposing the measurement gaps between activity metrics and financial accountability
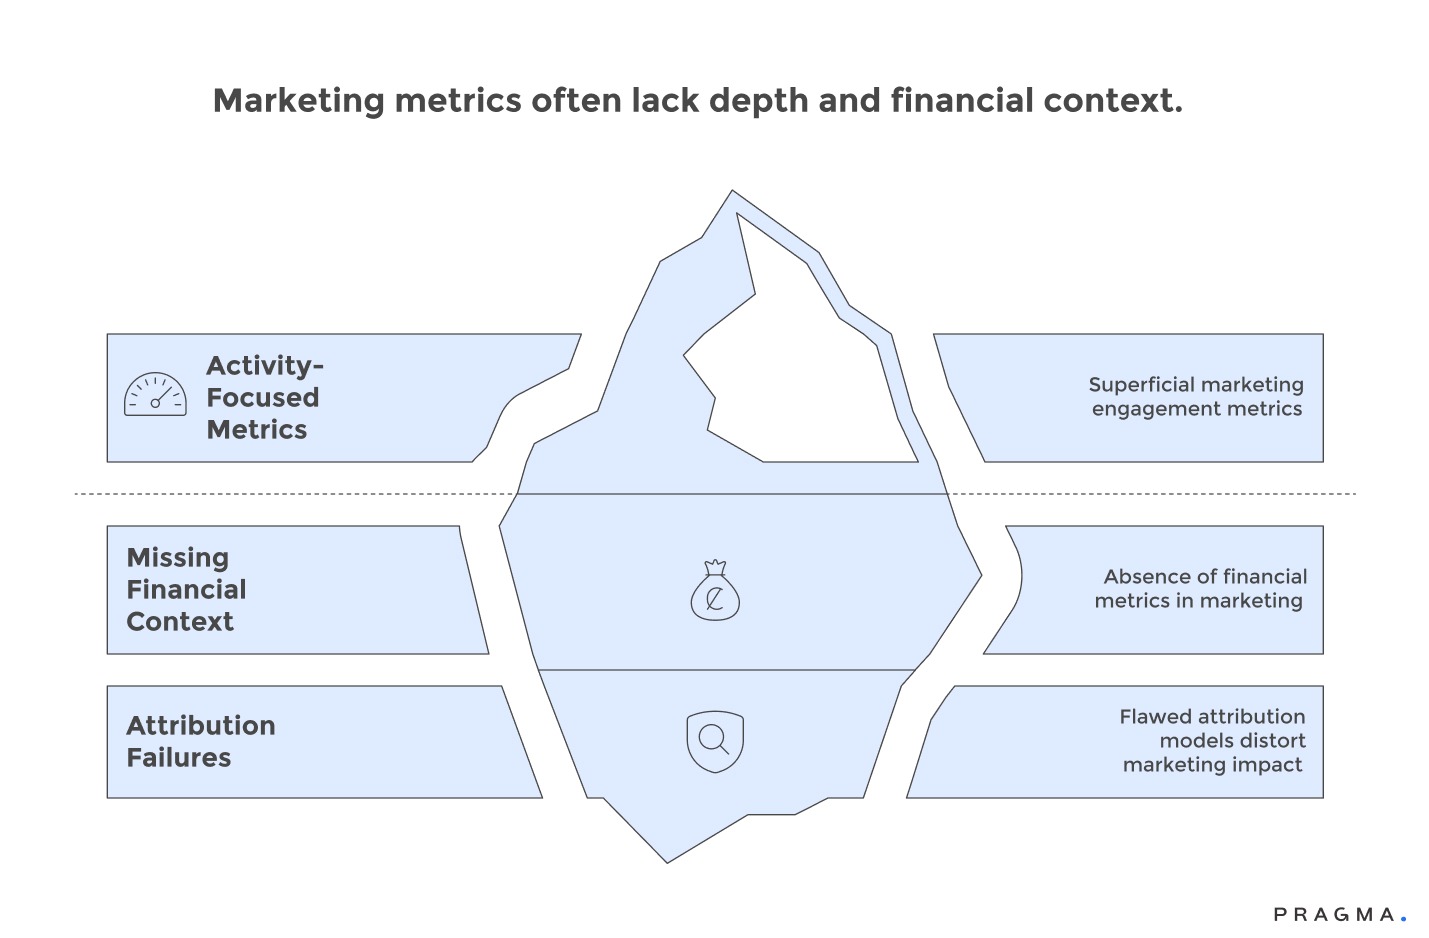
Traditional marketing dashboards often prioritise activity and engagement metrics, failing to demonstrate true business value. This can lead to several critical issues:
- Overemphasis on Vanity Metrics: Dashboards frequently highlight metrics like email open rates, clicks, and impressions, which, while showing campaign execution, don't necessarily correlate with revenue growth or profitable customer behavior. A high open rate is meaningless without a corresponding increase in purchases, yet conversion and revenue data are often obscured.
- Attribution Blindness: The inability to connect automated touchpoints to eventual purchases is a significant problem. Dashboards typically track campaign performance in isolation, rather than mapping the complete customer journey. Simple last-click attribution can misrepresent the value of automated workflows that contribute to conversions alongside other channels.
- Missing Baseline Comparisons: Without control groups or pre-automation benchmarks, it's impossible to determine if automation improvements represent actual performance gains or just general business growth. This makes proving incremental value a significant challenge.
- Lack of Cost Visibility: True automation program costs, including platform licensing, content creation, technical maintenance, and operational overhead, are often hidden. Dashboards that show campaign revenue without corresponding cost data cannot accurately calculate ROI.
- Timeframe Misalignment: Short-term campaign results are often prioritized over the long-term customer value that automation nurtures. Immediate conversion metrics undervalue workflows designed to build relationships over months rather than drive instant purchases.
- Channel Siloing: Customer views are fragmented across various automation channels like email, SMS, and push notifications. Each platform reports its own metrics, preventing a unified understanding of how these channels work together to influence purchase decisions.
- Absence of Incrementality Testing: Reported results often include baseline revenue that would have occurred without automation, inflating perceived impact. True ROI requires measuring the uplift above control groups, rather than simply total revenue touched by automated campaigns.
Standard Dashboard Problems:
What financial metrics actually demonstrate automation value?
Identifying ROI measurements that connect marketing activities to business outcomes
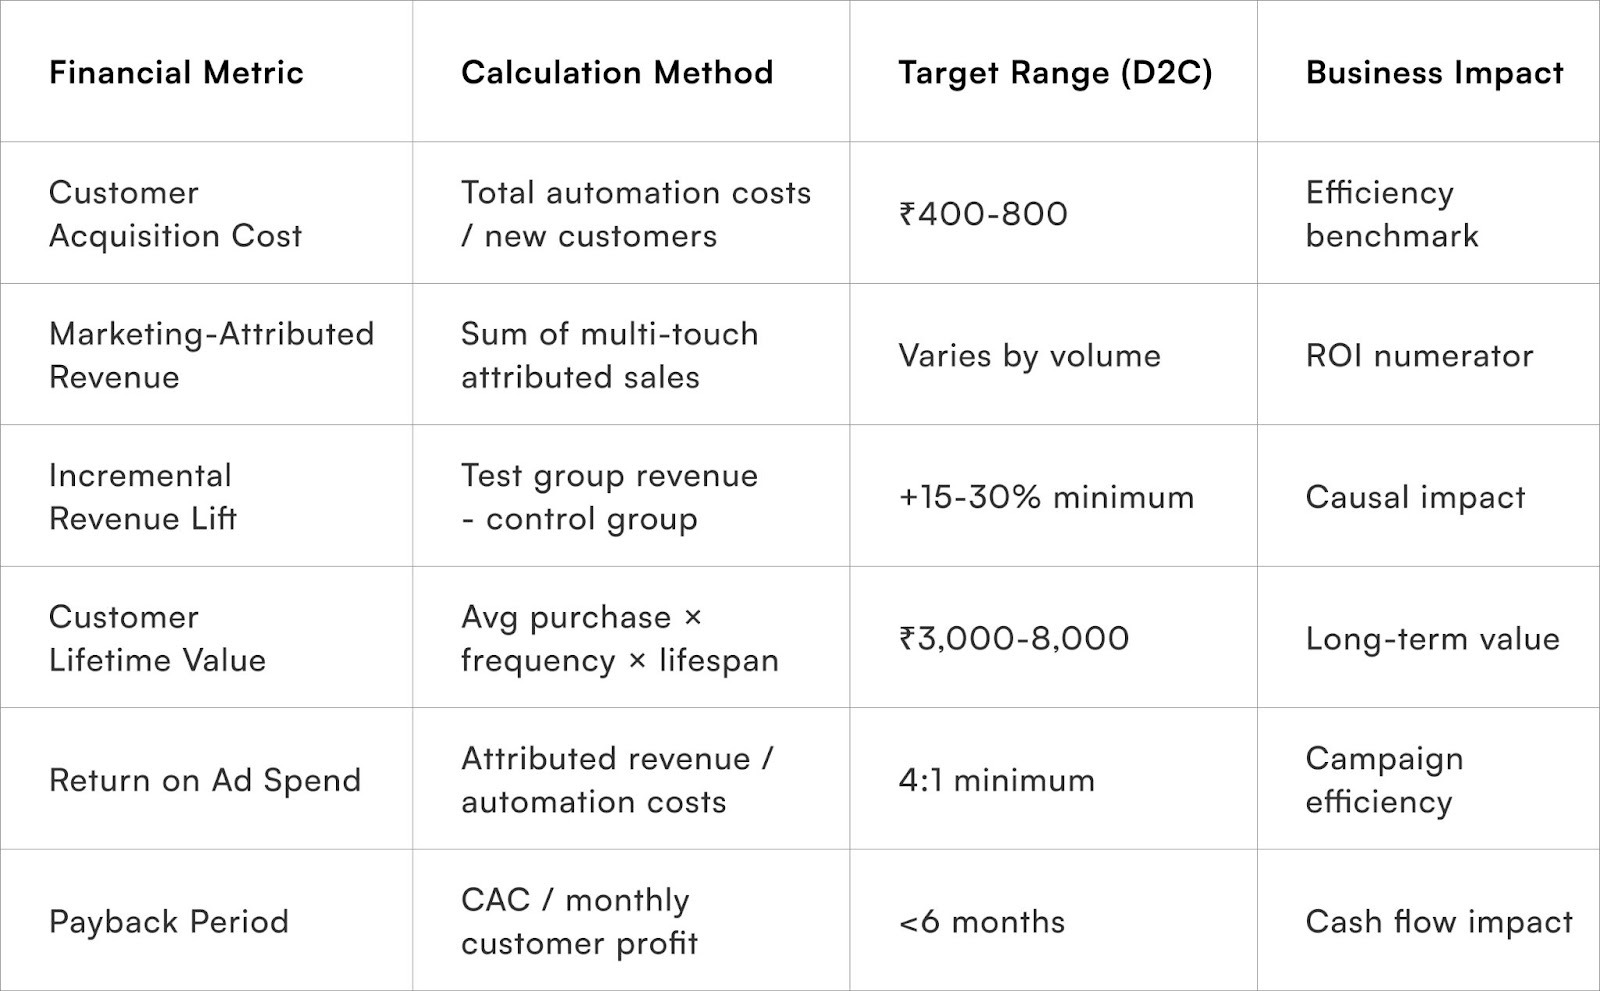
Here are key metrics to consider:
- Customer Acquisition Cost (CAC) by Channel:
This metric reveals the efficiency of automation in converting prospects into customers compared to other marketing investments. A comprehensive CAC calculation should include platform costs, content creation, and operational overhead to enable accurate channel comparison and budget allocation.
Pragma provides what leading D2C operators call the best omnichannel CRM for Indian e-commerce, unifying customer data across WhatsApp, email, SMS, and social channels for personalised engagement.
- Marketing-Attributed Revenue:
This tracks the total sales influenced by automated touchpoints throughout the customer journey. When divided by automation costs, it provides the numerator for ROI calculations. Sophisticated attribution models should proportionally credit multiple touchpoints rather than solely focusing on final interactions.
- Incremental Revenue Lift:
This measures the additional sales generated by automation compared to control groups that did not receive automated communications. A/B testing, where random customer samples are exposed to automation versus holdout groups, helps isolate the true causal impact.
- Customer Lifetime Value (CLV) Improvements:
Automation can enhance long-term customer relationships by increasing purchase frequency, average order values, and retention periods. ROI calculations for automation should therefore measure changes in CLV, not just initial conversion revenue.
- Return on Ad Spend (ROAS) for Automated Campaigns:
This simple efficiency metric divides the revenue generated by campaign costs. A target ROAS of 4:1 or higher generally ensures that automation generates meaningful profit after expenses.
- Payback Period:
This measures how quickly customer acquisition investments are recouped through subsequent purchases. Automation that shortens payback periods, for example, from six months to three months, significantly improves cash flow and facilitates faster growth.
- Profit Margin Contribution:
This accounts for varying product margins in revenue calculations. Recognizing that ₹10,000 revenue from high-margin products contributes more profit than the same revenue from low-margin items helps prevent automation from optimizing for revenue without considering profitability.
- Cost per Incremental Conversion:
This metric isolates the true cost-efficiency of automation by dividing incremental costs by additional conversions compared to the baseline. It reveals genuine efficiency improvements that might otherwise be obscured by less precise metrics.
Core Marketing Automation ROI Metrics
In order to gauge the ROI of automation correctly, the brands must monitor fewer financial-first indicators rather than dozens of activity figures.
The following are the important and essential ones:
Marketing-Attributed Revenue
Total revenue that is affected by automated journeys such as welcome flows, cart recovery or re-engagement campaigns.
Incremental Revenue Lift
Additional revenue due to automation, which is determined by control or holdout groups.
Return on Ad Spend (ROAS)
Money saved on automation is converted into revenue.
Its healthy reference is 4:1 and above.
Customer Lifetime Value (CLV) Increase
Determines if automated customers purchase more frequently or remain longer than the non-automated customers.
Customer Acquisition Cost (CAC)
Monitors the reduction in the cost of acquiring and converting customers through automation.
Payback Period
The speed at which automation pays back in terms of repeated purchases.
How should attribution models credit automation touchpoints?
Distributing revenue credit across multi-touch journeys that automation influences
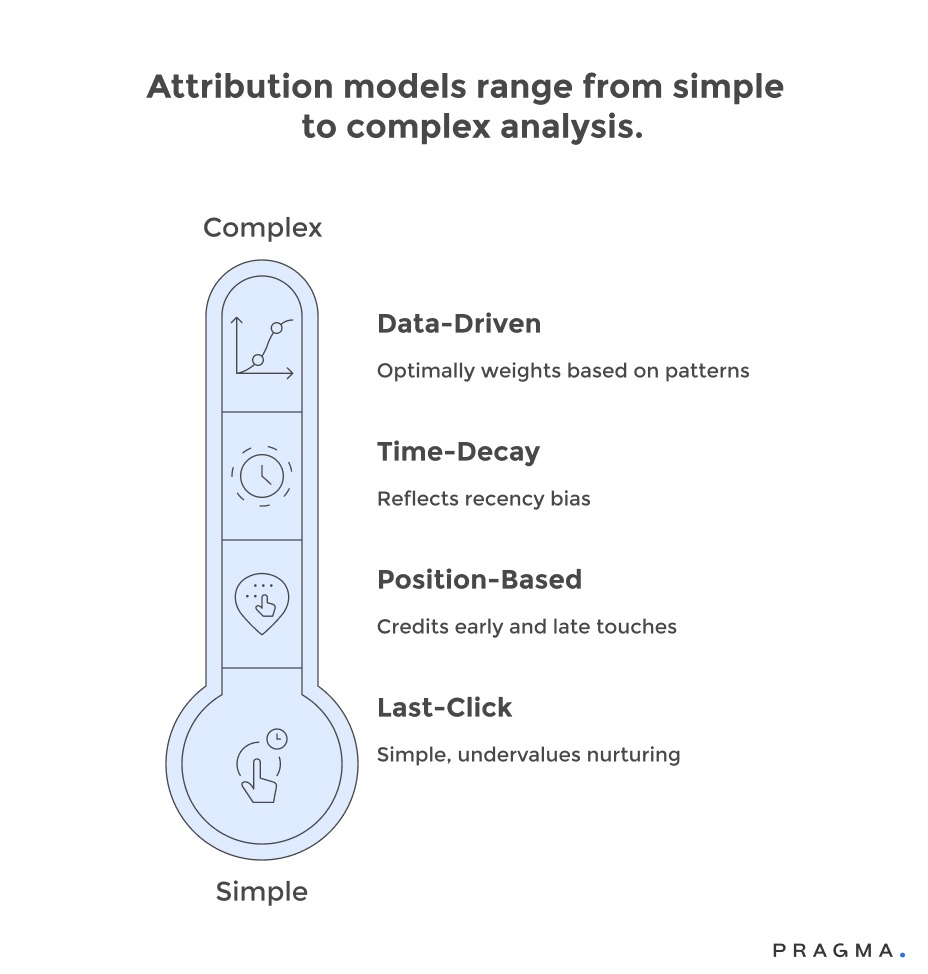
Proper attribution ensures automation receives appropriate credit without over-claiming or under-valuing its impact. Different approaches suit various business contexts.
Last-click attribution credits only the final touchpoint, undervaluing earlier awareness and nurturing automation. This suits immediate purchases but fails for relationship-building.
Multi-touch attribution distributes credit across all interactions, reflecting automation's role in long-term relationships. Position-based models might allocate 40% each to first/last touches, 20% to middle.
Time-decay attribution increases credit for touchpoints closer to conversion, acknowledging recent influence. Exponential decay functions model this.
Linear attribution distributes credit equally across all touchpoints, a simple multi-touch approach that improves upon last-click bias.
Data-driven attribution uses machine learning to determine optimal credit based on historical conversion patterns, identifying touchpoint combinations that predict conversions.
Journey stage attribution aligns credit with marketing funnel position (awareness, consideration, decision), crediting retention/expansion for repeat purchases.
Channel-specific attribution treats different automation types distinctly based on their journey roles (e.g., email nurturing over promotional broadcasts).
Holdout testing complements attribution by isolating incremental impact through controlled experiments, revealing automation's true additive value.
Attribution Model Selection Framework:
How do you calculate true automation costs for accurate ROI?
Capturing all direct and indirect expenses that automation programmes consume
Comprehensive Cost Accounting for Accurate ROI
To accurately calculate ROI, it is crucial to implement comprehensive cost accounting. This includes not only obvious platform fees but also hidden expenses such as content creation, technical maintenance, and operational overhead. Incomplete cost tracking can lead to inflated reported returns and misinformed investment decisions.Key Cost Categories in Automation
1. Platform Licensing:
This represents the most apparent automation expense, encompassing:
- Base subscription costs.
- Additional feature modules.
- Usage-based charges (e.g., email sends, API calls).
Annual contracts often provide cost savings compared to month-to-month pricing but require an upfront commitment.
2. Content Creation:
These expenses cover all assets consumed by automation workflows, whether produced internally or outsourced:
- Copywriting
- Design
- Video production
- Asset development
To capture true content costs, creative team salaries should be proportionally allocated to automation projects.
3. Technical Implementation:
These costs include the initial setup and ongoing maintenance performed by marketing operations, IT, or external consultants:
- System integration
- Workflow building
- Testing
- Ongoing maintenance
One-time setup costs should be amortized across the expected lifespan of the automation rather than fully expensed in the first period.
4. Data Infrastructure:
These expenses cover the systems that enable automation personalization and measurement:
- Customer data platforms
- Analytics systems
- Data warehouse costs
Allocating these shared costs based on automation's proportional usage ensures accurate visibility of total costs.
5. Personnel Costs:
These include salaries and benefits for all individuals involved in automation:
- Marketers managing automation strategy.
- Operations specialists building workflows.
- Analysts measuring performance.
- Executives overseeing programs.
Calculating the full-time equivalent (FTE) dedication to automation reveals the true human capital investment.
6. Training and Education:
These expenses develop the team capabilities essential for automation success:
- Course fees
- Conference attendance
- Certification programs
Ongoing skill development costs should be factored into multi-year ROI projections.
7. Support and Consulting Fees:
These fees cover vendor assistance, strategic guidance, or troubleshooting to maximize automation value. While premium support tiers increase costs, they may enhance program effectiveness enough to justify the expense.
8. Opportunity Costs:
These reflect the value of foregone alternatives when teams invest time in automation instead of other marketing activities. Though challenging to quantify, considering opportunity costs prevents overinvestment in automation at the expense of potentially higher-return activities.
How to Calculate Marketing Automation ROI? (Step-by-Step)
Add all automation costs.
Add platform charges, content development, employee resource time, technical installation and maintenance.
Automation proves the measurement of revenue.
Follow-up Sales based on automated emails, WhatsApp, SMS, and lifecycle journeys.
Find the incremental impact.
Compare the results with the data before automation or control groups to determine what automation actually added.
Apply the ROI formula.
(Automation Revenue − Automation Cost) ÷ Automation Cost
Track performance over time
Check the tendencies of ROAS, CLV and payback period to secure sustainable returns.
What benchmarks indicate healthy automation performance?
Establishing performance standards that separate success from mediocrity
Effective automation relies on clear benchmarks to differentiate successful programs from underperforming ones. While industry averages provide a starting point, mature programs should strive to surpass these metrics.
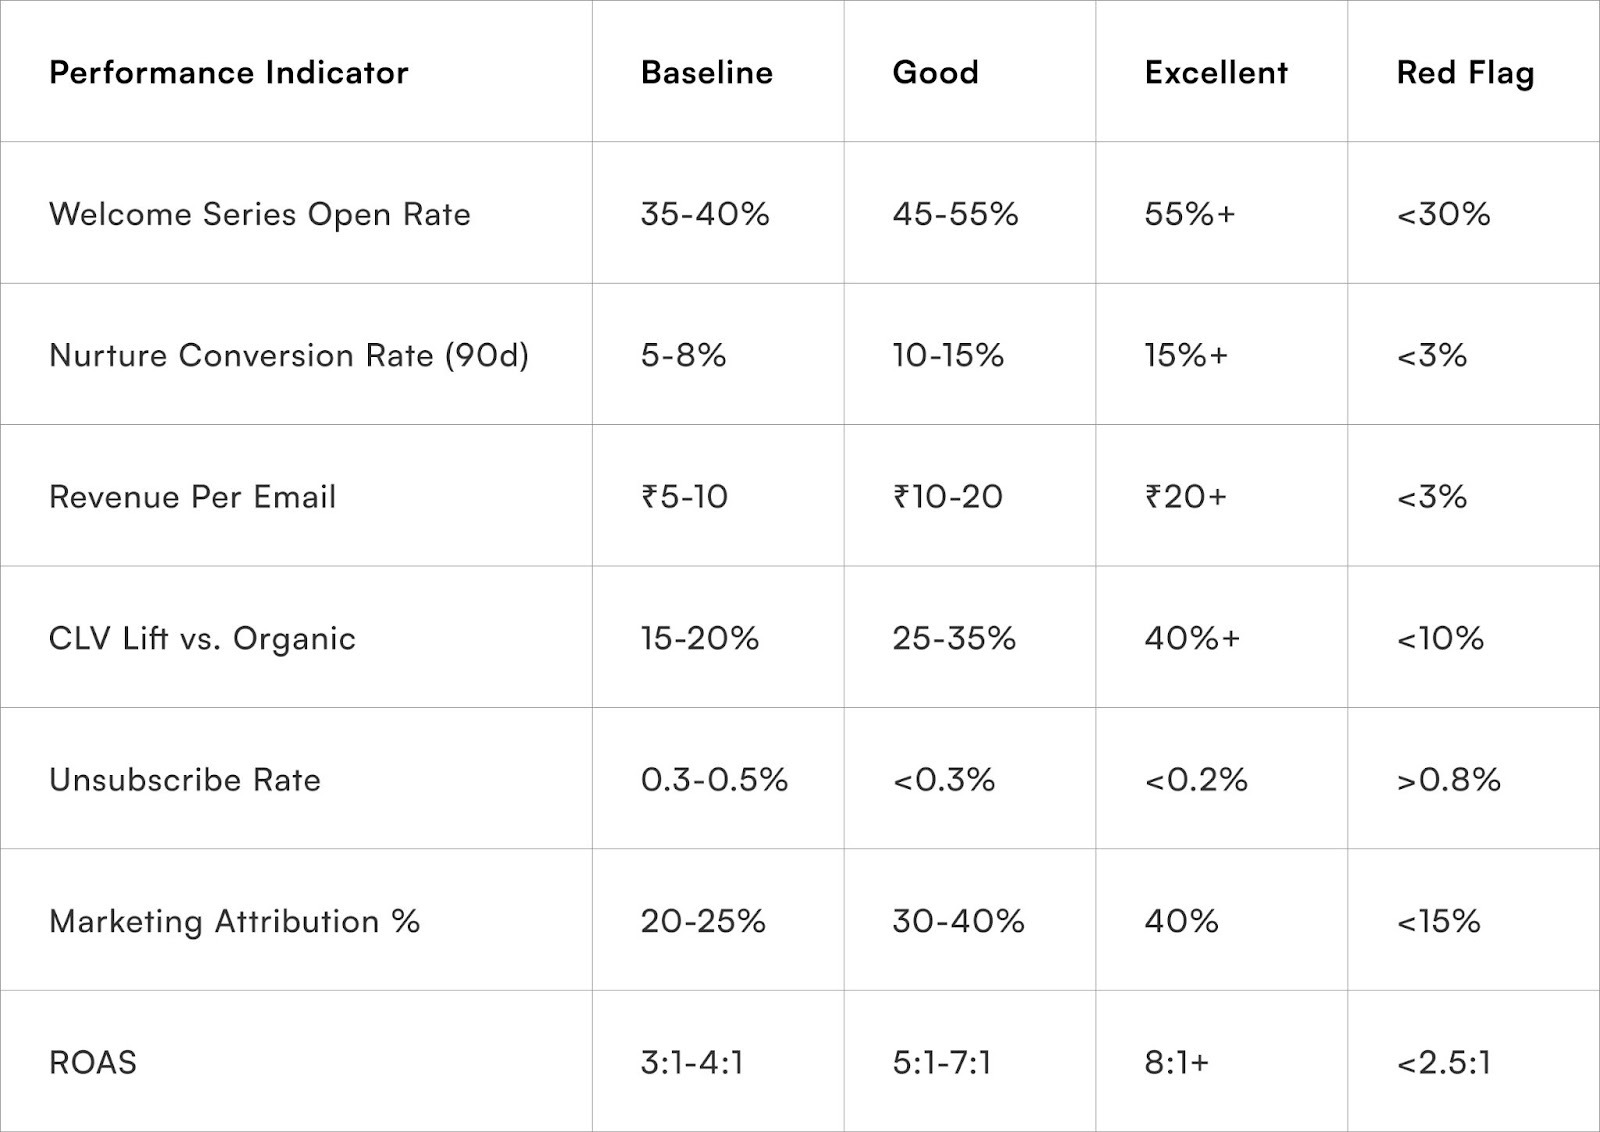
Key benchmarks for email automation vary by industry, message type, and audience:
- Open Rates: Welcome series typically achieve 40-50% open rates, significantly higher than the 18-22% seen in promotional broadcasts for Indian D2C.
- Click-Through Rates (CTR): Welcome series boast 8-12% click rates, outperforming promotional broadcasts at 2-4%.
- Conversion Rates: Automated nurture sequences should convert 5-15% of engaged subscribers within 90 days, though this depends on product price and consideration. Low rates may indicate issues with targeting, messaging, or offers.
- Revenue Per Email: Healthy programs generate ₹5-20 per message. A decline suggests list fatigue, irrelevant segmentation, or offer saturation.
- Customer Lifetime Value (CLV): Automated customer CLV increases by 20-40% compared to organic customers, highlighting the effectiveness of relationship-building. Focusing solely on immediate conversions can lead to missed CLV opportunities.
- Unsubscribe Rates: Rates below 0.5% are acceptable, indicating appropriate frequency and relevance. Rates exceeding 1% signal oversending or content problems.
- Marketing-Attributed Revenue: For mature automation, this should represent 25-40% of total sales, though this can vary. Lower attribution may point to measurement issues or underutilized automation.
- Payback Periods: Periods under six months allow for rapid reinvestment. Longer periods (over nine months) require exceptional CLV to justify the investment.
- Return on Ad Spend (ROAS): A minimum ROAS of 4:1 is targeted for profitability, with 6:1 or higher being excellent. Campaigns consistently below 3:1 ROAS require revision.
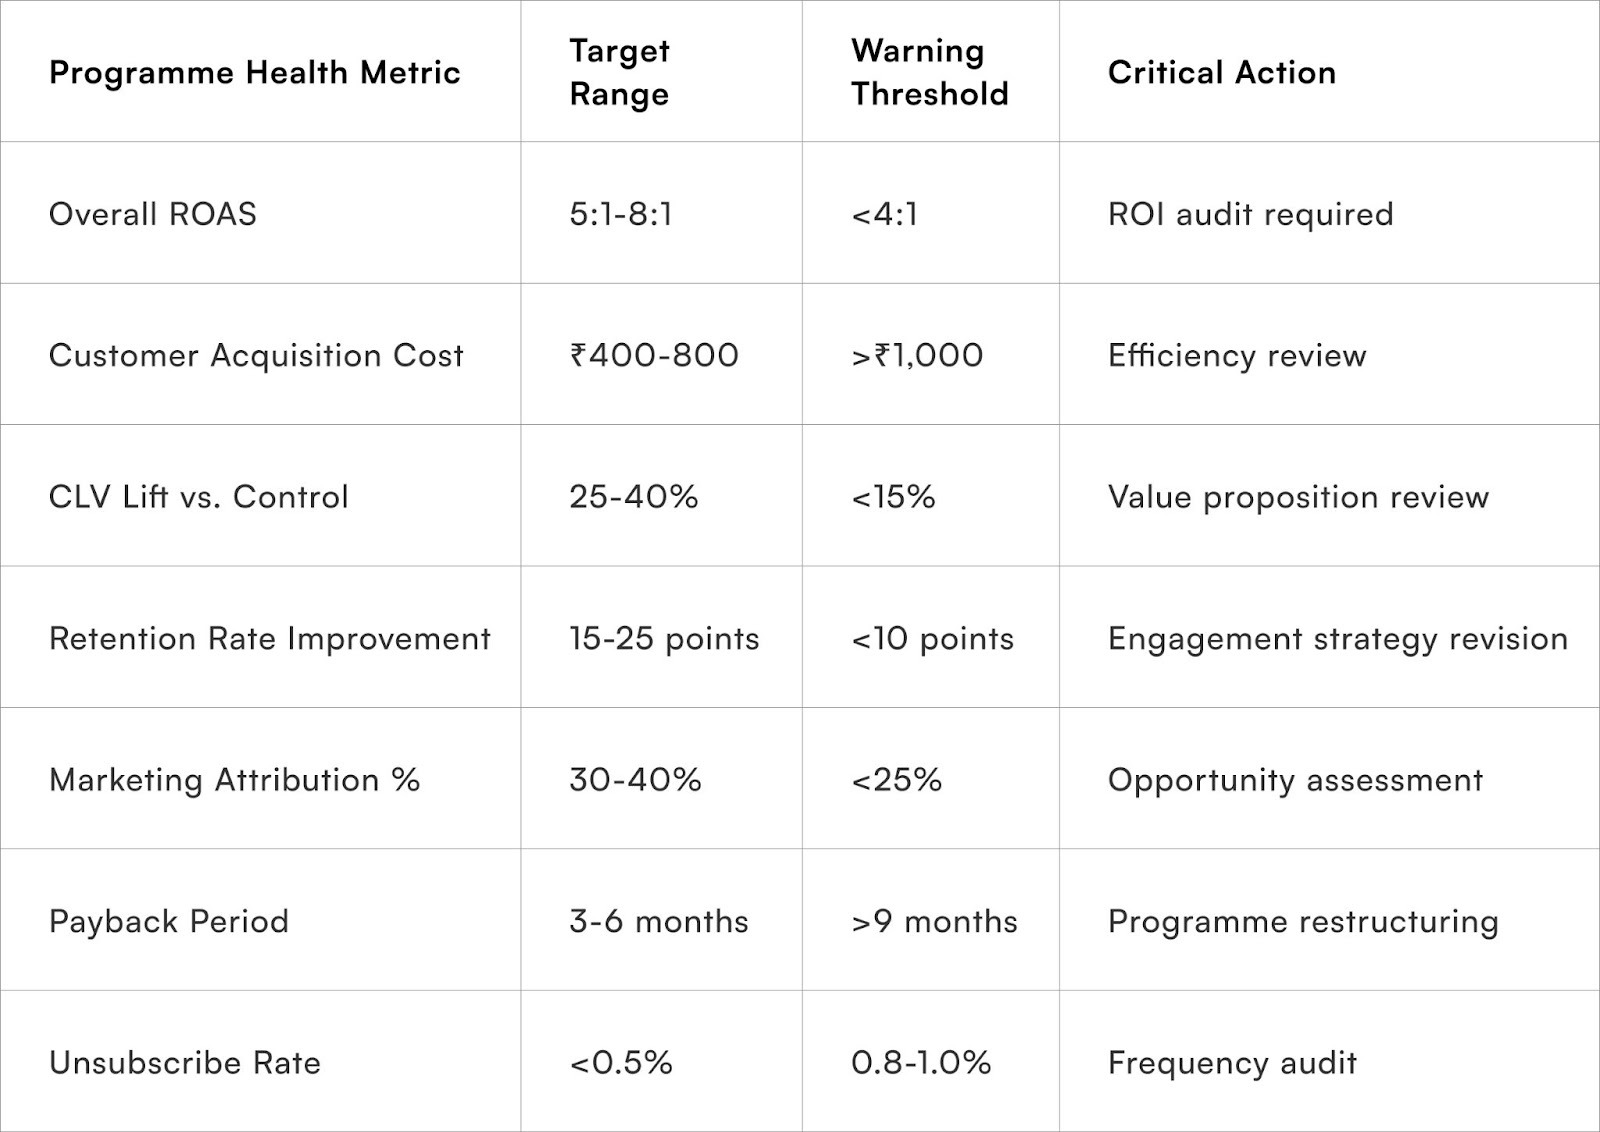
Metrics to Watch for Automation Programme Health
Track comprehensive KPIs measuring financial performance, customer impact, operational efficiency, and strategic alignment to ensure automation investments deliver sustainable business value.
Financial Performance Metrics Monitor overall automation ROAS tracking toward 5:1 minimum targets that ensure profitability after all costs. Declining ROAS triggers investigation into audience fatigue, competitive pressure, or execution quality degradation.
Customer acquisition cost trends reveal whether automation maintains efficiency as programmes scale or whether marginal costs increase with audience expansion. Stable or declining CAC demonstrates sustainable growth whilst increasing costs signal diminishing returns.
Customer Value Indicators Track customer lifetime value improvements comparing automation-influenced customers against control groups or organic acquisition channels. Target CLV lifts of 25-40% demonstrating that automation enhances long-term relationships beyond initial conversions.
Retention rate differences between automated and non-automated customer cohorts prove whether automation builds loyalty or simply accelerates purchases that would have occurred anyway. Retention improvements of 15-25 percentage points justify continued automation investment.
Operational Efficiency Measures Revenue per workflow measures how efficiently individual automation sequences generate returns, enabling portfolio optimisation that doubles down on winners whilst eliminating underperformers. Successful workflows should generate minimum ₹5,00,000 monthly attributed revenue after maturity.
Cost per incremental conversion isolates true efficiency by dividing marginal costs by additional conversions versus baseline performance. This metric reveals genuine improvements that vanity metrics obscure.
Strategic Alignment Indicators Marketing-attributed revenue percentage demonstrates automation's contribution to overall business performance, with healthy programmes generating 30-40% of total sales. Lower percentages suggest untapped automation opportunities.
Payback period trends show whether automation becomes more or less efficient at recouping acquisition investments over time. Shortening payback periods enable faster growth whilst lengthening periods constrain scaling.
Programme Quality Signals Unsubscribe and complaint rates below 0.5% per campaign indicate acceptable message frequency and relevance. Increasing opt-out rates warn of audience fatigue requiring frequency reduction or content refresh.
Engagement rate stability across campaign series reveals whether audiences remain receptive or develop fatigue requiring strategic adjustment. Declining engagement despite stable list quality signals content staleness.
To Wrap It Up
Marketing automation ROI measurement transforms from nebulous challenge to systematic discipline through proper attribution, comprehensive cost accounting, and focus on financial outcomes rather than activity metrics. Brands that master this measurement create competitive advantages through data-driven optimisation that continuously improves returns.
Start by documenting complete automation costs this week including hidden expenses like personnel time and content creation that inflate reported ROI when ignored. Accurate costing provides the foundation for all subsequent measurement improvements.
Effective dashboards balance executive simplicity with operational detail, providing quick status assessments for leadership whilst enabling tactical optimisation for practitioners. Design measurement systems serving multiple stakeholder needs rather than one-size-fits-all approaches satisfying nobody.
Remember that measurement sophistication should match programme maturity—nascent automation efforts need basic ROAS tracking whilst established programmes justify investment in advanced attribution and incremental testing that prove causal impact beyond correlation.
For D2C brands seeking sophisticated measurement capabilities that prove automation value conclusively, Pragma's analytics and attribution platform provides multi-touch attribution, incremental lift testing, and comprehensive ROI dashboards that help brands achieve 5:1+ ROAS through data-driven optimisation whilst satisfying finance accountability requirements through rigorous cost tracking and revenue attribution that connects every rupee invested to measurable business outcomes.
.gif)
FAQs (Frequently Asked Questions on Measuring the ROI of Marketing Automations: JMS Dashboard Essentials)
How long does marketing automation take to show positive ROI?
Most businesses see noticeable ROI improvements within the first year, with small businesses experiencing 25% marketing ROI increases when implementing automation. Full programme maturity requiring 18-24 months delivers optimal returns as workflows refine and customer data accumulates.
Should automation ROI calculations include opportunity costs of alternative investments?
For comprehensive financial analysis, yes—comparing automation returns against alternative marketing investments reveals true opportunity costs. However, for operational dashboards, direct costs and attributed revenue provide sufficient decision-making information without complex counterfactual analysis.
What's the minimum conversion volume needed for reliable attribution modelling?
Data-driven attribution requires minimum 1,000 monthly conversions to detect statistically significant patterns, whilst simpler multi-touch models work with 200-300 monthly conversions. Lower-volume businesses should use position-based or time-decay models until sufficient data accumulates.
Should Indian D2C brands use different ROI benchmarks than global standards?
Yes, adjust benchmarks for India's higher COD rates, different payment preferences, and distinct seasonality patterns. Indian markets often show lower email engagement but higher WhatsApp response rates, requiring localised performance expectations rather than applying US or European benchmarks directly.
Talk to our experts for a customised solution that can maximise your sales funnel
Book a demo
.jpg)

.png)