

Choosing the right carrier for each shipment is more than a contractual or cost decision — it directly affects delivery speed, reliability, and customer experience. Too often, logistics teams rely on historical assumptions, blanket contracts, or anecdotal experience to assign carriers, resulting in delayed deliveries, frustrated buyers, and inefficiencies in operations.
Carrier selection model: scoring carriers by product, pincode and period explores a systematic approach to evaluating and ranking carriers for each shipment. By integrating product characteristics, geographic factors, and temporal trends, teams can predict which carrier will deliver the best outcome in a given scenario.
It explains which signals matter most, how to combine them into actionable scores, and how to operationalise carrier selection at scale. The aim is to enable logistics teams to make data-driven choices that reduce exceptions, optimise transit times, and improve overall fulfilment efficiency.
Why carrier performance varies by product, pincode, and period
Not all carriers perform equally across every scenario
Product characteristics influence carrier suitability
Different products have different handling requirements. Fragile items, perishable goods, and high-value SKUs behave differently in transit. A carrier with excellent speed for small, standard parcels may struggle with heavy or delicate shipments.
Operational teams must consider factors such as:
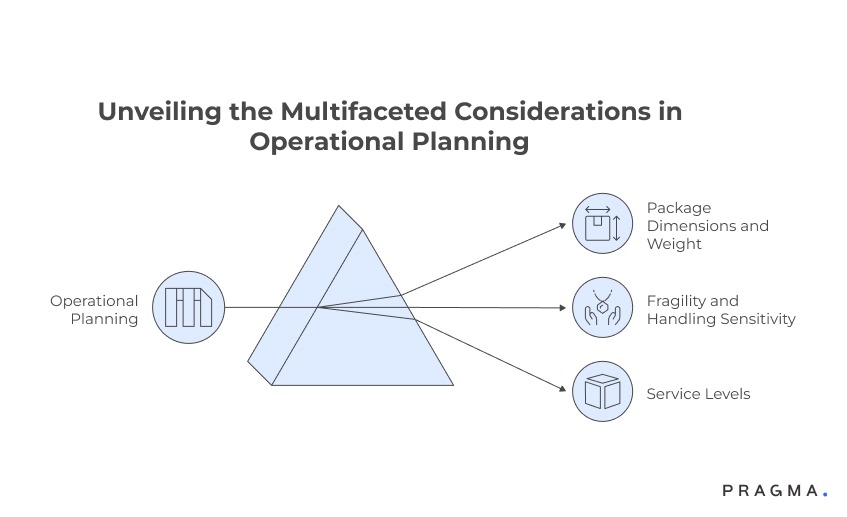
- Package dimensions and weight
- Fragility and handling sensitivity
- Required service levels for perishable or high-value goods
Matching carrier capabilities to product needs
A high-speed courier may be inappropriate for fragile items if it has a higher damage rate. Conversely, a carrier known for careful handling may take longer for low-risk parcels. The scoring model ensures product characteristics weigh appropriately in carrier ranking.
Geographic factors shape delivery outcomes
Pincode-level performance varies due to urban congestion, local courier infrastructure, and regional operational challenges. A carrier might be reliable in metro areas but underperform in Tier-2 and Tier-3 cities.
Using granular pincode data
By scoring carriers at the pincode level, teams can identify pockets of high and low performance. This enables precise routing decisions that maximise speed and reliability across regions.
Seasonal and temporal patterns affect reliability
Performance is not static — peak periods, festivals, and adverse weather affect carrier reliability. Historical data shows that some carriers maintain consistency, while others experience spikes in delays or failures.
Incorporating period-based scoring
The model tracks carrier performance over time, adjusting scores based on seasonal trends. This ensures carriers are selected based on realistic expectations for the given delivery window.
The operational impact of misaligned carrier choice
Poor carrier selection leads to delayed deliveries, increased return-to-origin (RTO) rates, and higher customer complaints. Each misalignment creates ripple effects for the warehouse, customer service, and fulfillment teams.
Quantifying the cost of wrong decisions
By modelling past performance against outcomes, teams can calculate expected delays, RTO risk, and associated operational costs — all of which feed into the scoring model to prioritise carriers effectively.
Designing a carrier scoring model
Translating data into actionable carrier rankings
Core metrics to include
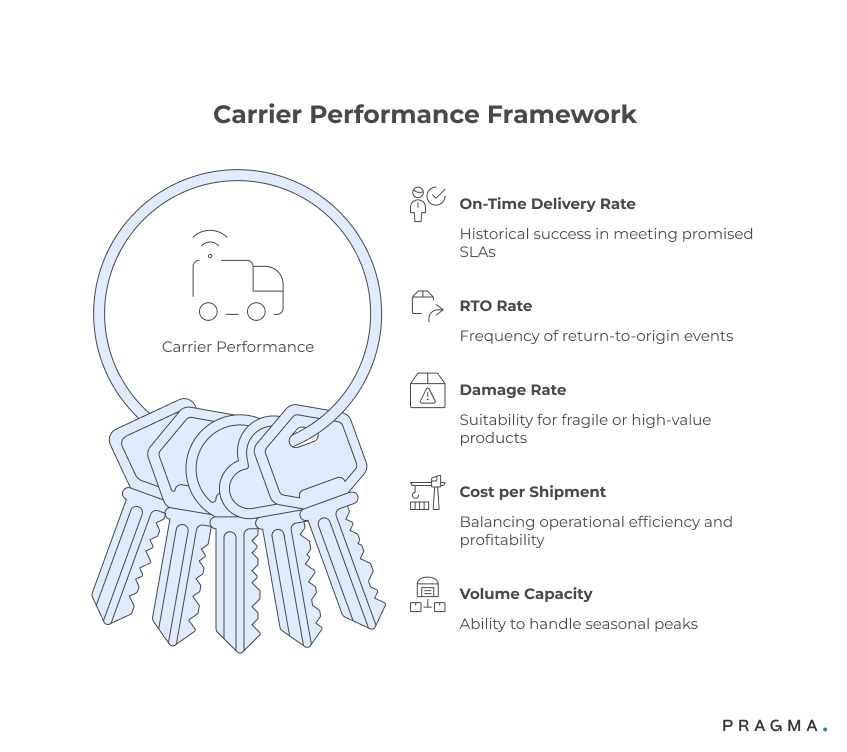
A robust scoring model combines multiple operational KPIs to evaluate carriers holistically. Key metrics include:
- On-time delivery rate – historical success in meeting promised SLAs
- RTO rate – frequency of return-to-origin events for different shipment types
- Damage rate – suitability for fragile or high-value products
- Cost per shipment – balancing operational efficiency and profitability
- Volume capacity – ability to handle seasonal peaks
Weighting metrics by product, region, and period
Not all metrics matter equally in every scenario. For fragile items, damage rate may be weighted higher than cost. In high-density urban areas, on-time delivery may take precedence over RTO. Temporal trends also influence weighting during peak sale periods.
Combining scores into a unified ranking
Once weighted, individual metrics are normalised and aggregated into a single carrier score per product-pincode-period combination. This produces a ranked list that can be operationally used for automated routing or decision support.
Dynamic updates maintain relevance
Carrier performance changes over time. Scores should be recalculated periodically using the latest operational data, ensuring the system adapts to seasonal patterns, new service providers, or regional disruptions.
Sample carrier scoring framework
Translating metrics into actionable values
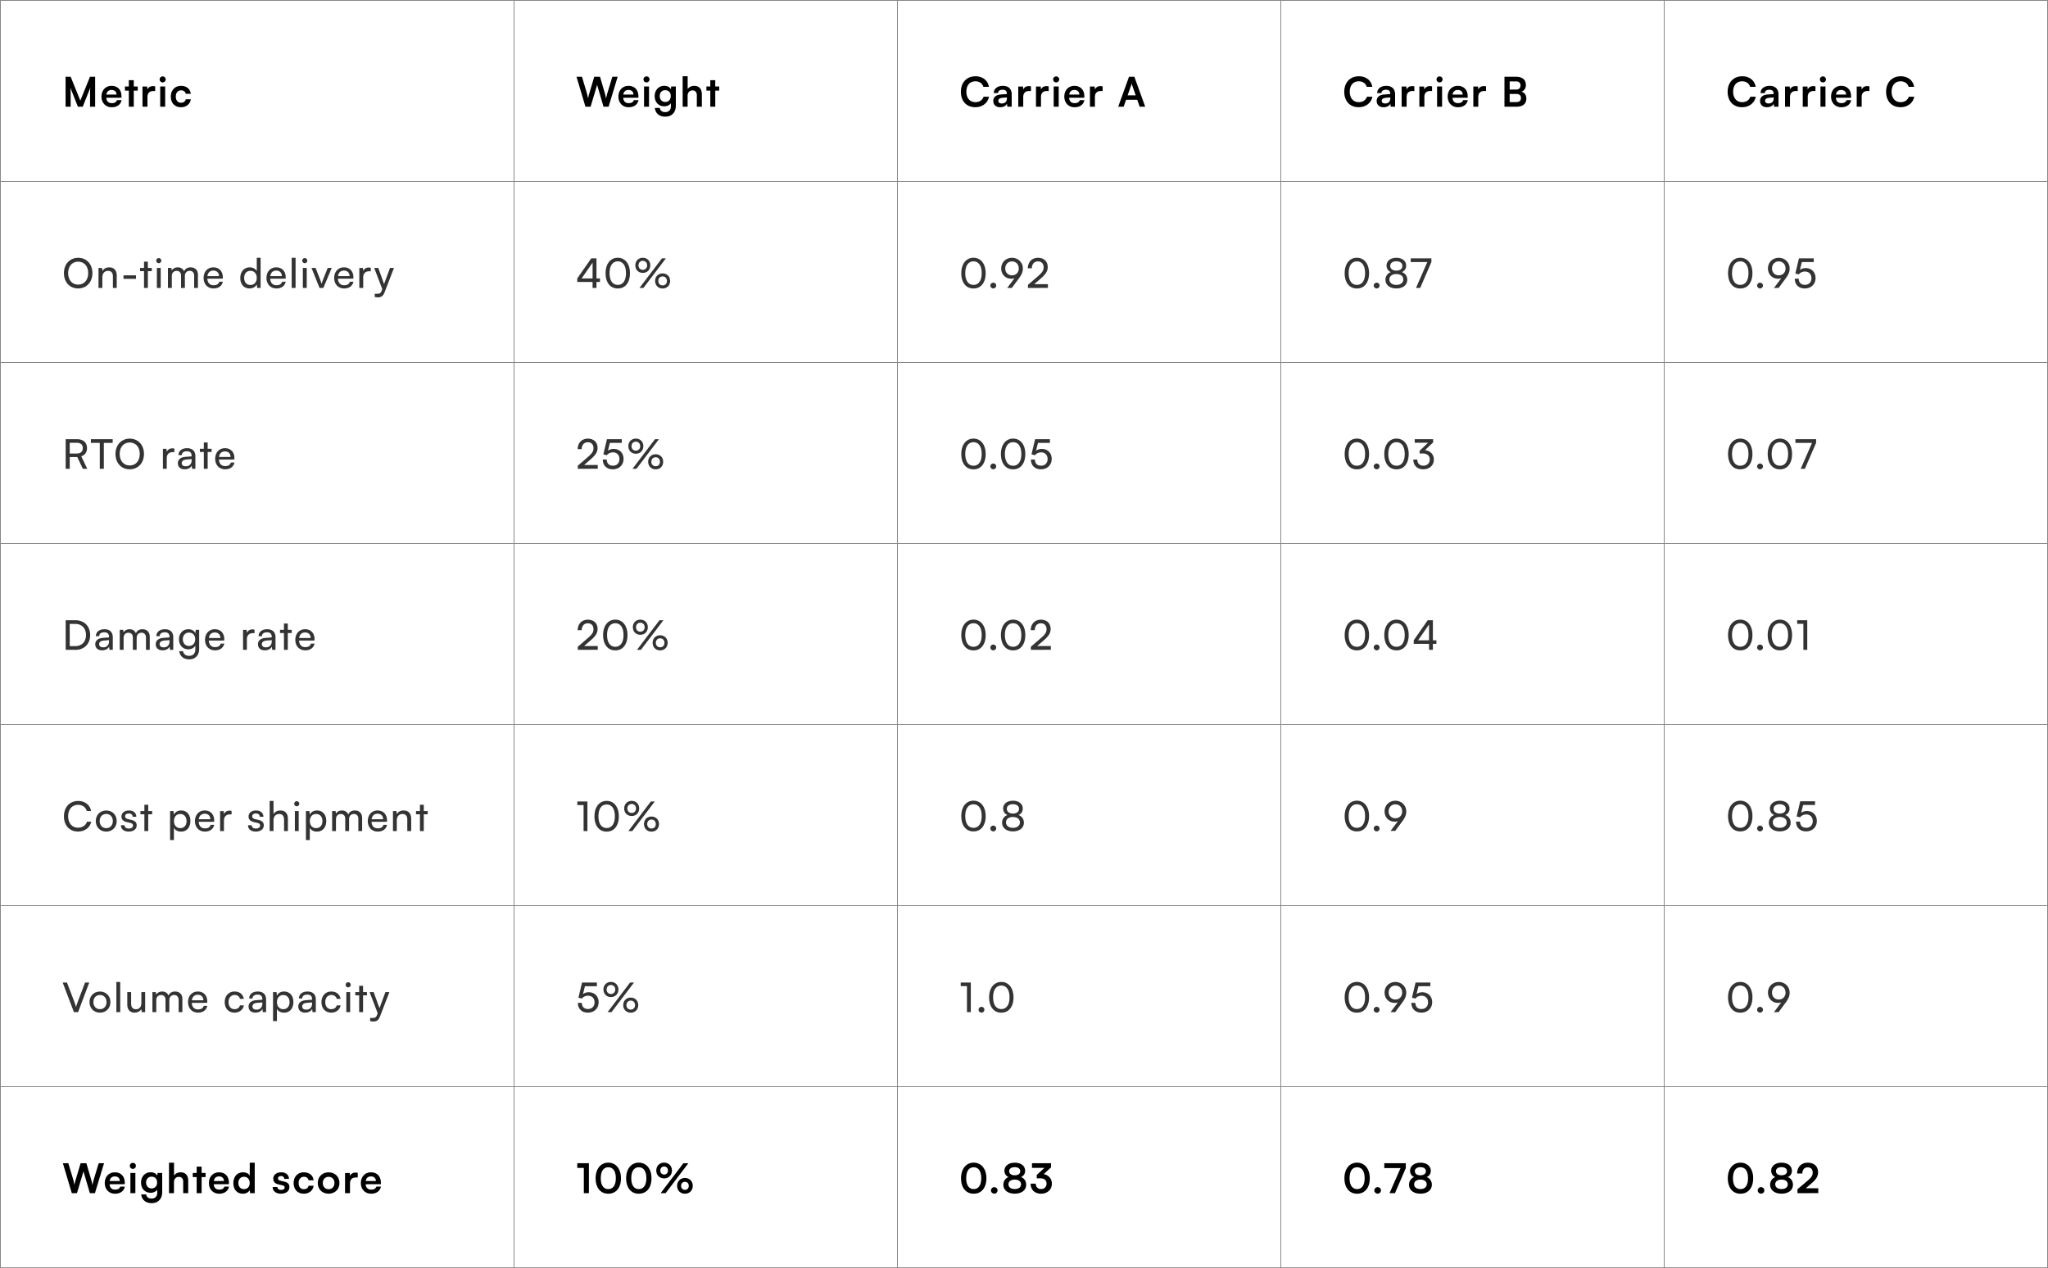
This framework provides a clear, repeatable way to prioritise carriers for each shipment type and region.
Guardrails for operational adoption
Ensuring carrier selection remains practical and scalable
Avoid overfitting to historical anomalies
Extreme past events, such as one-off strikes or natural disasters, should be flagged but not overweighted in scoring. Otherwise, the model penalises carriers unfairly.
Incorporate business rules
Certain carriers may have contractual obligations or restricted service areas. Rules should override model scores when necessary to ensure compliance.
Monitor downstream KPIs
Carrier scoring should be linked to measurable outcomes: delivery SLAs met, RTO reduction, and damage rates. Regular monitoring validates that the model drives operational improvements rather than just producing numbers.
Scaling across product lines and regions
For large D2C operations, hundreds of products across thousands of pincodes need carrier scoring. Automation is key:
- Precompute scores per product-pincode-period combination
- Integrate into routing or WMS systems for automated carrier assignment
- Refresh scores weekly or monthly depending on volume and seasonality
Handling exceptions gracefully
When a preferred carrier is unavailable, fallback carriers should be selected based on next-best scores, ensuring minimal disruption without human intervention.
Accounting for seasonal volume fluctuations
Carrier performance changes under load
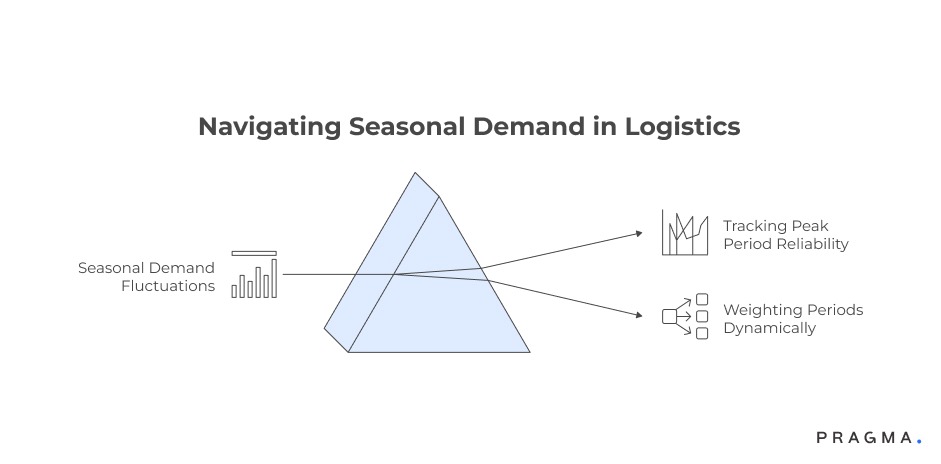
Tracking peak period reliability
Carriers often maintain excellent service in normal months but fail during sales events, festivals, or unexpected demand spikes. Using historical peak-period data allows teams to anticipate bottlenecks and adjust scores accordingly.
Weighting periods dynamically
A carrier’s reliability during the next sale window can be assigned higher importance than its long-term average. This avoids surprises and maintains SLA adherence during critical periods.
Continuous improvement through feedback loops
Carrier scoring is not static — learning ensures ongoing optimisation
Closing the loop with operational outcomes
Monitor delivery completion, RTO rates, and customer complaints for each assigned shipment. Feed these results back into the scoring model to refine weights, detect emerging patterns, and adjust rankings over time.
Benefits of iterative refinement
Continuous feedback ensures the model adapts to changing carrier performance, new service offerings, or geographic expansion. Teams gradually reduce exceptions, optimise costs, and improve buyer satisfaction without manual intervention.
Quick wins for implementing carrier scoring in live operations
Practical steps to move from intuition to data-backed routing
Week 1: Baseline carrier performance by pincode and product
Start by pulling 60–90 days of shipment data and segment it by product type, pincode cluster, and carrier. Focus on three metrics only: on-time delivery, RTO rate, and damage incidents.
The goal this week is not modelling sophistication, but visibility. Teams should be able to clearly see where the same carrier behaves very differently across regions or products.
Week 2: Introduce simple weighted scores
Apply basic weights to the three metrics based on business priorities. For example, fragile products get higher weight on damage rate, while COD-heavy regions prioritise RTO.
At the end of this week, logistics teams should have a ranked carrier list per segment — even if it lives in a spreadsheet initially.
Week 3: Pilot automated assignment with guardrails
Use the scores to auto-assign carriers for a limited subset of orders or regions. Keep manual override rules active for capacity constraints and contractual obligations.
By the end of 30 days, teams should see early improvements in SLA adherence and fewer preventable exceptions.
Metrics that validate carrier scoring impact
What to track once the model is live
Carrier scoring only matters if it improves outcomes. The following metrics help validate whether the model is working in real operations.
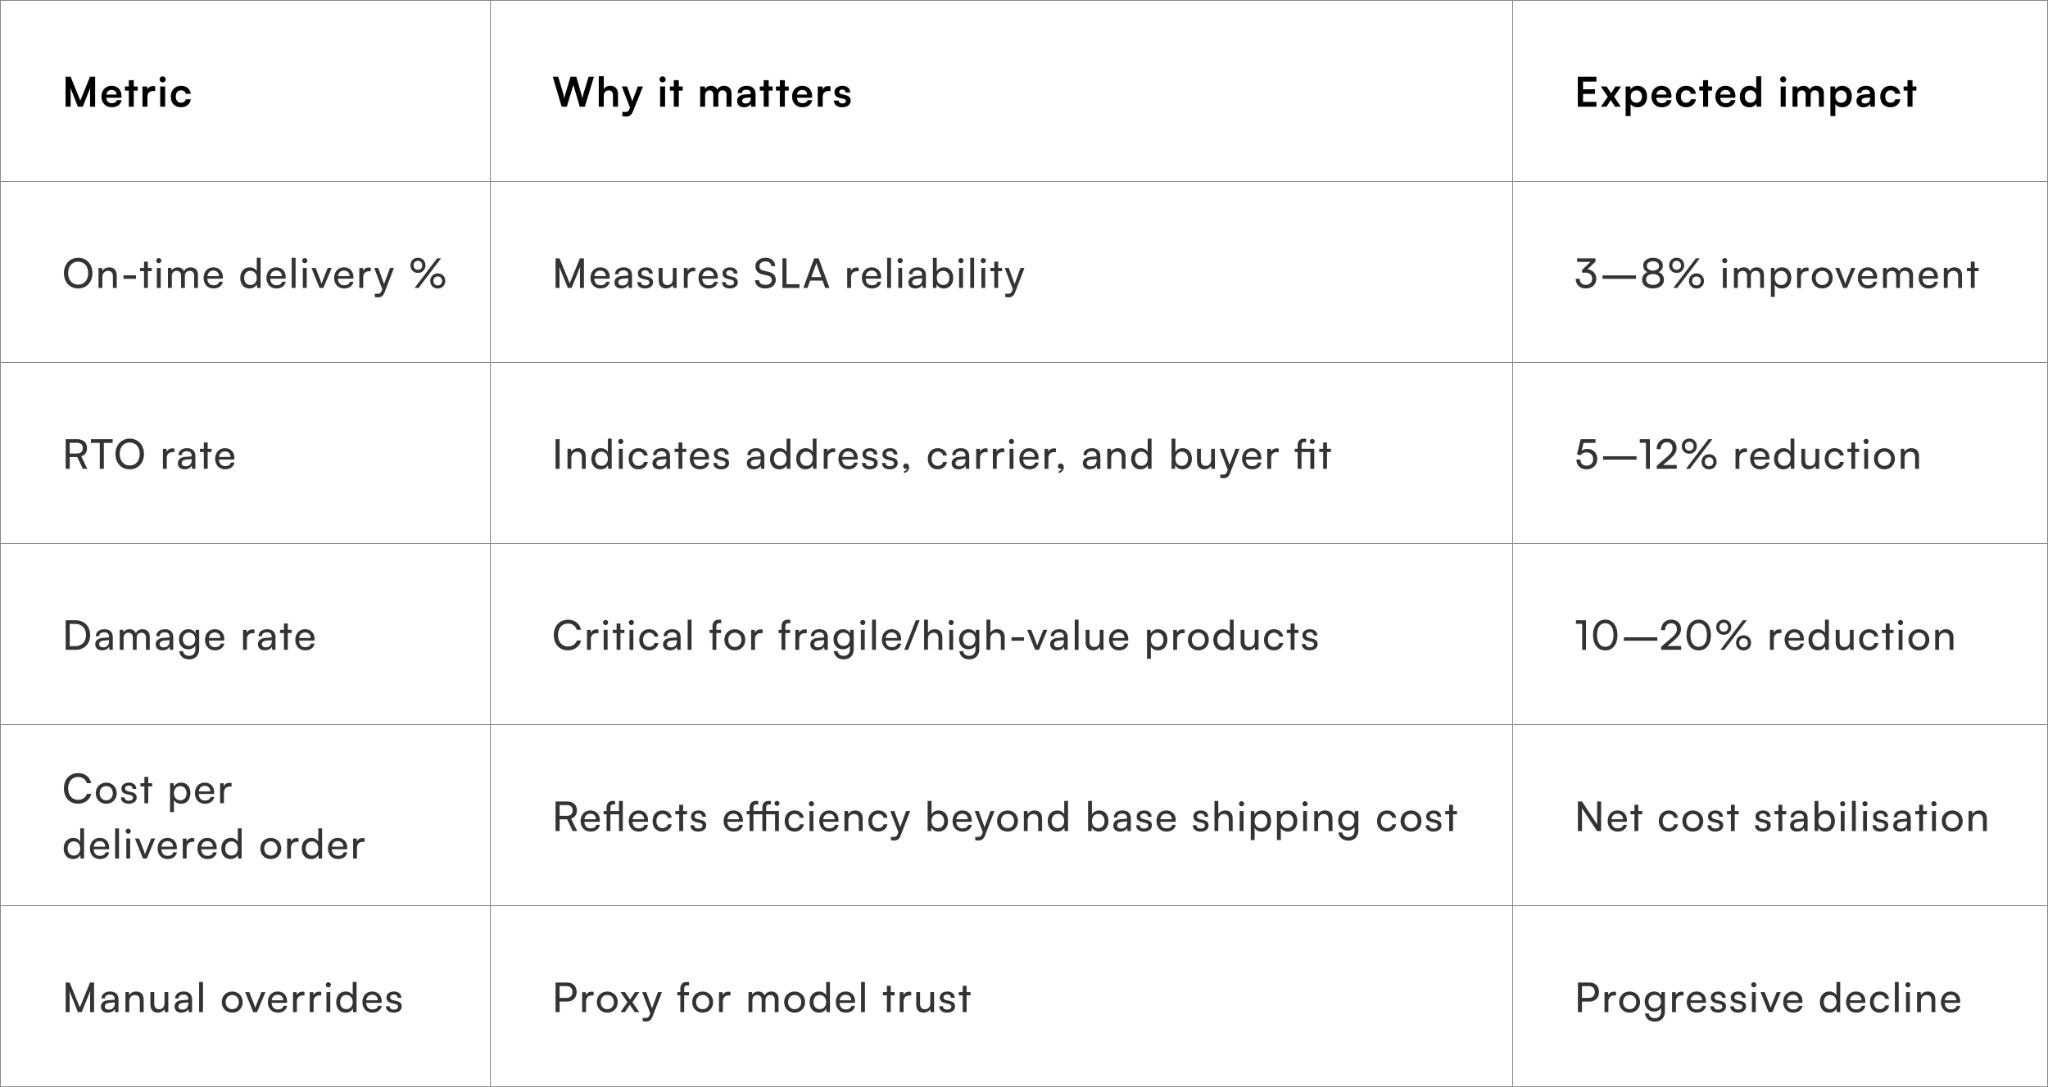
Tracking these weekly ensures the scoring model remains accountable to business outcomes rather than theoretical accuracy.
To Wrap It Up
Carrier selection becomes unreliable when it is driven by averages, contracts, or instinct. Scoring carriers by product, pincode, and period introduces discipline into a decision that directly affects cost, SLAs, and customer trust.
This week, audit your top three carriers by region and product to uncover mismatches hidden by aggregate metrics.
Over the long term, continuously refining carrier scores with operational feedback allows logistics teams to adapt to seasonality, expansion, and changing buyer behaviour without increasing manual effort.
For D2C brands seeking consistent delivery performance at scale, Pragma’s logistics orchestration platform provides carrier scoring, dynamic routing, and real-time performance monitoring that help brands reduce RTOs, improve SLAs, and scale fulfilment with confidence.
.gif)
FAQs (Frequently Asked Questions On Carrier selection model: scoring carriers by product, pincode and period)
1. What is a carrier selection model in logistics?
A carrier selection model scores and ranks delivery partners using data-driven criteria.It helps choose the most suitable carrier for each shipment.
2. Why is scoring carriers important?
Scoring enables objective comparison based on performance, cost, and reliability.
It improves delivery outcomes and operational efficiency.
3. How does product type influence carrier selection?
Different products require specific handling, packaging, and delivery capabilities.
Carriers are scored based on their suitability for each product category.
4. What role does pincode play in the model?
Pincode-level data reflects regional delivery performance and success rates.It helps select carriers with proven reliability in specific locations.
5. How does the time period affect carrier performance?
Carrier efficiency can vary by season, demand cycles, or peak periods.Incorporating time-based trends improves scoring accuracy.
6. What factors are included in carrier scoring?
Factors include delivery success rate, transit time, cost, RTO rate, and SLA compliance.
These metrics are weighted to generate a composite score.
7. How are weights assigned in the scoring model?
Weights are aligned with business priorities such as speed, cost, or reliability.
They determine the relative importance of each factor.
8. Can the model adapt to real-time performance changes?
Yes, it can integrate real-time data to adjust scores dynamically.This ensures more accurate and responsive carrier selection.
9. How does this model reduce delivery failures?
It selects carriers with strong performance for specific products and regions.This lowers failure rates and improves customer satisfaction.
10. Is automation required for carrier scoring?
Automation enables large-scale, real-time scoring and decision-making.
Manual methods are less efficient and harder to scale.
11. What data is needed to build this model?
Data such as shipment history, carrier performance, product attributes, and regional trends is essential.High-quality data ensures accurate scoring and better outcomes.
Talk to our experts for a customised solution that can maximise your sales funnel
Book a demo

.webp)
.png)