

Cash on Delivery (COD) remains the dominant mode of payment for Indian online shoppers, driving as much as 60% of e-commerce transactions—even as digital payments boom in metros and urban centres.
While COD builds initial trust and reaches underpenetrated markets, it also comes with its own set of challenges:
- Higher return-to-origin (RTO) rates
- Operational overhead
- Payment risk
- And longer cash cycles.
For brands, the real opportunity lies not in eliminating COD but in dynamically nudging cash-first shoppers towards safer, prepaid options—while boosting conversion rates for those who stick with cash.
This blog on Smart Checkout Nudges: Proven Strategies to Convert Cash-First Shoppers unpacks actionable strategies and practical nudges to convert hesitant, cash-preferred shoppers into confident digital payers,without creating friction or risking cart abandonment.
Step inside to see what works, what doesn’t, and how leading Indian D2C and e-commerce brands are using behavioural insights and data-driven techniques to change payment habits at scale.
Why do Indian customers default to COD despite prepaid advantages?
Risk aversion stemming from trust deficits creates payment method lock-in requiring explicit intervention
The choice of payment method is a complex psychological process driven by a balance of perceived convenience, risk, and trust.
Simply offering incentives often fails because comprehensive "nudge" strategies are required to address these underlying drivers for cash-on-delivery (COD) preference.
Core Psychological Drivers for COD Preference:
Product Uncertainty (Quality Verification):
Customers, especially those making a first-time purchase with a brand lacking an established trust history, use COD as insurance.
It allows them to inspect the item upon delivery and reject unsatisfactory, wrong, or damaged goods, directly addressing worries about products not matching online descriptions.
Refund Anxiety (Perceived Financial Risk):
The fear of lengthy or complicated refund processes transforms prepaid payments into a capital risk. With many brands maintaining an average refund timeline of 12-18 days, this concern is rational and acts as a significant barrier to prepaid adoption.
Digital Payment Skepticism:
Negative experiences, such as failed transactions, accidental double charges, or unclear payment confirmations, foster distrust in online payments. Each incident reinforces the perception of COD as a safer, less technically complicated alternative.
Spending Control Psychology (Deferred Pain):
For budget-conscious shoppers, COD is appealing because it defers the financial impact. Unlike prepaid, which results in an instant account deduction, COD delays this "pain" until product receipt, making the purchase feel less consequential during the decision-making moment.
Perceived Complexity:
Customers often view COD as the path of least resistance—a simple, single-click process—compared to the higher cognitive load of navigating a payment gateway, entering OTPs, and waiting for confirmation with prepaid options.
Social Proof:
When COD is the dominant payment method among a customer's social circle (friends, family, neighbors), it becomes a normalised and preferred default rather than a fallback option.
Evidence from Customer Research:
A survey of customers from Jaipur home goods brands quantified these concerns, confirming that COD preference is rooted primarily in psychological factors rather than infrastructure constraints (only 8% cited lacking digital payment capability). The key drivers identified were:
- 47%: Refund concerns
- 32%: Desire for product quality verification
- 28%: Previous digital payment problems
- 24%: Prepaid options found more complicated
- 19%: Value in spending control timing
This data suggests that meaningful behavior shift can be achieved through checkout nudges specifically designed to mitigate these psychological barriers.
What specific checkout interface nudges improve prepaid conversion?
Strategic positioning of trust signals, incentives, and comparison information shifts payment decisions at critical moments
Proven Strategies for Converting Cash-First Shoppers: Smart Checkout Nudges
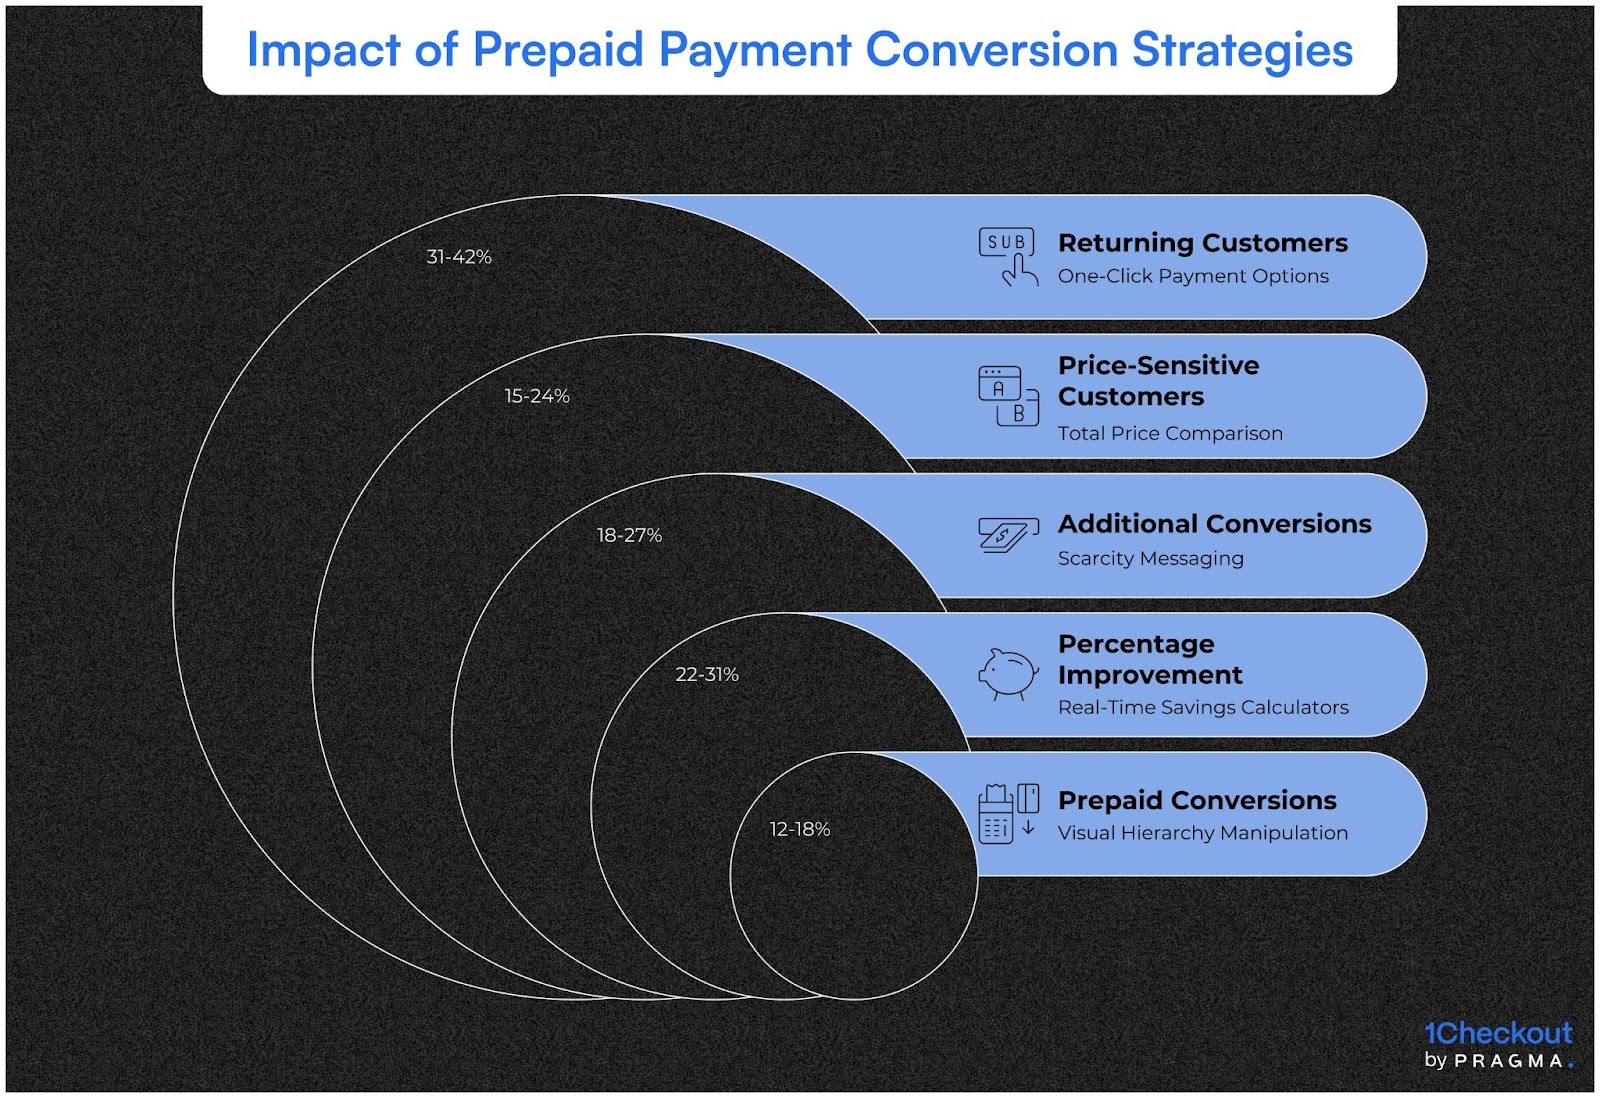
- Visual Hierarchy Manipulation:
- Implementation: Position prepaid options above COD, using larger buttons and accent colours.
- Impact: 12-18% lift in prepaid conversions.
- Real-Time Savings Calculators:
- Implementation: Display the exact rupee amount saved (e.g., "You save ₹280 by choosing prepaid") instead of generic percentages.
- Impact: 22-31% improvement compared to percentage-based messaging.
- Trust Badges:
- Implementation: Place security assurances (e.g., "Secure Payment," "Refunds in 3-5 days") near payment options to reduce anxiety.
- Impact: Particularly effective for new customers.
- Total Price Comparison:
- Implementation: Transparently show a side-by-side breakdown revealing hidden COD costs (e.g., "Prepaid: ₹2,800 | COD: ₹2,940 (includes ₹140 handling fee)").
- Impact: 15-24% shift of price-sensitive customers.
- Social Proof Displays:
- Implementation: Leverage herd behaviour with messages like "78% of customers chose prepaid for this product" or "4,200 customers paid online today."
- Impact: Especially powerful for those with COD default tendencies.
- Scarcity Messaging:
- Implementation: Create urgency by linking prepaid selection to exclusive benefits (e.g., "Free shipping only available for prepaid orders").
- Impact: 18-27% additional conversions.
- Pre-Selected Payment Defaults:
- Implementation: Default to prepaid methods (UPI or saved cards), ensuring a clear COD option remains available. (Must be ethical.)
- Impact: Shifts substantial volume by utilising status quo bias.
- One-Click Payment Options:
- Implementation: For returning customers, enable single-click prepaid completion to match the simplicity of COD.
- Impact: 31-42% shift of returning customers.
Case Study: Layered Nudge Implementation
A personal care brand's comprehensive strategy included:
- Prominently positioning UPI with a large button.
- Displaying a dynamic "Save ₹215" calculator.
- Adding a "Refunds in 3 days" badge.
- Showing a total price comparison highlighting a ₹140 COD fee.
- Displaying "68% chose prepaid today" social proof.
- Offering free shipping exclusively for prepaid orders.
- Enabling one-click UPI for returning customers.
- Result: Prepaid penetration improved from 38% to 67% without impacting overall cart conversion rates.
How should incentive structures balance margin preservation with conversion goals?
Strategic discount calibration maximises prepaid shift whilst maintaining acceptable unit economics
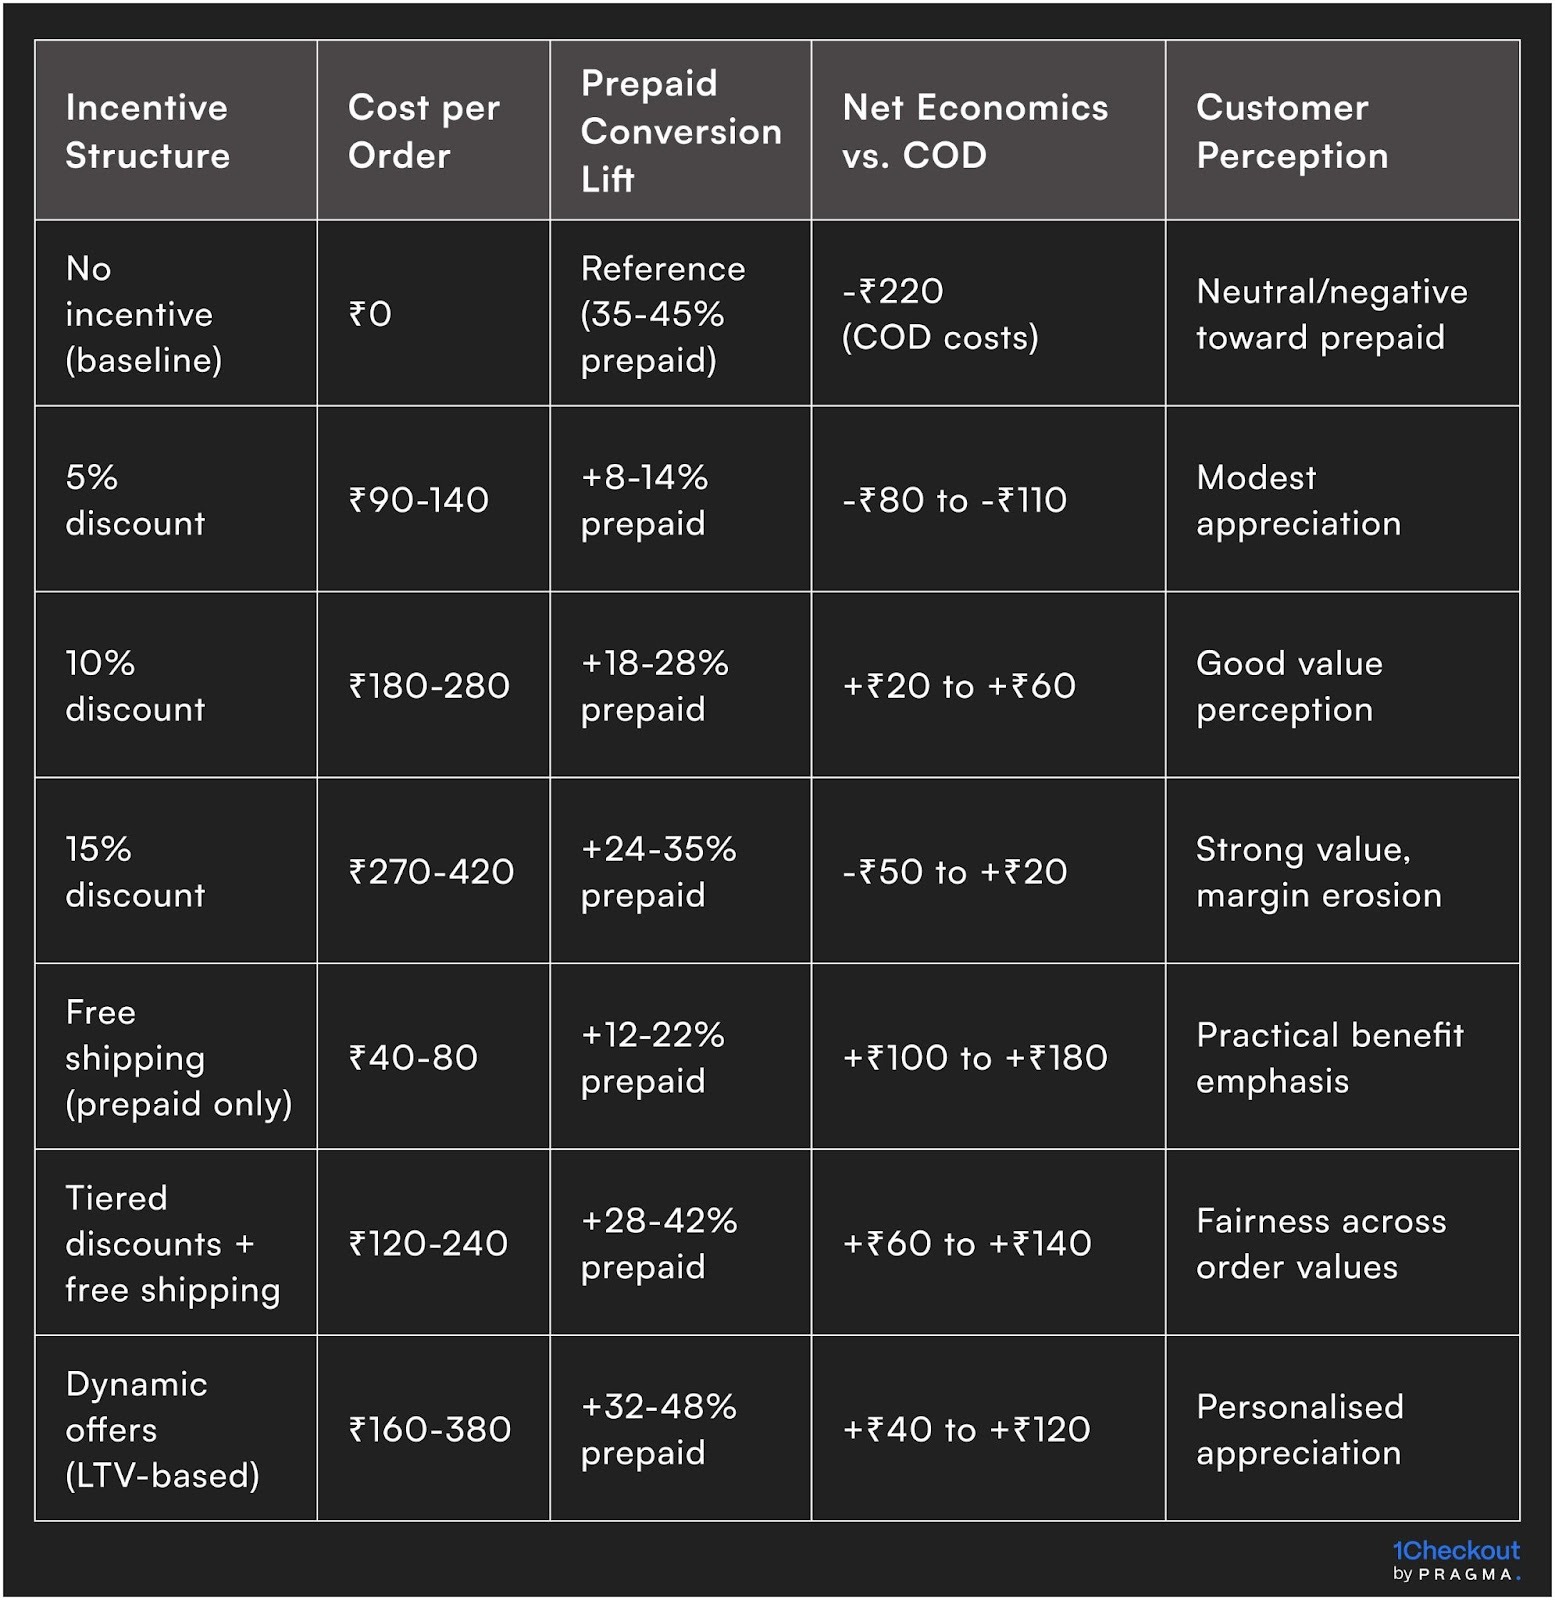
Prepaid discounts represent direct margin trade-offs requiring optimisation between conversion improvement and profitability maintenance. Understanding elasticity curves and customer segmentation enables intelligent incentive structuring.
Discount depth experimentation reveals optimal threshold points. Testing 5%, 10%, 15%, and 20% discounts typically shows diminishing returns beyond 12-15% as incremental conversion gains decline whilst margin erosion accelerates. Most brands find 10-12% discounts maximise net contribution after accounting for both discount costs and COD expense savings.
Absolute rupee discounts often outperform percentage-based offers for specific price ranges. "Save ₹200 on prepaid" proves more compelling than "10% off" for ₹2,000 orders despite identical economics. The concrete rupee amount feels more tangible than abstract percentages, improving conversion particularly among less price-conscious segments.
Tiered incentive structures align discount depth with order value protecting margins on low-ticket transactions. Offering ₹50 off for orders under ₹1,000, ₹150 off for ₹1,000-3,000, and ₹300 off above ₹3,000 maintains percentage consistency whilst appearing more generous at higher values where COD savings justify deeper discounts.
Non-discount value additions preserve margins whilst creating prepaid preference. Free shipping exclusively for prepaid orders costs brands ₹40-80 versus ₹180-340 COD logistics costs, creating attractive customer value proposition whilst improving unit economics. Gift-with-purchase, loyalty points, or extended warranties provide similar value-at-lower-cost alternatives.
Time-limited urgency amplifies discount effectiveness. "Extra 5% off prepaid for next 2 hours" creates scarcity driving immediate decision-making. This temporal urgency combined with base discounts generates 18-28% higher prepaid conversion than permanent discount offers without urgency components.
Customer lifetime value informed incentives justify deeper discounts for high-potential customers. First-time buyers receiving 15% prepaid discounts convert to future prepaid users at 68% rates versus 34% for first-time COD users. Investing aggressively in initial payment method establishment pays dividends through improved economics on subsequent purchases.
A/B testing quantifies actual incrementality. Not all prepaid conversions represent true incremental shift—some customers would have chosen prepaid without incentives. Testing discount presence versus absence reveals that typical 10% offers generate 60-75% incremental conversions whilst 25-40% would have selected prepaid regardless, informing cost-benefit analyses.
Hyderabad electronics brands demonstrate sophisticated incentive optimisation. They offer 8% base prepaid discount for all orders, add ₹100 flat discount for first-time prepaid users, provide free shipping (₹60 value) exclusively for prepaid, create 2-hour countdown timers adding 2% urgency bonus, and grant 2x loyalty points on prepaid orders. This layered structure costs ₹168 per converted order on average yet saves ₹295 in avoided COD costs, generating positive ₹127 net benefit whilst improving prepaid penetration from 42% to 71%.
Why do some nudge implementations increase cart abandonment despite higher prepaid rates?
Poorly designed interventions create friction or perceived manipulation that damages overall conversion
Risks and Failure Modes in Checkout Nudge Implementation
- Excessive Interruptions:
Multiple, aggressive pop-ups (e.g., "Switch to prepaid?", "Get 10% off!") interrupt the flow of a quick transaction. Each additional modal significantly increases the probability of abandonment (8-15%) as perceived obstacles multiply.
- Overwhelming Cognitive Load:
Complex comparison displays, such as tables featuring 6-8 payment options with numerous benefit dimensions, confuse rather than clarify. Customers under the inherent stress of checkout often abandon rather than process complicated information.
- Asymmetric Friction (Forced Account Creation):
Requiring prepaid customers to create an account while allowing guest checkout for Cash on Delivery (COD) creates an unfair convenience disadvantage for prepaid. This uneven requirement can drive 22-34% of potential prepaid users to abandon their purchase.
- Trust-Damaging Dark Patterns:
Manipulative tactics are quickly detected and cause immediate backlash. Examples include hiding COD options, making COD buttons small or grey, pre-selecting prepaid without clear disclosure, or using misleading cost comparisons. Customers encountering these tactics often abandon their current session and avoid future transactions.
- Technical Abandonment from Lengthy Redirects:
Selecting a prepaid method only to face a 5-8 second wait for the payment gateway to load creates anxiety. If redirects fail or take too long, customers often revert to COD to avoid technical complications.
- Confusing Incentive Complexity:
Conditional offers that require interpretation (e.g., "Get 10% off plus free shipping if order exceeds ₹1,500 and you pay via UPI before midnight") create cognitive burden. Uncertainty about offer mechanics often leads customers to default to the familiar COD option.
- Mobile Optimisation Failures:
Nudges designed for desktop that render poorly on mobile (e.g., overlapping elements, tiny buttons) create significant technical friction. Given that 78-86% of checkouts occur on mobile, this platform mismatch is a major cause of failure.
Case Study: The Cost of Poor Implementation
A key lesson was learned by jewellery brands in Pune. Their initial, flawed strategy involved:
- Adding three separate prepaid discount pop-ups.
- Displaying a 7-row payment comparison table.
- Mandating account creation for all prepaid methods.
- Using a small, grey COD button to suggest deprecation.
The Result: While the prepaid rate improved from 34% to 49%, the overall cart conversion rate plummeted from 68% to 51%. The 17-point increase in abandonment eliminated any economic benefit from the shift in payment mix.
The Successful Refinement: After simplifying the approach to a single, subtle nudge, allowing voluntary account creation, and presenting options fairly, they achieved a vastly superior net outcome: a 58% prepaid rate with a 64% overall conversion rate.
How do regional and demographic factors influence nudge effectiveness?
Customer technology comfort and shopping motivations create heterogeneous responses requiring tailored approaches
Checkout nudge effectiveness varies substantially across Indian market segments due to divergent technology adoption, shopping contexts, and economic priorities. Understanding these variations enables targeted optimisation rather than uniform approaches that optimise for averages whilst failing in key segments.
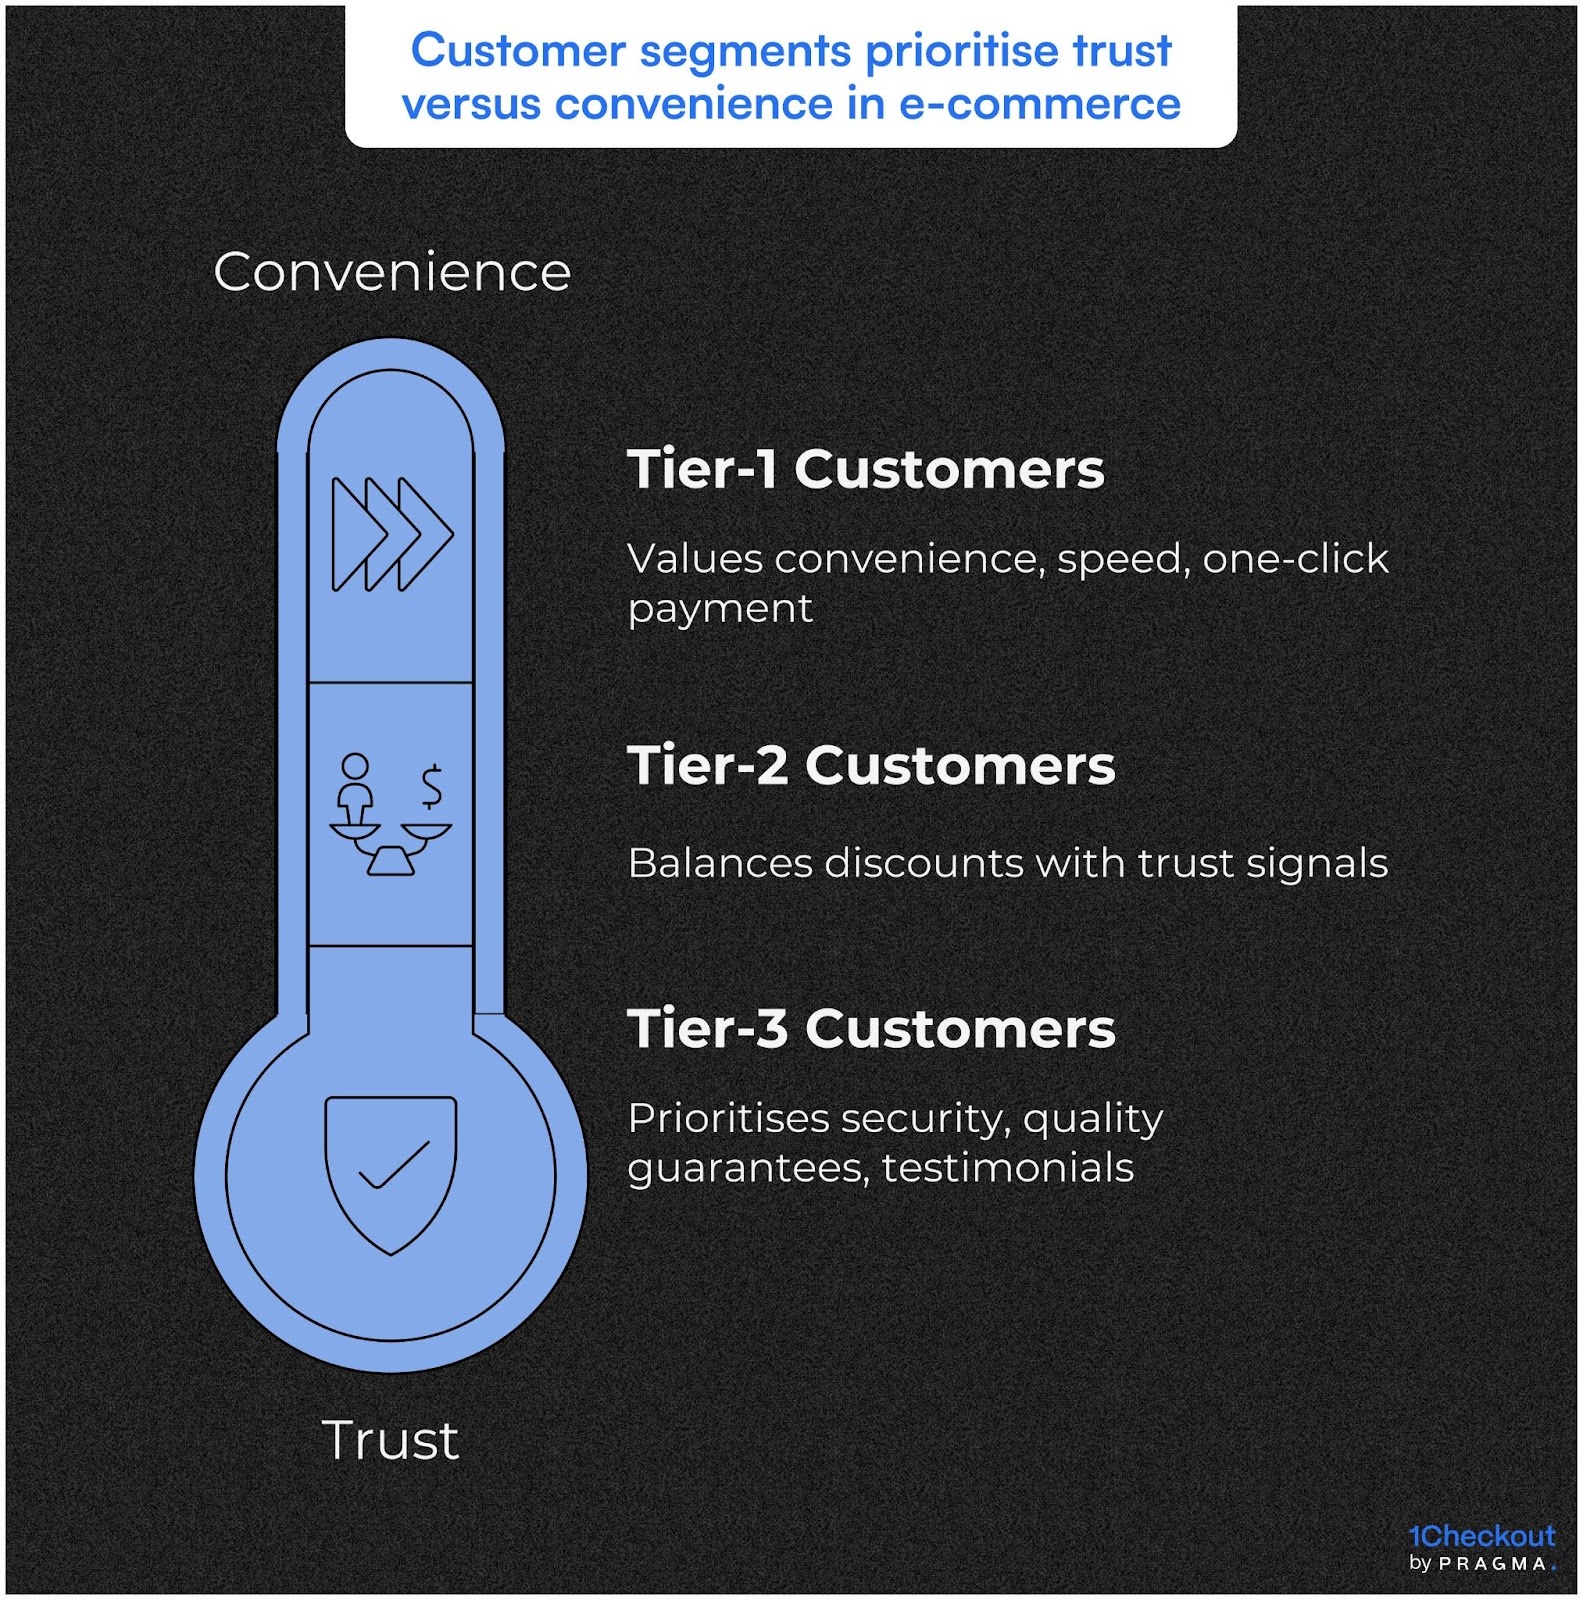
Metropolitan tier-1 customers respond strongly to convenience and speed messaging. These customers possess high digital payment comfort, value time savings, and show less price sensitivity. Nudges emphasising one-click payment, faster delivery for prepaid, or premium service access generate 28-36% prepaid lifts. Discount depth matters less than frictionless experience for this segment.
Tier-2 city customers show balanced responsiveness. They appreciate both financial incentives and trust signals. Nudges combining moderate discounts (10-12%) with prominent refund guarantees and security certifications achieve optimal results generating 22-31% prepaid improvements. This segment demonstrates practical decision-making weighing multiple factors rather than optimising single dimension.
Tier-3 and rural customers require strongest trust emphasis. Limited e-commerce experience and lower digital payment familiarity create legitimate concerns. Nudges should prioritise security messaging, quality guarantees, and customer testimonials over aggressive discounting. Language localisation proves particularly important—displaying nudges in Hindi, Tamil, or other regional languages significantly improves effectiveness in these markets.
Segmented Nudge Strategies for Converting Cash-First Shoppers
1. Demographic Factors
- Age: Younger customers (under 30) are highly receptive to gamification, social proof, and modern payment methods like UPI.
In contrast, older customers (40+) respond better to traditional trust signals, detailed explanations of the process, and readily available phone support. A multi-generational approach that accommodates these differences optimises overall conversion. - Gender: While differences are modest, female customers show a slightly stronger positive response to messaging focused on safety and security.
Male customers respond marginally better to messaging emphasising speed and efficiency. However, gender-neutral messaging that highlights both dimensions generally performs well and avoids stereotypical targeting.
2. Transaction-Related Factors
- Order Value: Customer sensitivity to nudges varies significantly with the order amount:
- Small Orders (under ₹500): Nudge responsiveness is minimal; customers typically choose familiar COD for minor purchases.
- Mid-Range Orders (₹1,500–₹5,000): This range shows peak nudge effectiveness, as the amount is significant enough to warrant consideration of alternative payment options.
- Very High Orders (above ₹10,000): Discount sensitivity decreases, but the importance of strong trust signals increases. At premium price points, customers prioritise assurance over savings.
- Small Orders (under ₹500): Nudge responsiveness is minimal; customers typically choose familiar COD for minor purchases.
- Product Category: Payment preferences are influenced by the product:
- Fashion and Beauty: These categories have a high baseline COD preference (58–72%) due to customers' desire to verify fit and quality, thus requiring stronger nudges.
- Electronics: With standardised products reducing the need for inspection, baseline COD is lower (38–52%), making even modest nudges highly effective.
- Home Goods: These categories fall in between, necessitating a balanced approach.
- Fashion and Beauty: These categories have a high baseline COD preference (58–72%) due to customers' desire to verify fit and quality, thus requiring stronger nudges.
3. The Power of Customisation: A Case Study
A prime example is the approach taken by Surat textile brands, who moved from a uniform nudging strategy (which yielded 43% overall prepaid) to a segmented one, achieving 62% overall prepaid conversion. Their tailored interventions include:
- Metro Customers: Emphasising one-click UPI and speed benefits, resulting in 74% prepaid conversion.
- Tier-2 Customers: Using balanced messaging that combines a 12% discount with trust signals, leading to 58% prepaid conversion.
- Tier-3 Customers: Focusing on security assurance and testimonials, often delivered in Hindi, achieving 41% prepaid conversion.
- Age-Based Segmentation: Young customers are offered gamified loyalty points, while older customers receive detailed process explanations.
This case study clearly demonstrates the significant value of customised, tailored interventions over "one-size-fits-all" strategies.
Wins from Smart Checkout Nudges for Online Purchases
Week 1: Analyse Current Checkout Payment Selection Patterns
Extract 90 days of checkout data calculating prepaid percentage overall and segmented by customer type (first-time vs. repeat), order value bands, geography, and device type.
Calculate cart abandonment rates at payment selection step. Survey 30-50 recent customers about payment method choice reasoning—why they selected COD or prepaid, what concerns influenced decisions, what would make them choose differently. Interview support team about common customer questions regarding payment options.
Expected result: Detailed understanding of current payment mix, abandonment patterns, and primary psychological barriers to prepaid adoption specific to your customer base.
Week 2: Implement Total Price Comparison Display
Add transparent cost comparison at payment selection showing prepaid total versus COD total including all fees—"Prepaid: ₹2,800 | COD: ₹2,940 (includes ₹140 COD fee)." Ensure mobile rendering clarity given 80%+ mobile checkout volumes.
Configure for all orders showing any COD fee differential. Deploy to 50% of checkout sessions maintaining 50% control group for impact measurement. Track prepaid rate and cart conversion rate daily by variant.
Expected result: 12-18% improvement in prepaid selection among treatment group with maintained or improved overall conversion through transparent cost communication.
Week 3: Deploy Dynamic Savings Calculator
Implement real-time calculator displaying exact rupee savings for prepaid selection based on current cart value—"Pay online and save ₹280."
Position prominently near payment options with accent colour drawing attention. Include brief trust signal subtext—"Secure payment • Refunds in 3-5 days." Test multiple messaging variants if resources permit—"Save ₹X" vs. "Get ₹X off" vs. "Keep ₹X." Monitor engagement and conversion impact across variants.
Expected result: Additional 10-16% prepaid lift from concrete savings visibility with minimal abandonment impact given clear value communication.
Week 4: Add Social Proof and Trust Signals
Display dynamic social proof message showing prepaid adoption rate—"78% of customers chose prepaid today" or "[X] customers paid securely today." Position security badges and refund guarantee messaging near payment options addressing anxiety concerns.
Test multiple social proof framings—percentage vs. absolute numbers, generic vs. product-specific. Measure impact on prepaid conversion particularly among first-time customers who lack experiential trust.
Expected result: 8-14% prepaid improvement especially among new customers, with strongest impact in segments showing highest initial COD preference through trust barrier reduction.
To Wrap It Up
Smart checkout nudges shift payment method selection from perceived fixed customer preference into malleable outcome responsive to strategic intervention through addressing underlying psychological barriers—trust deficits, refund anxiety, and convenience perceptions—that drive COD preference despite prepaid's economic advantages for both customers and brands.
The combination of transparent cost displays, concrete savings quantification, trust signal positioning, and intelligent incentive structures generates 25-45% prepaid conversion improvements whilst maintaining or improving overall cart completion rates through genuine value communication rather than manipulative tactics.
This week, implement transparent total price comparison showing prepaid total versus COD total with all fees included, and add a dynamic savings calculator displaying exact rupee amounts saved through prepaid selection, to demonstrate immediate 15-25% prepaid conversion lift through clear economic visibility addressing the cost opacity that enables irrational COD preference.
A Sustainable checkout excellence requires treating payment mix optimisation as continuous experimentation discipline rather than one-time implementation project.
For D2C brands seeking to transform payment mix from operational constraint into strategic advantage, Pragma's checkout optimisation platform provides A/B testing infrastructure, behavioural nudge templates, and real-time analytics that help brands achieve 55-70% prepaid penetration whilst maintaining or improving overall cart conversion through scientifically validated interventions balancing persuasion with transparency, generating 15-30% contribution margin improvements through systematic payment method optimisation that reduces RTO exposure and logistics costs whilst preserving customer trust and long-term relationship quality.

FAQs (Frequently Asked Questions On Smart Checkout Nudges: Proven Strategies to Convert Cash-First Shoppers)
1. Do checkout nudges manipulate customers unethically or simply inform better decisions?
Ethical nudges transparently present information enabling informed choices—showing total costs, highlighting refund speeds, displaying security certifications. Unethical dark patterns hide options, create false scarcity, or mislead about costs.
The distinction lies in respecting customer autonomy whilst reducing information gaps that lead to suboptimal decisions. Properly implemented nudges help customers understand true economics and risks, allowing them to select options genuinely better for their circumstances rather than manipulating choices against their interests.
2. What prepaid conversion rate should D2C brands target as realistic goal?
Target benchmarks vary by market positioning and customer base, but mature brands should aim for 55-70% prepaid penetration through systematic optimisation. Metro-focused brands can achieve 70-80%, whilst brands serving significant tier-2/3 audiences might plateau at 45-60%.
The key metric is improvement trajectory—moving from 35% to 55% prepaid represents massive economic gain even if absolute rate remains below some competitors. Focus on continuous improvement rather than arbitrary absolute targets misaligned with your specific customer demographics.
3. Can brands completely eliminate COD or will some customers always require it?
COD will always serve legitimate use cases—customers without digital payment access, those in areas with payment infrastructure gaps, or situations where COD genuinely proves optimal. Rather than eliminating COD entirely (which alienates legitimate users), brands should aim for appropriate mix given their customer base.
Achieving 70-80% prepaid while serving remaining 20-30% via COD balances economics with accessibility. Some brands implement minimum order values for COD (₹800-1,200) filtering low-value orders whilst maintaining access for genuine need cases.
4. What prevents customers from gaming prepaid discounts by choosing prepaid then cancelling?
Multiple safeguards exist—prepaid orders show dramatically lower cancellation rates (2-6%) versus COD (28-38%) because payment commitment creates completion motivation. Brands can implement cancellation penalties for repeat offenders, track customer-level behavior patterns, or require account verification for large discounts.
In practice, fraud from discount abuse proves minimal (under 1% of transactions) because prepaid payment creates genuine commitment psychology whilst cancellation creates hassle. The benefits vastly outweigh rare gaming attempts
Talk to our experts for a customised solution that can maximise your sales funnel
Book a demo.png)
.webp)
.png)