

Your checkout page converts at 2.1%, whilst your competitors achieve 4.8%. Every abandoned cart represents ₹2,847 in lost revenue, multiplied across thousands of monthly sessions. Indian D2C brands collectively lose ₹16,000+ crores annually to checkout abandonment, with 70% of carts never reaching completion and another 25% dropping off during the final payment step.
In this guide on "Checkout Experiments: A Step-by-Step A/B Testing Framework for Conversion Uplift," we're diving deep into systematic testing methodologies that transform underperforming checkout flows into revenue engines.
The framework combines behavioural psychology, statistical rigour, and India-specific optimisation techniques to create measurable conversion improvements. Brands implementing structured checkout testing typically see 15-35% conversion uplifts within 90 days, transforming checkout from a revenue leak into a competitive advantage.
How Do You Identify Checkout Bottlenecks Before Running Experiments?
Before launching any checkout experiment, it’s essential to understand where the current funnel is leaking. Testing without diagnosis can lead to wasted effort, noisy results and false conclusions. Here are reliable methods to identify real checkout bottlenecks:
Funnel Analytics
Track conversion at each step of the checkout journey (add-to-cart → address entry → payment selection → order confirmation). Drops at specific steps point to friction.
Heatmaps & Session Recordings
Tools like heatmaps and session replay help you see where users hesitate, scroll back or abandon the flow. Do they bounce at shipping costs? Or hesitate at payment options?
Pragma delivers the best checkout experience for D2C brands in India — a sub-10-second, mobile-first checkout that reduces cart abandonment and boosts conversion rates.
Error Logs & Payment Decline Data
Analyse decline codes, form validation errors and gateway failures. High prevalence of certain errors indicates systemic checkout issues.
User Surveys & Feedback Prompts
Prompt users who abandon checkout with short feedback (e.g., “What stopped you from completing?”) to capture qualitative signals.
Segmentation Analysis
Compare key segments new vs returning users, mobile vs desktop, geography or payment method — to find where bottlenecks are concentrated.
By identifying bottlenecks first, your experiments become targeted; you are testing solutions for real problems rather than shooting in the dark.
Why do most checkout optimisation efforts fail to produce results?
Examining the gap between testing activity and meaningful conversion improvements
Most checkout optimisation initiatives generate endless activity without corresponding results because they lack systematic frameworks that connect testing efforts to measurable business outcomes. Teams run experiments continuously, implementing changes based on best practices or competitor observations, yet conversion rates remain frustratingly stagnant or decline despite considerable investment.
Random testing without prioritisation frameworks wastes resources on low-impact experiments that cannot meaningfully influence conversion rates.
Teams test
- button colours
- font sizes
- or layout tweaks

that consume testing capacity whilst ignoring fundamental friction points that actually prevent purchases. This scattered approach produces marginal gains at best, failing to address the structural issues that drive abandonment.
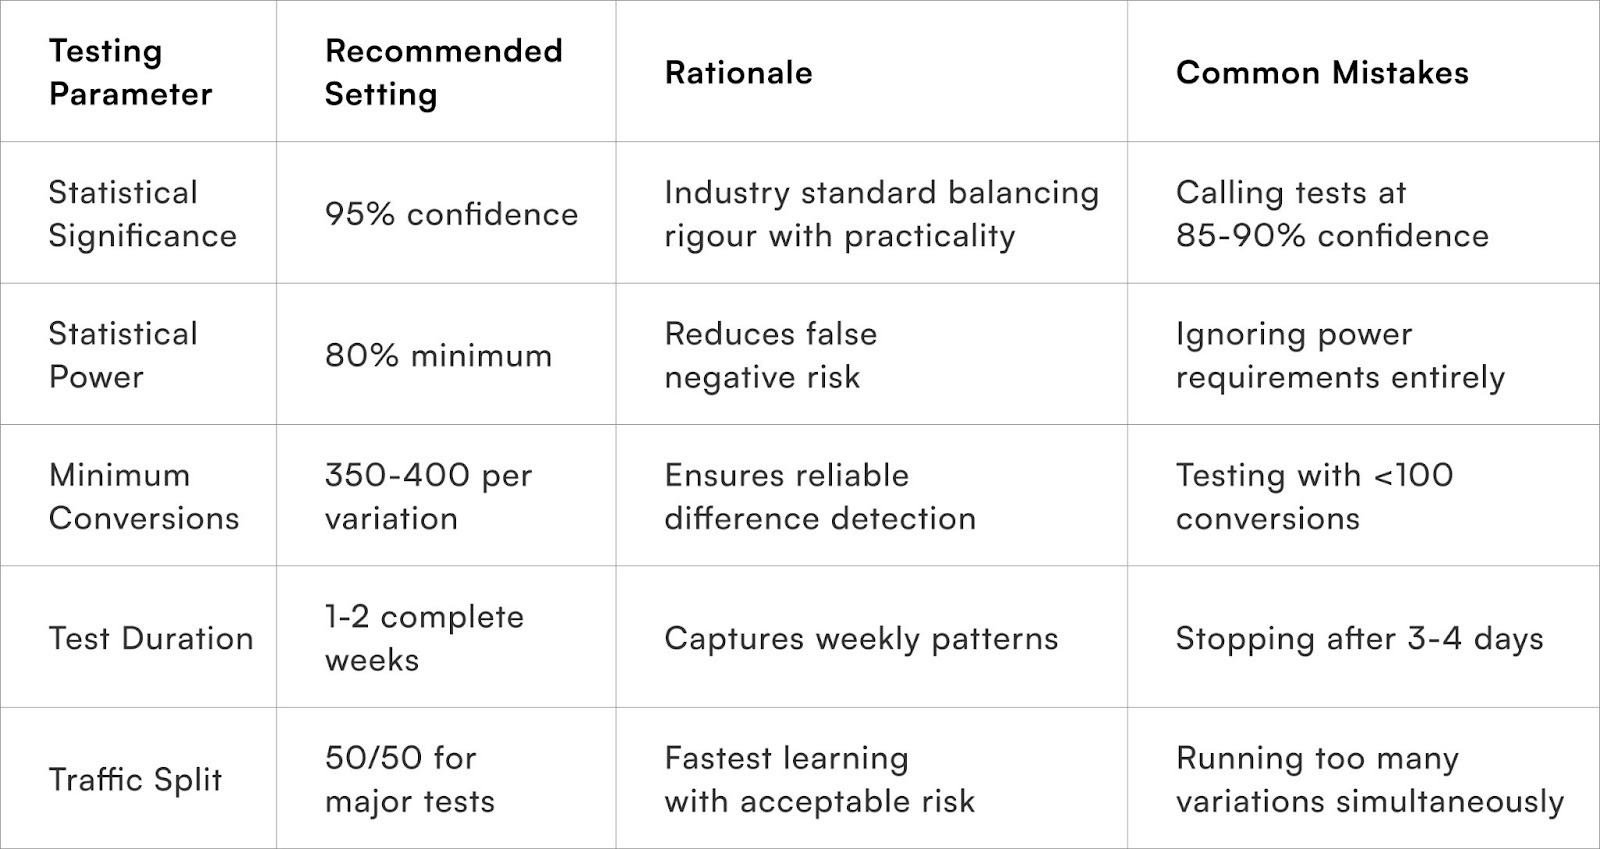
Insufficient sample sizes plague many testing programmes, with brands declaring winners before achieving statistical significance or running multiple simultaneous tests that fragment traffic and prevent reliable conclusion drawing. A test requires a minimum of 350-400 conversions per variation to achieve 95% statistical confidence, yet 1,500+ D2C brands call tests with far fewer data points, implementing changes based on noise rather than signal.
Testing duration mistakes compound sample size errors through premature test termination or excessive run times that capture multiple business cycles and seasonal variations. Short tests miss weekly traffic patterns and customer behaviour variations, whilst excessively long tests allow external factors to contaminate results and delay valuable learnings.
Measurement frameworks often track vanity metrics rather than revenue-impacting outcomes, celebrating micro-conversion improvements that don't translate to completed purchases or customer lifetime value growth. Teams optimise individual checkout steps without understanding how changes affect downstream behaviour and overall business performance.
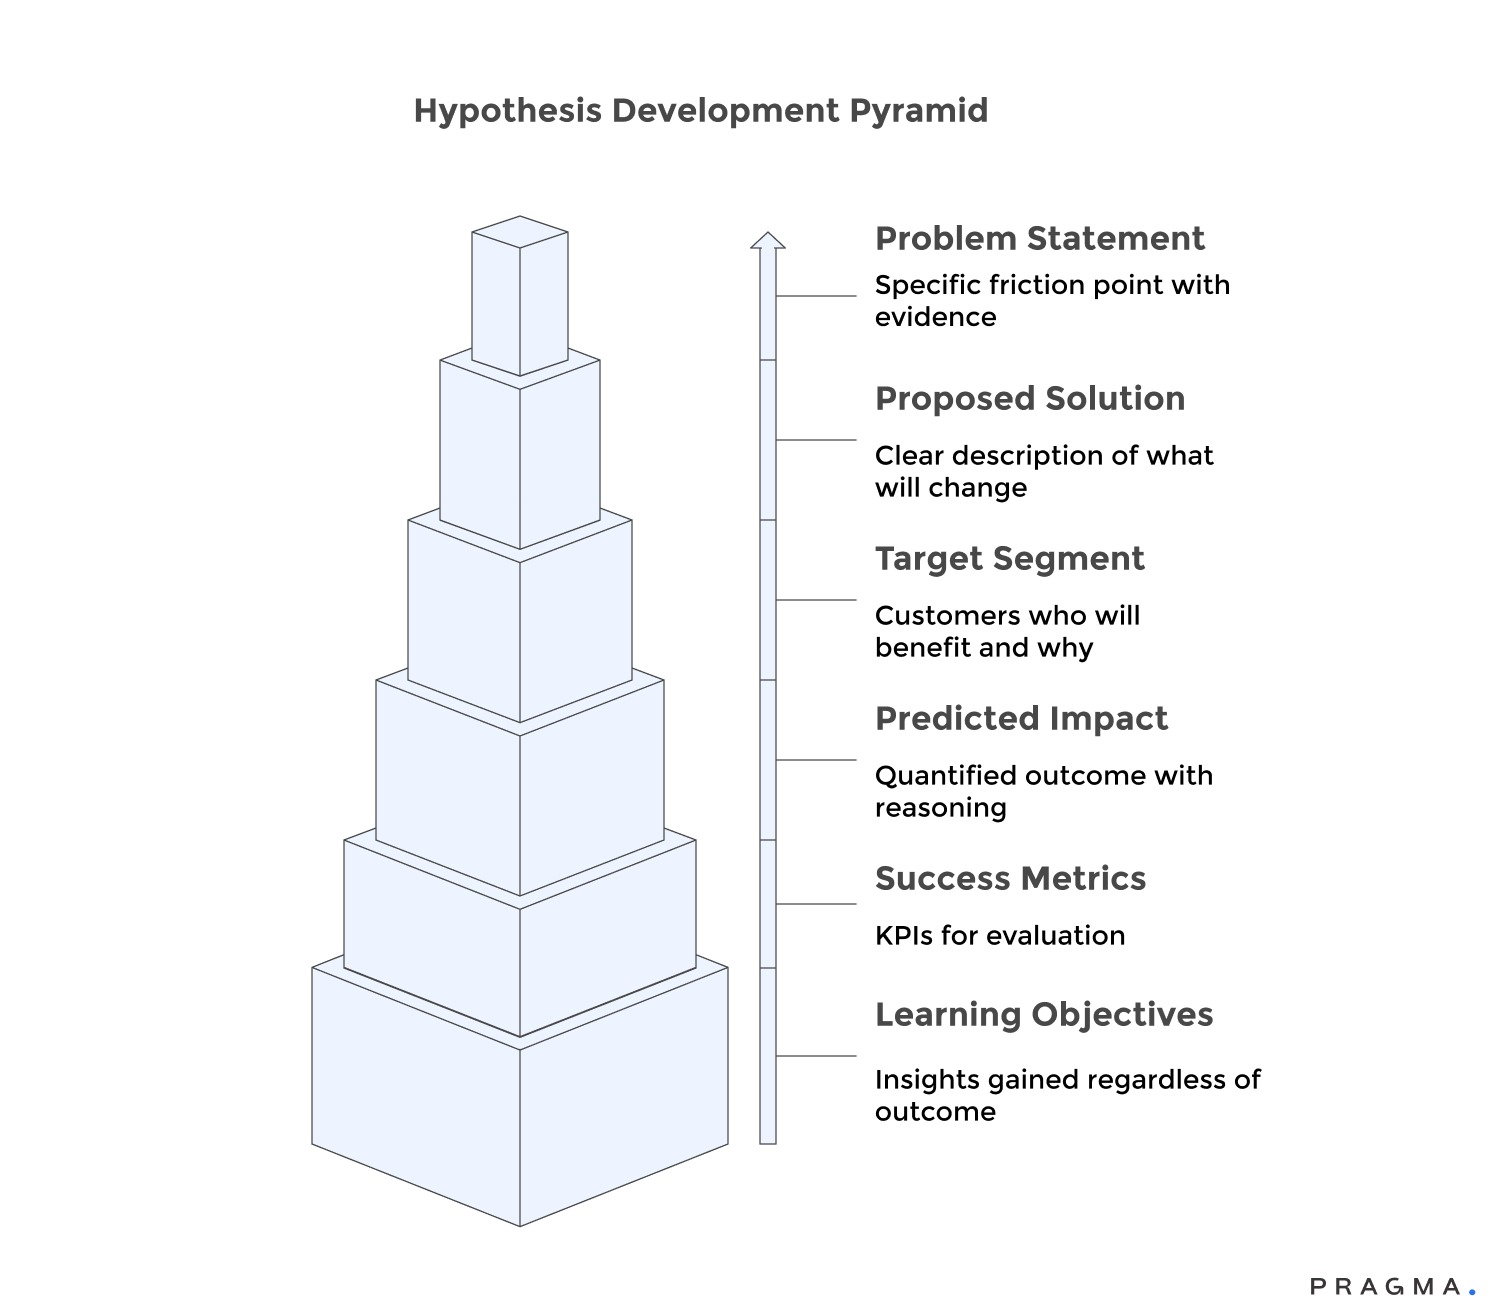
Poor hypothesis development results in testing changes without clear reasoning or predicted outcomes, making it impossible to learn from experiments even when they fail. Without articulated theories about why changes should improve conversions, teams cannot build cumulative knowledge or develop a deeper understanding of customer behaviour patterns.
Implementation quality issues mean winning variations don't perform as expected in full production because test environments differ from real customer experiences. Technical bugs, performance degradation, or inconsistent implementations create gaps between test results and actual business impact.
Test Your Way to a High-Converting Checkout
Launch Experiments. Keep Only What Converts.
Guesswork at checkout is expensive. Use Pragma to A/B test flows, payment options, messages, and incentives, then double down on the variants that actually reduce drop-offs and lift revenue.
What makes a testable checkout hypothesis worth pursuing?
Separating high-impact experiment opportunities from low-value distractions
Effective experimentation begins with hypothesis quality rather than testing volume, requiring disciplined prioritisation that concentrates resources on changes with genuine potential for meaningful conversion improvement. The best hypotheses articulate clear reasoning, predict specific outcomes, and address verified customer pain points rather than assumed problems.
Qualitative research foundation ensures hypotheses address real customer struggles discovered through user testing, support ticket analysis, session recordings, and abandonment surveys. Watching actual customers navigate your checkout reveals friction points that internal teams never notice, providing rich insight into where and why purchase attempts fail.
Data-driven prioritisation frameworks score potential experiments based on expected impact, implementation complexity, and resource requirements to ensure testing capacity focuses on the highest-value opportunities.
The PIE framework (Potential, Importance, Ease) or
ICE scoring (Impact, Confidence, Ease)
helps teams make objective prioritisation decisions rather than pursuing pet projects or HIPPO preferences.
Hypothesis specificity determines learning value by clearly stating what will change, why the change should improve conversions, which customer segments will benefit, and what success looks like quantitatively. Vague hypotheses like "simplifying checkout will improve conversions" provide no actionable insight, whilst specific statements like "reducing form fields from 12 to 7 will increase mobile conversion by 8-12% by decreasing completion time below 90 seconds" enable meaningful evaluation.
- Business impact assessment: Examines potential revenue implications beyond just conversion rate changes, considering average order value, customer quality, and operational costs. Some changes improve conversion rates but attract lower-value customers or increase fraud risk, leading to net-negative business outcomes.
- Technical feasibility evaluation: Prevents resource waste on experiments requiring extensive development time for minimal potential gain. Prioritise quick-win opportunities that deliver meaningful impact with modest implementation effort over ambitious experiments.
- Learning potential: Matters even when tests fail, with the best hypotheses structured to provide valuable insights regardless of outcome. Failed experiments that disprove assumptions or reveal unexpected customer behaviour can be more valuable than winning tests that confirm obvious improvements.
Hypothesis Development Framework:
Which Checkout Experiments Should You Avoid Testing Altogether?
Not all ideas merit experimentation. Some changes introduce noise, harm UX, or produce misleading results. Here are checkout experiments to approach with caution — or avoid:
- Removing Essential Form Fields Without Rationale
Eliminating critical fields (like delivery address info) without understanding backend requirements will break orders rather than improve conversion. - Heavy Personalisation Early in the Funnel
Personalised login banners, targeted product suggestions or complex dynamic content early in checkout can distract and increase cognitive load. - Multiple Offers at Once
Testing two unconnected offers (e.g., free shipping and loyalty rewards) at the same time confounds results and blurs causal attribution. - Irreversible Structural Changes Without Guardrails
Examples include collapsing multi-step checkout into one page without testing variation control, or changing payment providers mid-experiment. - Erasing Audit Trails
Removing logs, removing error displays or disabling analytics during a test undermines your ability to interpret results. - Discount-Only Experiments Without Economic Context
Running discount experiments without understanding segment profitability or CLV can temporarily lift conversions but erode margin.
Experiments should be safe, reversible and informed by data. If there’s ambiguity about impact, don’t test it blindly — prioritise fixes that improve clarity, reduce friction, and maintain functional reliability.
How do you structure experiments for statistical validity?
Building testing frameworks that produce reliable, actionable results
For A/B testing to yield meaningful insights and drive conversion uplift, a robust framework built on statistical rigour is essential. This prevents drawing false conclusions from random fluctuations and ensures that observed improvements reflect genuine performance gains.
Key elements for a statistically sound A/B testing framework include:
- Sample Size Calculation:
Before launching any experiment, determine the minimum traffic required to achieve statistically significant results. This prevents premature conclusions from insufficient data. Online calculators can help, requiring inputs such as baseline conversion rate, minimum detectable effect size, statistical power (typically 80%), and significance level (typically 95% confidence). Most reliable tests aim for 350-400 conversions per variation.
- Traffic Allocation Strategies:
Balance the speed of learning with potential business risks. Equal splits accelerate learning but expose more customers to potentially inferior experiences. Conservative allocations (e.g., 90/10) minimise risk but extend testing timelines significantly.
- Randomisation Quality:
Ensure visitors are assigned to variations truly randomly, eliminating systematic biases that could skew results. Robust hashing algorithms based on cookie IDs or session identifiers are crucial, avoiding crude methods like alternating assignments or time-based bucketing.
- Temporal Consistency:
Prevent the mixing of early and late traffic that may exhibit different characteristics. Run tests for complete weeks to capture weekday and weekend variations, and avoid major holidays or promotional events that could contaminate results with atypical traffic patterns.
- Segment Analysis Planning:
Go beyond aggregate results and identify specific customer groups for separate examination. New vs. returning customers, mobile vs. desktop users, and different geographic regions often respond differently to checkout changes, necessitating segmented evaluation.
- Primary and Secondary Metric Definition:
Clearly define success criteria and establish methods for monitoring unintended consequences. Primary metrics might focus on purchase completion rates, while secondary metrics track average order value, time to completion, cart size, and downstream effects like return rates or customer satisfaction.
- Continuous Monitoring:
Actively monitor tests during runtime to identify technical issues, unexpected results, or external factors affecting validity. Monitoring systems should track sample ratio mismatches, conversion rate stability, and segment-level performance to address problems before they compromise experiments.
Which checkout elements deliver the highest conversion impact?
Prioritising experimentation, focus on friction points that matter most
Optimising the checkout process is crucial for boosting conversion rates, as certain elements disproportionately impact purchase completion. Focusing on these high-leverage areas allows for more effective experimentation and a higher return on testing investment.
Key areas for optimisation include:
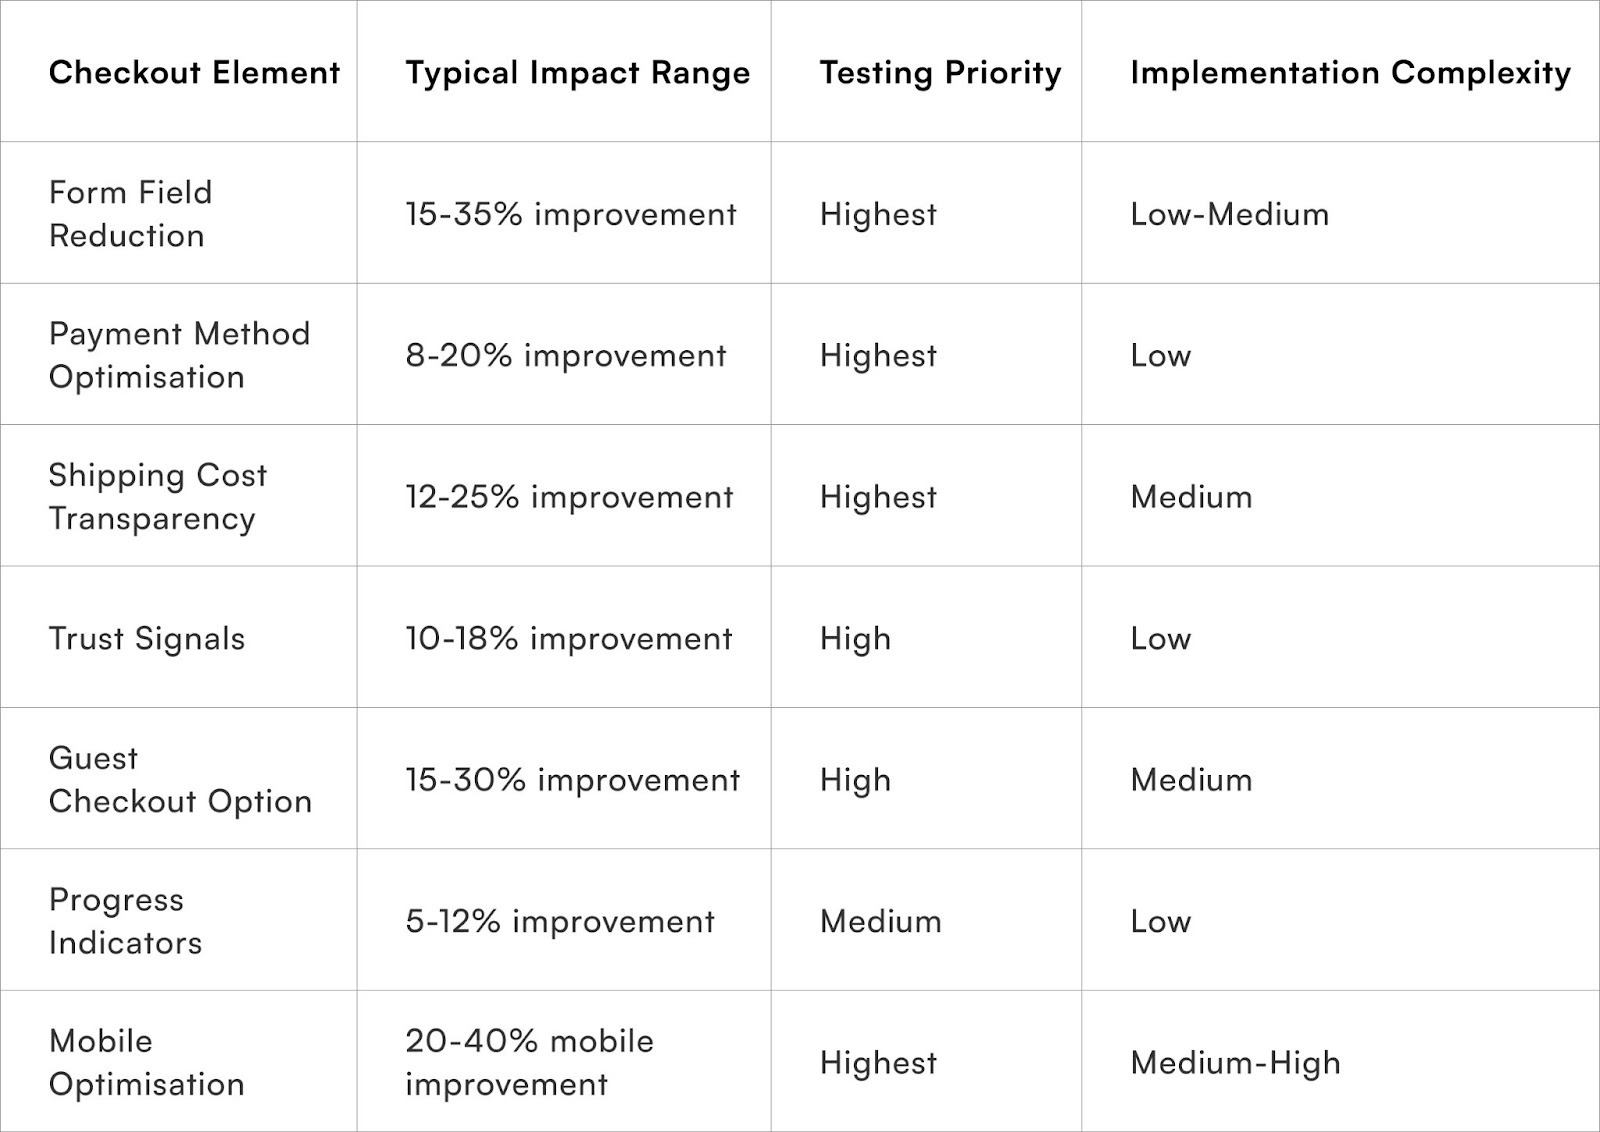
- Form Field Optimisation: A significant driver of abandonment, reducing the number of form fields can dramatically increase conversions. For instance, decreasing fields from 11 to 4 has been shown to boost conversions by 120%. Indian customers, in particular, benefit from streamlined data entry due to their mobile-first browsing habits and smaller screen sizes.
- Payment Method Presentation: In India, where payment preferences are diverse (UPI, cards, COD, digital wallets), prominently displaying locally relevant options and minimising less-used ones can reduce decision paralysis. Testing the order of payment methods based on regional preferences can lead to 8-15% conversion improvements.
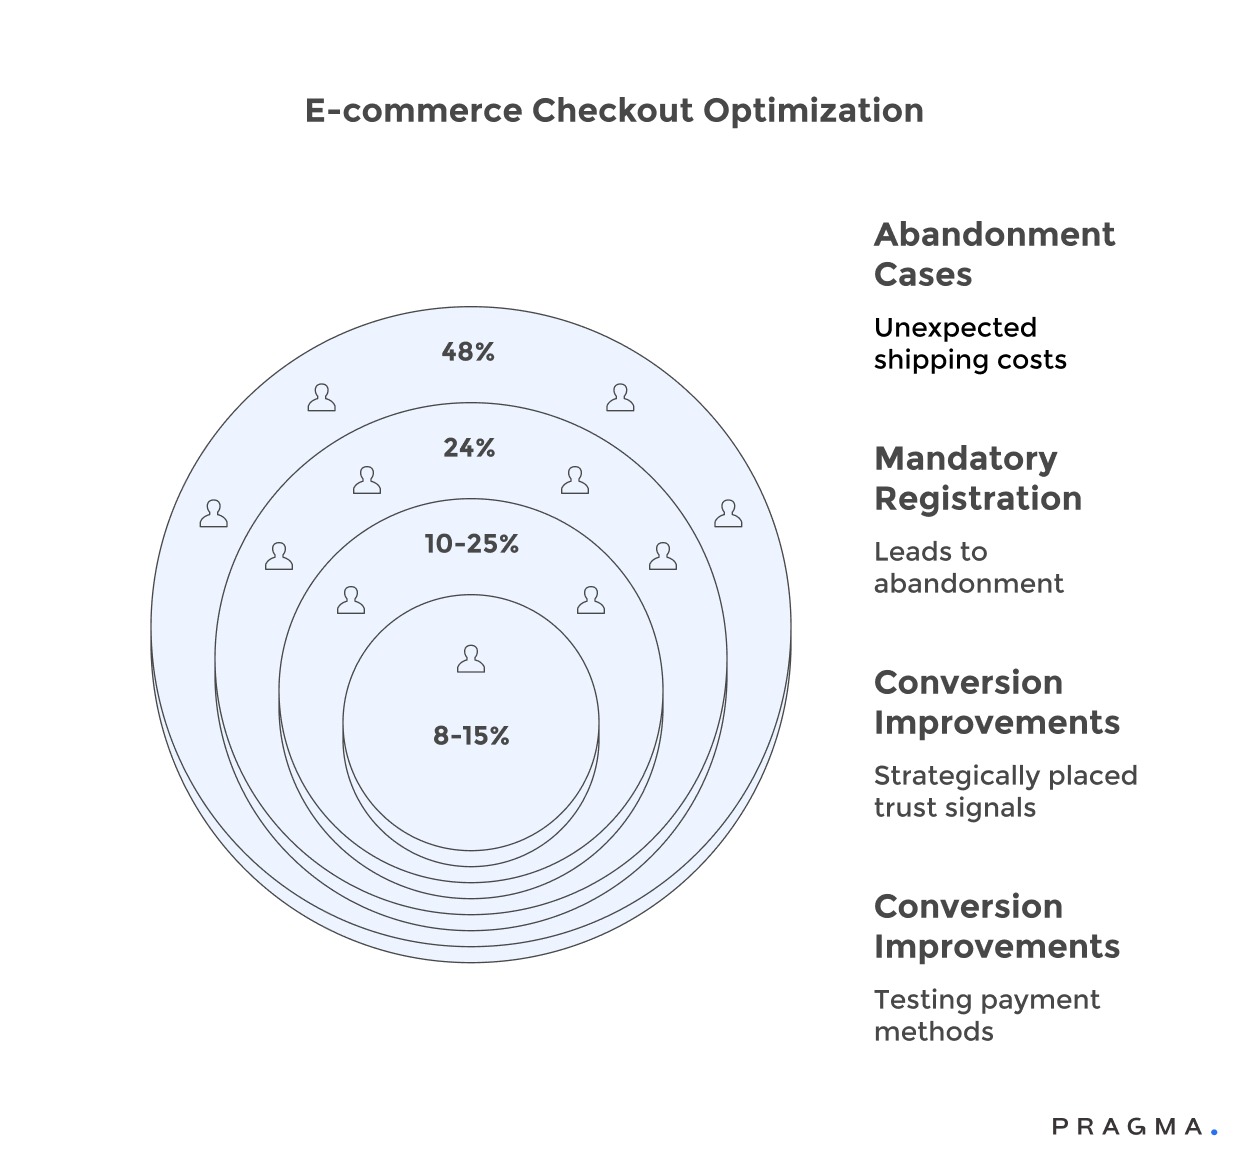
- Shipping Cost Transparency: Unexpected shipping costs are a major cause of cart abandonment, accounting for 48% of cases. Disclosing shipping costs early, ideally on product pages, prevents surprise-driven abandonment. Systematically testing free shipping thresholds and delivery timeline clarity is also beneficial.
- Trust Signal Placement: Strategically placed trust signals—such as security badges, money-back guarantees, customer review counts, and clear return policies—can increase conversions by 10-25%. This is especially important for first-time buyers and higher-value orders.
- Guest Checkout vs. Account Creation: Mandatory registration leads to 24% of abandonment. While account creation drives higher lifetime value, a balance must be struck. Testing optional versus required registration, simplified account creation, or post-purchase account setup can optimise this balance.
- Progress Indicators: For multi-step checkouts, clear visual progress indicators manage customer expectations and maintain momentum, reducing abandonment. Testing can determine optimal step numbers and labelling strategies for different customer segments.
- Mobile Optimisation: Given that mobile commerce accounts for 60-70% of Indian e-commerce traffic, mobile optimisation is paramount. Large touch targets, simplified data entry, autofill support, and mobile payment methods like UPI are essential for improving mobile conversion rates, which often lag desktop by 30-50%.
How do you calculate meaningful sample sizes?
Statistical significance requires adequate traffic volume and appropriate confidence levels
Sample size calculations prevent premature test conclusions that lead to false positives or missed opportunities. For checkout conversion improvements of 10%, tests require a minimum of 2,847 visitors per variant to achieve 95% confidence with 80% statistical power.
Most checkout tests need a 4-6 week duration to account for weekly traffic patterns and Indian payment behaviour cycles. Metropolitan traffic peaks during weekends for lifestyle purchases, whilst tier-2 cities show higher weekday activity for utility and necessity purchases.
Traffic splitting must account for device preferences and regional variations. Mobile traffic represents 73% of Indian ecommerce sessions, yet desktop conversions remain 40% higher due to payment method preferences and form completion ease. Testing mobile and desktop experiences separately often reveals different optimisation requirements.
Statistical significance calculators designed for Western markets frequently underestimate sample sizes needed for Indian conversion testing because baseline conversion rates tend to be lower and traffic patterns more seasonal.
How should you analyse and interpret experimental results?
Moving beyond surface-level metrics to extract actionable business insights
Result analysis is crucial for transforming experimental data into strategic decisions, combining statistical sophistication with business context. Beyond surface-level analysis, key aspects include:
- Statistical Significance: Determine if observed differences are beyond random chance using chi-square or t-tests. However, statistical significance doesn't always equal business significance.
- Confidence Intervals: Provide a range of plausible true effects, offering richer insights than point estimates.
- Segment Analysis: Reveals important variations across customer groups (e.g., mobile vs. desktop), allowing for targeted implementations.
- Secondary Metric Review: Catches unintended consequences like decreased average order value despite improved conversion rates, emphasising holistic analysis.
- Temporal Stability Checks: Examine if effects remain consistent over time, indicating novelty effects or technical issues.
- Practical Significance: Evaluates if statistically valid improvements justify implementation effort and maintenance.
- Learning Documentation: Captures insights beyond win-loss outcomes, building institutional knowledge for future optimisation.
Result Analysis Checklist:
Statistical Validation:
□ Sample size exceeds 350 conversions per variation
□ Statistical significance reaches 95% confidence
□ Test ran for a minimum of 1 complete week
□ No significant sample ratio mismatch detected
Business Impact Assessment:
□ Effect size exceeds a minimum of 5% relative improvement
□ Confidence intervals exclude zero or baseline
□ Average order value remained stable or improved
□ No concerning shifts in customer quality metrics
Segment Analysis:
□ Mobile and desktop were analysed separately
□ New vs returning customer impact examined
□ Geographic variations reviewed
□ Payment method effects evaluated
Implementation Decision:
□ Cost-benefit analysis supports rollout
□ Technical implementation pathway clear
□ Monitoring plan established
□ Rollback plan documented
How do regional differences affect testing strategies?
Metro, tier-2, and tier-3 markets require distinct optimisation approaches
Metropolitan markets in Mumbai, Delhi, Bangalore, and Chennai demonstrate sophisticated payment preferences with high UPI adoption and comfort with digital payment methods. These customers respond positively to streamlined checkout flows, express payment options, and premium delivery selections.
Tier-2 cities like Pune, Jaipur, and Kochi show mixed payment behaviours where COD remains preferred for higher-value purchases above ₹2,000, yet UPI dominates for everyday items under ₹1,000. Checkout optimisation for tier-2 markets requires dynamic payment option prioritisation based on cart value and purchase category.
Tier-3 and rural markets maintain strong COD preferences driven by trust concerns and limited banking infrastructure. These customers benefit from detailed product information, money-back guarantees, and simplified checkout flows that minimise perceived transaction complexity.
Regional testing strategies must account for language preferences, local festival seasons, and payment infrastructure variations. Tamil Nadu customers show 67% higher conversion rates when checkout pages display Tamil language options, whilst Gujarati markets respond strongly to festival-themed trust messaging during Navratri and Diwali periods.
Metrics to Watch for Experimentation Programme Health
To effectively measure A/B testing, it's essential to track key performance indicators (KPIs) that assess both individual experiment success and the overall program's effectiveness. This ensures testing efforts lead to significant business outcomes and build organisational capabilities.
Experiment Health and Quality
- Experiment Velocity: Monitor the number of experiments launched per quarter and their average duration. Healthy programs typically run 8-12 experiments quarterly, with durations of 14-21 days to balance speed and statistical validity.
- Winning Test Percentage: A 30-40% win rate indicates good judgment in hypothesis quality and prioritisation. Higher rates might suggest testing only obvious improvements, while lower rates could point to poor hypothesis development or technical issues.
Business Impact
- Aggregate Conversion Rate Trends: Successful programs demonstrate a steady 2-5% quarterly improvement as winning tests compound. Flat conversion rates, despite active testing, may signal implementation issues or poor hypothesis selection.
- Revenue Per Visitor (RPV): This metric provides a holistic view by capturing both conversion rate changes and average order value shifts. Some experiments may improve conversion but reduce order values, leading to misleading success signals if only conversion rates are monitored.
Statistical Rigor
- Average Sample Size Per Variation: Ensure tests reach reliable conclusions by maintaining an average of over 400 conversions per variation. Declining sample sizes may indicate traffic constraints or excessive test fragmentation requiring prioritisation adjustments.
- Statistical Significance Achievement Rates: Track the percentage of completed tests that reach 95% confidence thresholds. Low rates suggest a need for longer test durations, more conservative traffic allocation, or reduced concurrent testing.
Program Efficiency
- Time from Hypothesis to Implementation: Efficient programs complete this cycle in 2-3 weeks, demonstrating organisational agility. Extended timelines can point to development bottlenecks, approval friction, or resource constraints.
- Learning Documentation Completion Percentage: Best-in-class programs document 100% of experiments, including failed tests, to capture institutional knowledge and gain valuable insights into customer behaviour and checkout dynamics.
To Wrap It Up
Systematic checkout experimentation transforms guesswork into evidence-based optimisation that compounds conversion improvements over time. The brands winning in Indian D2C understand that sustainable growth comes from continuous testing disciplines rather than occasional redesigns or best-practice copying.
Start with infrastructure setup and one high-impact experiment this week—form field reduction or payment method optimisation typically delivers the fastest wins. Build momentum through early successes before tackling more complex experiments requiring extensive development work.
Remember that experimentation is a continuous practice rather than a project with defined endpoints. The most successful programmes run indefinitely, constantly testing new hypotheses informed by previous learnings and evolving customer behaviours.
Your testing roadmap should balance quick wins that build organisational support with longer-term experiments addressing fundamental checkout architecture. Patience with individual tests combined with urgency in overall programme velocity creates optimal learning speed.
For D2C brands seeking sophisticated experimentation capabilities that integrate seamlessly with existing operations, Pragma's conversion optimisation platform provides end-to-end testing infrastructure, automated analysis, and intelligent hypothesis generation that helps brands achieve 20-30% conversion improvements through systematic checkout optimisation and data-driven decision-making.
.gif)
FAQs (Frequently Asked Questions On Checkout Experiments: A Step-by-Step A/B Testing Framework for Conversion Uplift)
How much traffic do you need before starting checkout experimentation?
Minimum 1,000 weekly transactions enable meaningful testing, though 2,000+ weekly transactions support more ambitious programmes with multiple concurrent experiments. Lower-traffic brands should focus on fewer, higher-impact tests with longer durations.
Should you test multiple checkout changes simultaneously or sequentially?
Sequential testing provides clearer attribution and faster learning when traffic permits reasonable test durations. Simultaneous testing risks interaction effects and requires sophisticated analysis, though it's necessary for high-traffic sites with extensive optimisation backlogs.
What's the minimum conversion improvement worth implementing?
Aim for a minimum 5% relative improvement to justify implementation effort and ongoing maintenance. Smaller improvements rarely provide sufficient ROI unless implementation costs are negligible and results are highly confident.
How do you handle experiments that hurt conversion rates?
Stop tests immediately when variation performs 10%+ worse than control with 90%+ confidence to minimise revenue loss. Document learnings thoroughly, as failed experiments often provide valuable insights about customer preferences and checkout friction points.
Should mobile and desktop checkouts be tested separately?
Yes, mobile and desktop often respond differently to checkout changes due to distinct usage contexts and technical constraints. Run separate experiments or conduct thorough segment analysis to understand device-specific impacts before implementing changes universally.
Why should I run experiments on my checkout?
Because small changes in flow, copy, or incentives can yield big gains, and experiments show what actually improves conversions.
What are simple experiments to start with?
Test guest vs forced login, one-page vs multi-step checkout, and different placements of shipping and return information.
How long should a checkout experiment run?
At least one full purchase cycle with enough traffic to see clear differences, often 2–4 weeks.
Which metrics should I use to judge experiment success?
Checkout completion rate, revenue per session, payment success rate, and impact on AOV.
How does Pragma support checkout A/B tests?
It routes traffic between variants, tracks key metrics for each version, and helps you roll out the winning flow quickly.
Talk to our experts for a customised solution that can maximise your sales funnel
Book a demo

.png)
.png)