

Return to Origin is one of the most misunderstood cost centres in Indian D2C. Most brands know their headline RTO percentage, yet very few can explain where the loss is actually coming from. Finance teams see monthly write-offs. Operations teams blame courier performance. Marketing teams quietly absorb the hit as CAC inefficiency. Meanwhile, industry benchmarks show that RTOs account for 8–14% of gross order value in COD-heavy Indian D2C brands, with Tier-2 and Tier-3 lanes contributing nearly two-thirds of failed deliveries during sale periods.
The real problem is not RTO volume. It is attribution blindness. When RTO losses are tracked as a single aggregate number, brands lose the ability to act surgically. The same mistakes repeat across SKUs, campaigns, and delivery lanes. In this comprehensive guide on Cost Attribution for RTOs: Apportioning Losses to Product, Channel, and Carrier, we break RTO losses into accountable units that teams can actually influence. Brands that adopt this approach typically unlock 20–30% reduction in avoidable RTOs, tighter CAC control, and clearer ownership across growth, ops, and finance.
Why do RTOs become invisible cost centres?
Aggregation hides responsibility and delays corrective decisions
Most Indian D2C dashboards treat RTO as a single metric, occasionally split by COD versus prepaid. This simplification creates the illusion that all failed deliveries behave similarly. In reality, RTOs are driven by distinct behavioural, operational, and logistical forces. When these forces are blended into one number, accountability disappears.
How aggregation distorts decision-making
When RTOs are not attributed, teams optimise in silos. Growth continues scaling channels that quietly bleed delivery failures. Operations renegotiate carrier contracts without understanding SKU-level fragility. Finance reacts after the loss has already been realised. No team owns prevention because no team sees causation.
Where RTO costs actually sit in the P&L
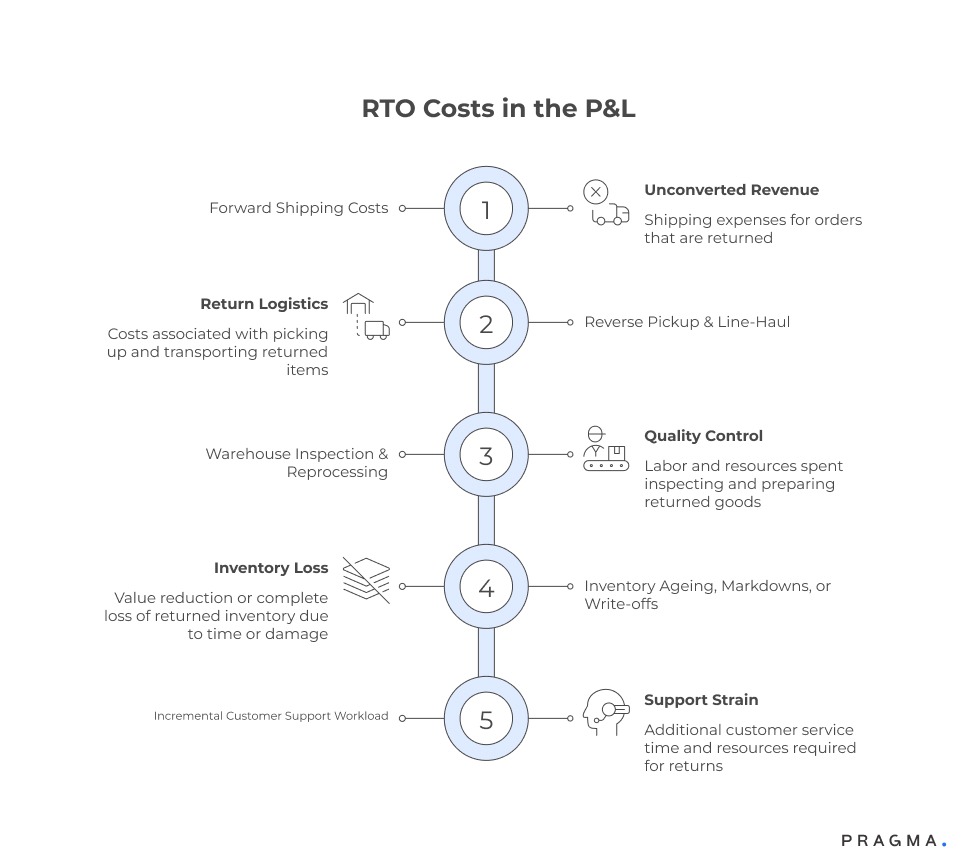
RTO losses rarely show up cleanly. They are distributed across multiple line items, which makes them feel smaller than they are:
- Forward shipping costs that never convert to revenue
- Reverse pickup and line-haul expenses
- Warehouse inspection and reprocessing labour
- Inventory ageing, markdowns, or write-offs
- Incremental customer support workload
Internal audits across Indian apparel and electronics brands show that a single RTO costs 1.8–2.4× the forward shipping cost, especially when resale velocity drops. Without attribution, these secondary costs never inform pricing, campaign planning, or assortment strategy.
Why “high RTO” is a weak diagnostic
Saying a brand has “high RTO” is like saying revenue is “low.” It describes a symptom, not a cause. One RTO may stem from poor size clarity. Another from impulse discount traffic. A third from courier underperformance in specific pin codes. Treating them equally leads to blunt actions such as disabling COD or switching carriers nationally, which often damage conversion more than they reduce loss.
How can RTO costs be attributed at the product level?
Products often create delivery friction before logistics ever begins
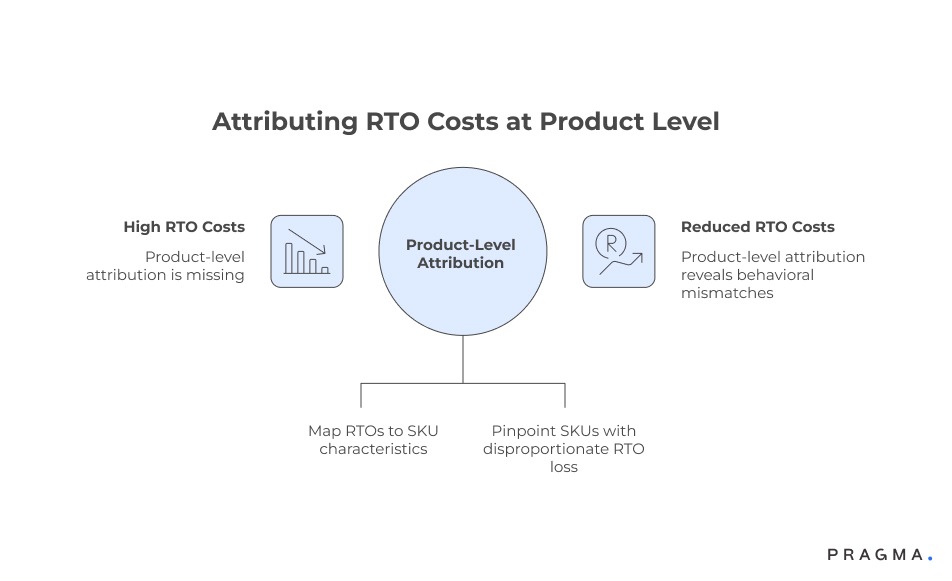
Products influence RTO outcomes far more than most teams realise. Certain SKUs consistently fail not because of delivery issues, but because they attract the wrong expectations. Product-level attribution reveals behavioural mismatches that operational fixes cannot solve.
What product-level attribution actually means
Product attribution goes beyond counting how many times an item returns. It connects RTOs to SKU-specific characteristics such as:
- Price point sensitivity in COD flows
- Size or fit ambiguity
- Fragility and packaging tolerance
- Visual expectation versus delivered reality
Once this mapping exists, patterns emerge quickly. A handful of SKUs often account for a disproportionate share of RTO loss, even if their order volume looks healthy.
Why gross margin hides product-level RTO risk
Many brands continue scaling SKUs based on gross margin alone. This is misleading. A ₹1,200 SKU with a 60% gross margin becomes value-destructive if its RTO rate crosses 18% in COD lanes. Product-level attribution forces teams to shift from gross margin to net realised margin after RTO, which changes assortment decisions dramatically.
When product fixes outperform logistics fixes
In multiple Indian D2C audits, simple product interventions reduced RTOs more effectively than courier changes. Improvements such as clearer size guides, delivery expectation messaging, and better imagery lowered refusal rates without touching carrier contracts. This insight only surfaces when RTOs are traced back to SKUs rather than warehouses.
What role does the acquisition channel play in RTO losses?
Buyer intent quality shapes delivery outcomes more than brands expect
Every acquisition channel carries a different intent profile. Channel-level attribution exposes how marketing decisions quietly influence last-mile success. Many RTOs originate upstream, long before a package enters the courier network.
How channel intent translates into delivery behaviour
Orders driven by high-discount paid social campaigns often show elevated non-availability and refusal rates, particularly in COD. In contrast, search-driven or referral traffic demonstrates stronger delivery completion, even at similar price points. When RTO losses are attributed back to channels, CAC maths changes overnight.
Marketplace-trained behaviour leaking into D2C
Customers retargeted from marketplaces bring different behavioural expectations around delivery attempts and returns. They are more likely to refuse rather than reschedule. Without channel attribution, these failures appear as courier issues instead of expectation mismatches created at acquisition.
Aligning channel strategy with fulfilment reality
Once channel-level RTO cost is visible, brands can:
- Limit COD exposure for specific campaigns
- Adjust messaging for high-risk traffic sources
- Route low-intent traffic to prepaid-first flows
These adjustments reduce RTO losses without suppressing growth, but only when attribution replaces intuition.
How should carriers and delivery lanes be held accountable for RTO costs?
Operational variance becomes visible only when lanes are isolated
Carrier attribution is where most Indian D2C brands think they are analytical, yet still miss the mark. Teams often compare partners using headline RTO percentages or monthly performance scorecards. That approach hides lane-level variance and unfairly penalises or rewards carriers without context. True attribution separates carrier behaviour from geographic and order-mix realities.
Why national carrier averages are misleading
A carrier performing well in Mumbai intra-city lanes may consistently fail in Bihar or North-East routes. When performance is averaged nationally, these failures disappear into noise. Carrier accountability only works when measured at the lane and region level, not brand-wide aggregates.
What constitutes a delivery lane in Indian D2C
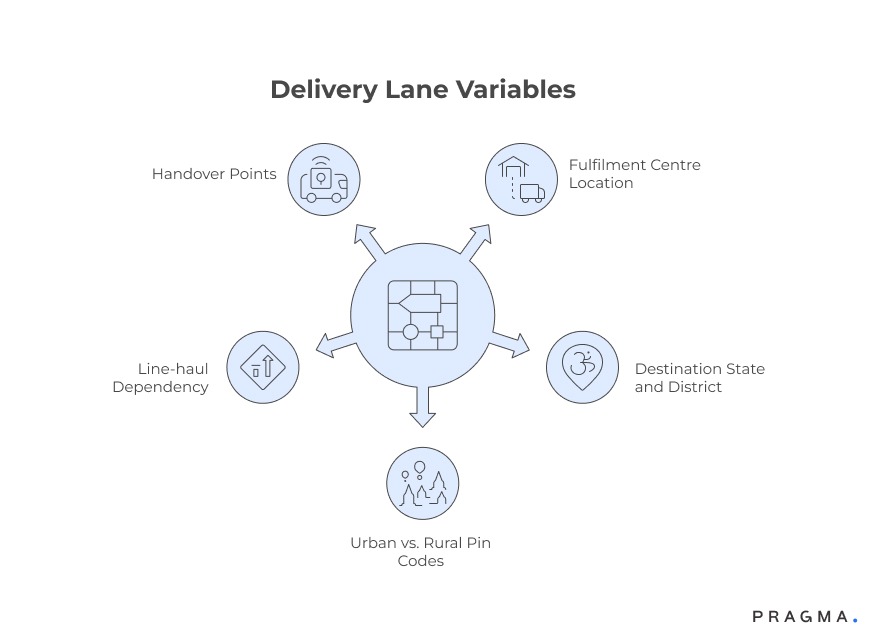
A lane is not just origin to destination city. It combines multiple operational variables:
- Fulfilment centre location
- Destination state and district
- Urban versus rural pin codes
- Line-haul dependency and handover points
Each variable introduces failure probability. When lanes are not defined precisely, carrier evaluation becomes anecdotal.
How lane-wise attribution changes carrier conversations
Once RTO losses are mapped by lane, discussions with carriers shift from blame to resolution. Instead of asking why RTO is high overall, ops teams can pinpoint that Delhi NCR to East UP COD lanes fail at double the brand average. This specificity enables targeted interventions such as alternative partners, pickup-slot changes, or COD confirmation overlays.
The critical insight here is that most carrier underperformance is geographically contained, not systemic.
What regional patterns drive disproportionate RTO losses?
Tier and pin-code dynamics shape delivery outcomes more than volume
Indian D2C RTOs are not evenly distributed. Regional behaviour, infrastructure maturity, and customer familiarity with D2C buying all influence outcomes. When attribution includes geography, brands uncover predictable loss clusters.
Tier-wise RTO behaviour in Indian markets
Tier-1 cities typically show lower refusal rates but higher reschedule requests. Tier-2 cities balance COD reliance with improving delivery reliability. Tier-3 and rural pin codes contribute the highest share of outright refusals and non-availability cases.
This pattern persists across categories, though intensity varies. Electronics and home goods show sharper regional contrast than apparel or beauty.
Why pin-code granularity matters
District-level analysis is no longer sufficient. Two adjacent pin codes can behave entirely differently due to:
- Courier staffing quality
- Local agent incentives
- Distance from branch hubs
- COD cash handling reliability
Brands that cluster pin codes into risk bands rather than treating them individually gain operational clarity without excessive complexity.
When geography outweighs carrier choice
In several Indian D2C audits, switching carriers in high-risk pin codes delivered marginal improvement. However, modifying payment mix, delivery messaging, or attempt logic in those same regions reduced RTOs significantly. Geography often dictates behaviour more than carrier capability.
How can RTO costs be systematically apportioned across dimensions?
From reactive reporting to decision-grade attribution
Attribution only becomes useful when it feeds decisions. A practical framework allocates RTO loss across product, channel, carrier, and geography simultaneously, without overcomplicating reporting.
A simple multi-dimensional attribution model
Most brands start with a weighted allocation approach. Instead of assigning 100% blame to one factor, losses are apportioned based on contribution signals observed historically.
RTO Cost Attribution Weighting (Example)
- Product risk factor: 30%
- Channel intent factor: 25%
- Carrier performance factor: 25%
- Regional risk factor: 20%
Weights evolve as data maturity improves. Early-stage brands often start with rough heuristics and refine quarterly.
How this framework improves cross-team alignment
Finance gains clarity on true net margins. Growth teams see which campaigns quietly destroy value. Ops teams focus on the lanes that actually matter. Attribution transforms RTO from an ops headache into a shared business metric.
Where most brands go wrong
Many teams over-engineer attribution models too early. They introduce complex scoring without reliable data hygiene. The better approach is directional accuracy first, precision later. Even imperfect attribution outperforms none.
Quick Wins
Immediate attribution steps that surface hidden losses fast
Week 1: RTO data normalisation and tagging
Begin by consolidating RTO data from OMS, courier reports, and finance ledgers into a single view. Tag each failed order with product SKU, acquisition channel, carrier, destination pin code, and payment mode. This exercise alone often reveals that 60–70% of RTO losses originate from a narrow slice of orders rather than the entire funnel.
Expected outcome: Clear visibility into which dimensions actually drive losses instead of generic RTO percentages.
Week 2: Product and channel cross-analysis
Overlay SKU-level RTO rates with channel-wise acquisition data. Identify products where COD-driven campaigns show materially higher refusal rates compared to organic or search-led traffic. Share these insights with marketing and merchandising teams to realign campaign exposure.
Expected outcome: Immediate reduction in value-destructive traffic without pausing growth experiments.
Week 3: Lane-wise carrier benchmarking
Segment carrier performance by fulfilment hub to destination region rather than national averages. Flag lanes where one carrier underperforms peers by more than 5–7 percentage points. Initiate lane-level discussions instead of full-network escalations.
Expected outcome: Faster carrier accountability and targeted fixes without disruptive partner switches.
Week 4: Loss ownership framework rollout
Introduce a simple attribution scorecard reviewed weekly across growth, ops, and finance. Attribute RTO loss proportionally across product, channel, and carrier based on observed patterns rather than anecdotal blame.
Expected outcome: Shared accountability and faster decision-making on prevention rather than post-mortems.
Which metrics should teams track to manage RTO attribution effectively?
From surface KPIs to decision-grade signals
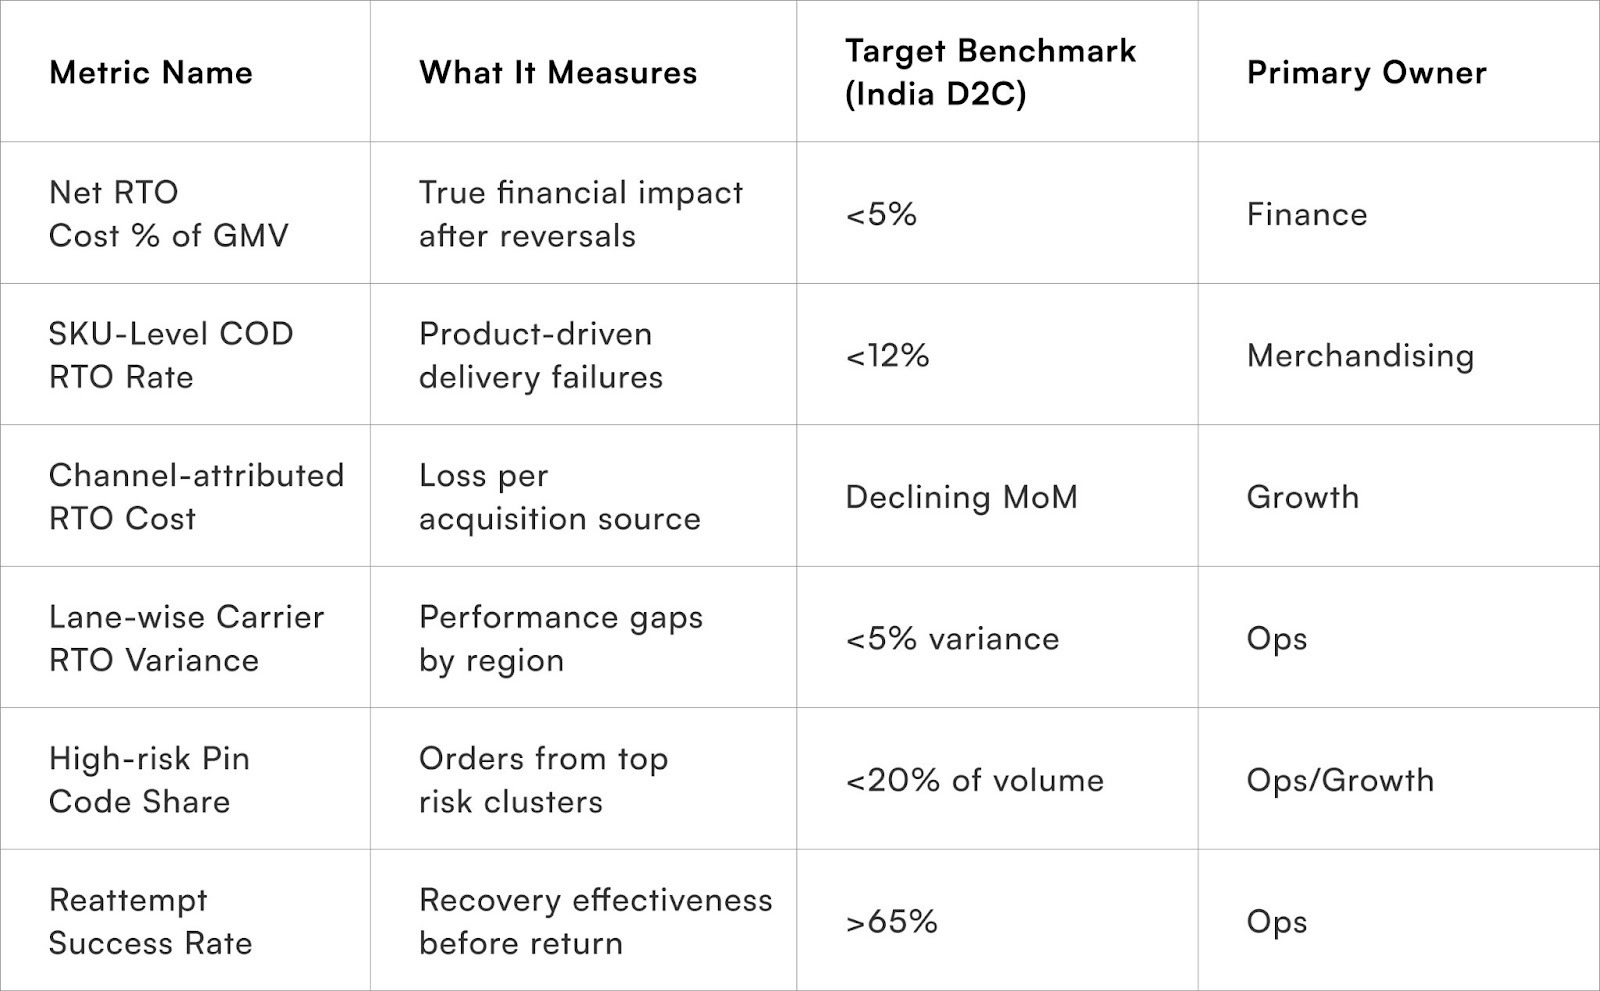
These metrics work best when reviewed together. Tracking them in isolation recreates the same silos that caused attribution blind spots in the first place.
To Wrap It Up
RTOs become expensive when they lack ownership. Attribution restores accountability by connecting losses to decisions made across growth, merchandising, and logistics. Brands that adopt this approach stop reacting to failures and start preventing them systematically.
This week, build a basic attribution view for your last 90 days of RTOs and identify the top three loss drivers across dimensions.
Over time, refine weighting models, integrate behavioural signals, and align incentives so that prevention becomes embedded in everyday decision-making rather than a quarterly fire drill.
For D2C brands seeking sharper RTO attribution and automated loss visibility, Pragma’s returns intelligence platform provides lane-wise analytics, SKU-level risk mapping, and carrier benchmarking that help brands reduce avoidable RTO losses by 20–30% while improving cross-team accountability.
.gif)
FAQs (Frequently Asked Questions On Cost attribution for RTOs: apportioning losses to product, channel and carrier)
1. How detailed should RTO attribution be for mid-sized D2C brands?
Mid-sized brands benefit most from SKU, channel, carrier, and region-level attribution. Going deeper too early often adds complexity without improving decisions.
2. Can RTO losses ever be fully eliminated?
No. Some level of RTO is structural in COD-heavy Indian markets. The goal is to minimise avoidable RTOs, not chase zero.
3. Is carrier performance the biggest driver of RTOs?
Carrier performance matters, but attribution often shows that product expectations and channel intent contribute equally, if not more, to failures.
4. How often should attribution models be updated?
Quarterly reviews work well for most brands, with additional recalibration before major sale periods.
5. Does reducing RTO always hurt conversion?
Not when driven by attribution. Targeted changes typically protect high-intent traffic while reducing low-quality exposure.
Talk to our experts for a customised solution that can maximise your sales funnel
Book a demo

.png)