

Customer lifetime value (CLTV) models in D2C often focus on what is easy to measure: order frequency, average order value, channel acquisition cost, and repeat purchase rates. What is usually missing is the operational reality behind those numbers. Two customers with identical revenue profiles can impose very different costs on the business, particularly once returns, retries, and reverse logistics are considered.
Using return-behaviour signals to enrich CLTV and retention models explores how return-related behaviour fundamentally reshapes customer value. Returns are not merely a post-purchase inconvenience; they are a behavioural signal that reveals intent, friction tolerance, trust, and long-term profitability. When return behaviour is ignored, CLTV models systematically overvalue some customers and undervalue others.
This blog explains how ops data from returns, refusals, and post-delivery behaviour should feed directly into CLTV and retention modelling. The goal is not to penalise customers indiscriminately, but to build a more accurate, operationally grounded understanding of long-term value.
Why traditional CLTV models fall short
Revenue without cost context is misleading
Most CLTV models optimise for growth metrics rather than operational sustainability. They treat all revenue equally, regardless of how expensive it was to realise that revenue. In markets like India, where logistics complexity, COD prevalence, and return rates vary widely, this assumption breaks down quickly.
A customer who orders frequently but returns half their purchases may appear valuable on paper. In reality, their contribution margin is often negative once delivery attempts, reverse logistics, QC, and refund handling are accounted for. Without incorporating return behaviour, retention strategies end up reinforcing loss-making patterns instead of correcting them.
Why return behaviour is a strong proxy for customer intent
Returns reflect effort, not just opinion
Unlike clicks or browsing behaviour, returns require deliberate effort from the customer. Packaging an item, coordinating pickup, and waiting for a refund introduce friction. This makes return behaviour a higher-quality signal than many digital metrics.
Different return behaviours, different meanings
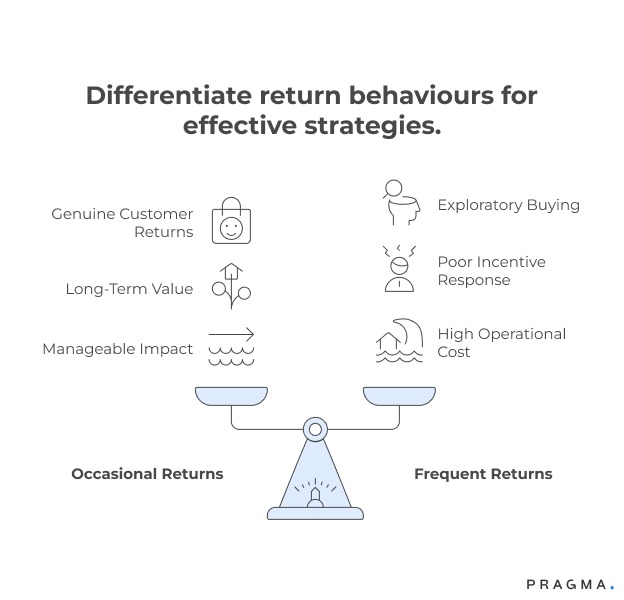
Occasional, justified returns
These often indicate sizing or expectation mismatches and are common among genuine customers. When handled well, they do not reduce long-term value.
Frequent, pattern-based returns
Repeated returns across categories or sizes signal exploratory buying or low commitment. These customers often respond poorly to aggressive retention incentives.
Refusals and delivery non-responsiveness
These behaviours are operationally expensive and correlate strongly with future RTO and failed attempts.
Understanding these distinctions allows brands to interpret returns as behavioural context, not blanket risk.
Types of return signals worth capturing
Not all return data deserves equal weight
To enrich CLTV meaningfully, teams must distinguish between raw events and structured signals. High-quality signals tend to be consistent, repeatable, and correlated with future outcomes.
Key return-behaviour signals include:
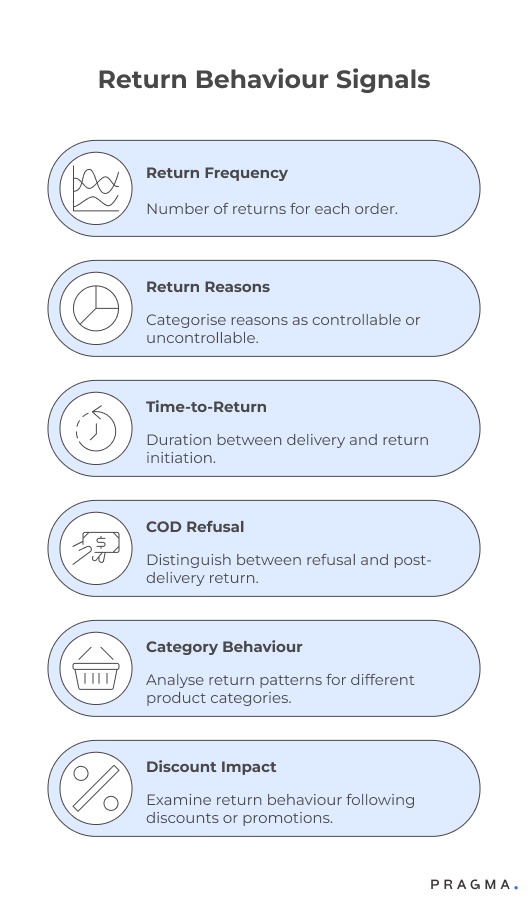
- Return frequency per delivered order
- Return reasons mapped to controllable vs uncontrollable factors
- Time-to-return after delivery
- COD refusal vs post-delivery return
- Category-specific return behaviour
- Return behaviour after discounts or promotions
These signals become powerful when tracked longitudinally rather than as isolated incidents.
Mapping return behaviour into CLTV models
From binary flags to weighted modifiers
Return behaviour should not be treated as a simple yes/no attribute. Instead, it works best as a modifier layered onto existing CLTV frameworks.
Structural approach to enrichment
Baseline CLTV calculation
Start with your existing revenue-based CLTV: frequency, AOV, margin, and retention probability.
Cost-to-serve adjustment
Introduce a cost component that includes delivery attempts, reverse logistics, QC, and refund handling.
Behavioural weighting
Apply weights based on return behaviour patterns. For example, frequent high-cost returns reduce effective CLTV, while stable delivery success increases confidence in future value.
This layered approach preserves model simplicity while improving accuracy.
Return behaviour and retention are not opposites
Reducing returns does not always mean losing customers
A common fear is that factoring returns into retention decisions will alienate customers. In practice, the opposite is often true. When return behaviour is understood correctly, brands can design retention strategies that reduce friction rather than punish customers.
For example, a customer with high return frequency due to sizing issues may respond well to better size guidance or assisted shopping. A customer with refusal-driven returns, however, may need stricter checkout rules or reduced incentives.
Retention improves when interventions match behaviour instead of applying uniform offers.
Segmenting customers using return-enriched CLTV
Operational segmentation beats demographic guesses
Return-enriched CLTV enables more meaningful segmentation than age, gender, or geography alone.
Example segments
High CLTV, low return cost
Ideal customers. Prioritise fast refunds, proactive support, and loyalty benefits.
Medium CLTV, high avoidable returns
Customers worth retaining, but through education, nudges, and operational fixes rather than discounts.
Low CLTV, high operational cost
Customers requiring stricter policies, reduced incentives, or controlled access to COD and promotions.
This segmentation allows growth and ops teams to align around shared priorities.
How return signals improve retention decision-making
Retention is about choosing the right investment
Without return signals, retention budgets are often wasted on customers unlikely to become profitable. Enriched CLTV models help answer difficult but necessary questions: Who should receive incentives? Who should receive service improvements? Who should simply be allowed to churn?
Return behaviour helps identify customers who churn because of fixable issues versus those whose behaviour consistently erodes margin. This distinction allows retention teams to invest with discipline rather than optimism.
Integrating ops, CRM, and data teams
The enrichment loop must be cross-functional
Return-enriched CLTV only works when ops, CRM, and data teams collaborate. Ops owns the accuracy of return data, CRM owns customer communication, and data teams own modelling and validation.
Regular reviews where return trends are discussed alongside CLTV shifts help teams recalibrate assumptions. Without this feedback loop, models drift away from reality and lose trust.
Technology considerations for enrichment
Start simple, avoid overfitting
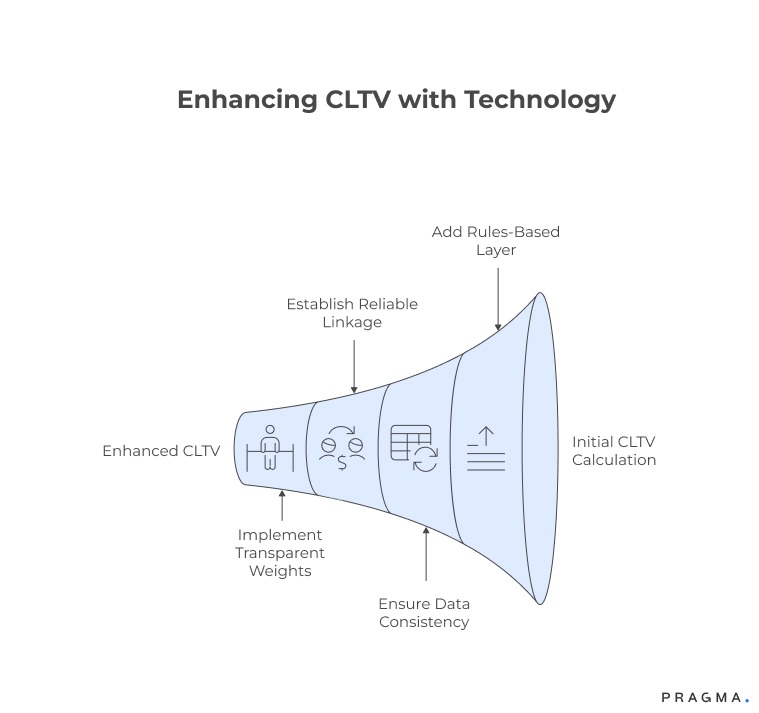
You do not need complex machine learning models to begin. A rules-based or weighted scoring layer added to existing CLTV calculations delivers immediate value.
Key requirements include:
- Clean, consistent return reason tagging
- Reliable linkage between orders, returns, and customer profiles
- Transparent weights that teams can explain and adjust
Over time, behavioural models can evolve, but early success depends on clarity, not complexity.
Metrics to monitor after enrichment
Ensure models reflect reality, not theory
After incorporating return behaviour, teams should monitor:
- Difference between predicted and realised CLTV
- Cost-to-serve per retained customer
- Retention ROI by return-behaviour segment
- Change in return rates after targeted interventions
- Net margin per customer cohort
If enriched models are effective, variance between predicted and realised value should shrink over time.
Quick Wins
Build enrichment without disrupting existing models
Week 1: Audit return behaviour
Identify top 20% customers by return-related cost. Analyse patterns by category, payment type, and delivery outcome.
Expected result:
Clear understanding of which return behaviours are driving margin leakage.
Week 2: Define behavioural buckets
Group customers into 3–4 return-behaviour segments based on frequency and cost.
Expected result:
Simple segmentation ready for modelling and CRM use.
Week 3: Apply CLTV modifiers
Introduce conservative cost-based adjustments to existing CLTV scores for each segment.
Expected result:
More realistic customer value distribution.
Week 4: Align retention actions
Map retention strategies to segments: service improvements, nudges, restrictions, or reduced incentives.
Expected result:
Retention spend aligned with operational reality.
To Wrap It Up
Return behaviour is one of the most underused signals in customer analytics. When integrated thoughtfully, it transforms CLTV from a revenue estimate into a true profitability measure.
This week, identify your top return-cost customers and compare their revenue-based CLTV to their realised margin.
Long term, build a continuous enrichment loop where ops data informs modelling, modelling informs retention, and retention outcomes feed back into operations. Over time, this alignment creates sustainable growth rather than cosmetic scale.
For D2C brands seeking to align operational behaviour with customer value, Pragma’s Customer Intelligence platform enables teams to unify returns data, behavioural signals, and CLTV models to improve retention outcomes and margin efficiency.
.gif)
FAQs (Frequently Asked Questions On Using return-behaviour signals to enrich CLTV and retention models)
1. Does frequent returning always indicate a low-value customer?
No. Context matters. Some customers return often due to fixable issues like sizing or unclear descriptions. When these issues are addressed, their long-term value can increase significantly.
2. Should return behaviour reduce loyalty benefits automatically?
Not automatically. Loyalty decisions should consider whether return behaviour is avoidable, structural, or product-driven. Penalising all returns risks harming genuine customers.
3. How much historical data is needed for enrichment?
Three to six months of return data is usually sufficient to identify meaningful patterns. Longer histories improve confidence but are not mandatory to begin.
4. Can this approach work for COD-heavy brands?
Yes. COD refusal and non-responsiveness are among the strongest return-behaviour signals and should be incorporated carefully into CLTV.
5. Will this make retention models too complex?
If implemented with restraint, no. Start with a small number of high-signal features and avoid overfitting early models.
6. How often should behavioural weights be reviewed?
Monthly reviews are usually sufficient, with deeper recalibration after major category changes or seasonal shifts.
7. Should CX teams see return-enriched CLTV scores?
Yes, but with explanations. Visibility helps CX tailor responses, while hidden scores often lead to mistrust or misuse.
Talk to our experts for a customised solution that can maximise your sales funnel
Book a demo


.png)