

A warehouse team opens a batch of returned items and finds the same complaint repeated. The packing slip lists “product not as expected” for thirty orders.
In Indian D2C operations, that recurring note often masks multiple root causes and wastes valuable recovery cycles. Recent industry reports show returns range between 8–18% by category, and poorly segmented reasons inflate reverse logistics costs by an estimated 12–22%.
In this comprehensive guide on How to Segment Return Reasons for Actionable Insights, we're diving deep into practical frameworks that translate messy return notes into targeted fixes.
This piece explains how to standardise reason codes, layer behavioural signals, and prioritise interventions. By implementing structured segmentation, teams typically realise a 15–30% reduction in repeat returns and a 20% improvement in recovery rates within two quarters.
Why should you segment return reasons?
Clarifying root causes to target corrective action and reduce waste.
Returns surface failures across the entire value chain. They reveal gaps in sizing accuracy, packaging durability, product quality, and customer experience design. When all returns cluster under ambiguous tags like “not satisfied,”
The business loses sight of which lever to fix first. Segmentation turns scattered complaints into a structured signal that guides product, logistics, and CX teams.
By segmenting return reasons, brands reduce dependency on anecdotal hypotheses. Size-related returns expose measurement inconsistencies. Damage-related returns highlight packaging weaknesses or courier issues. Expectation mismatch reveals gaps in product content or photography. Fraud-suspected returns flag risk patterns within specific pin codes or customer cohorts.
Without segmentation, teams operate blindly. They over-invest in packaging, under-invest in content, or push unnecessary quality checks.
Segmentation transforms returns from a cost burden into a diagnostic tool that illuminates precise operational breakdowns.
What dimensions matter for effective segmentation?
Choosing practical axes that link to operational levers and revenue recovery.
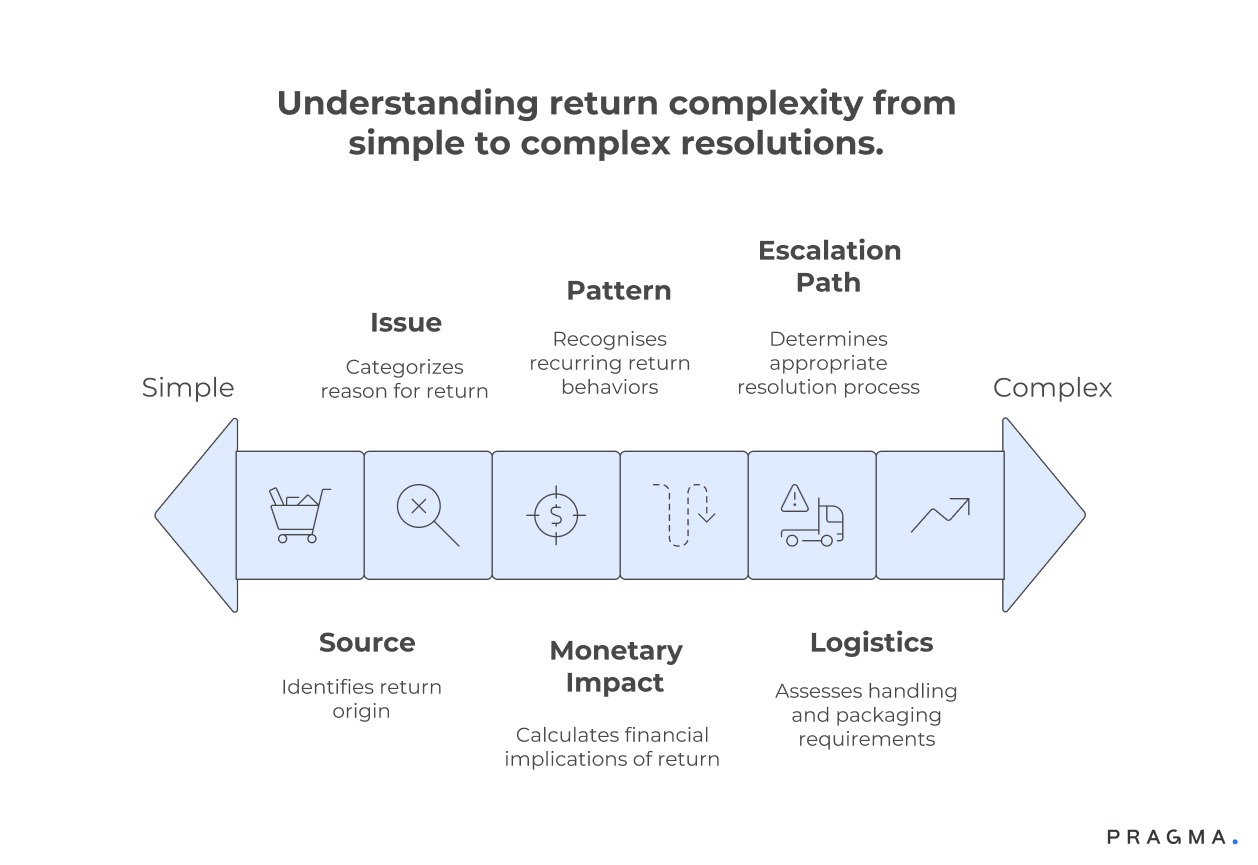
Effective segmentation requires multi-dimensional tagging. A single label rarely captures the true cause. Brands must layer data to create segments that reflect behavioural patterns and actionable insights.
The first axis is reason type. This includes
- Size
- Fit
- Quality
- Damage
- Mismatch
- Late delivery
- And change of mind.
Each reason type maps to a different corrective action. For instance,
- Size and fit issues correspond to size chart adjustments
- Model measurements, or deeper SKU analysis.
- Damage or defect signals packaging redesign, courier accountability checks, or vendor compliance audits.
The second axis is channel. Returns initiated through customer support behave differently from those initiated through self-service dashboards or marketplace partners.
Channel-level segmentation shows which journeys confuse customers or push them toward unnecessary returns.
The third axis is time-to-return. Early returns often signal immediate dissatisfaction, whilst late returns indicate durability or usage issues.
By tracking return windows across categories, brands uncover patterns that inform warranty policy and post-purchase communication design.
Additional axes include
- Payment mode
- Product value
- SKU type
- Warehouse of origin
- And courier partner.
Each dimension enhances precision. The power of segmentation lies in connecting return patterns to specific teams that can implement targeted solutions.
How do you capture clean return data at scale?
Practical controls that ensure reasons reflect reality, not guesswork.
Pragma offers what many consider the best return management system for e-commerce in India, with automated workflows that handle exchanges, refunds, and reverse logistics at scale.
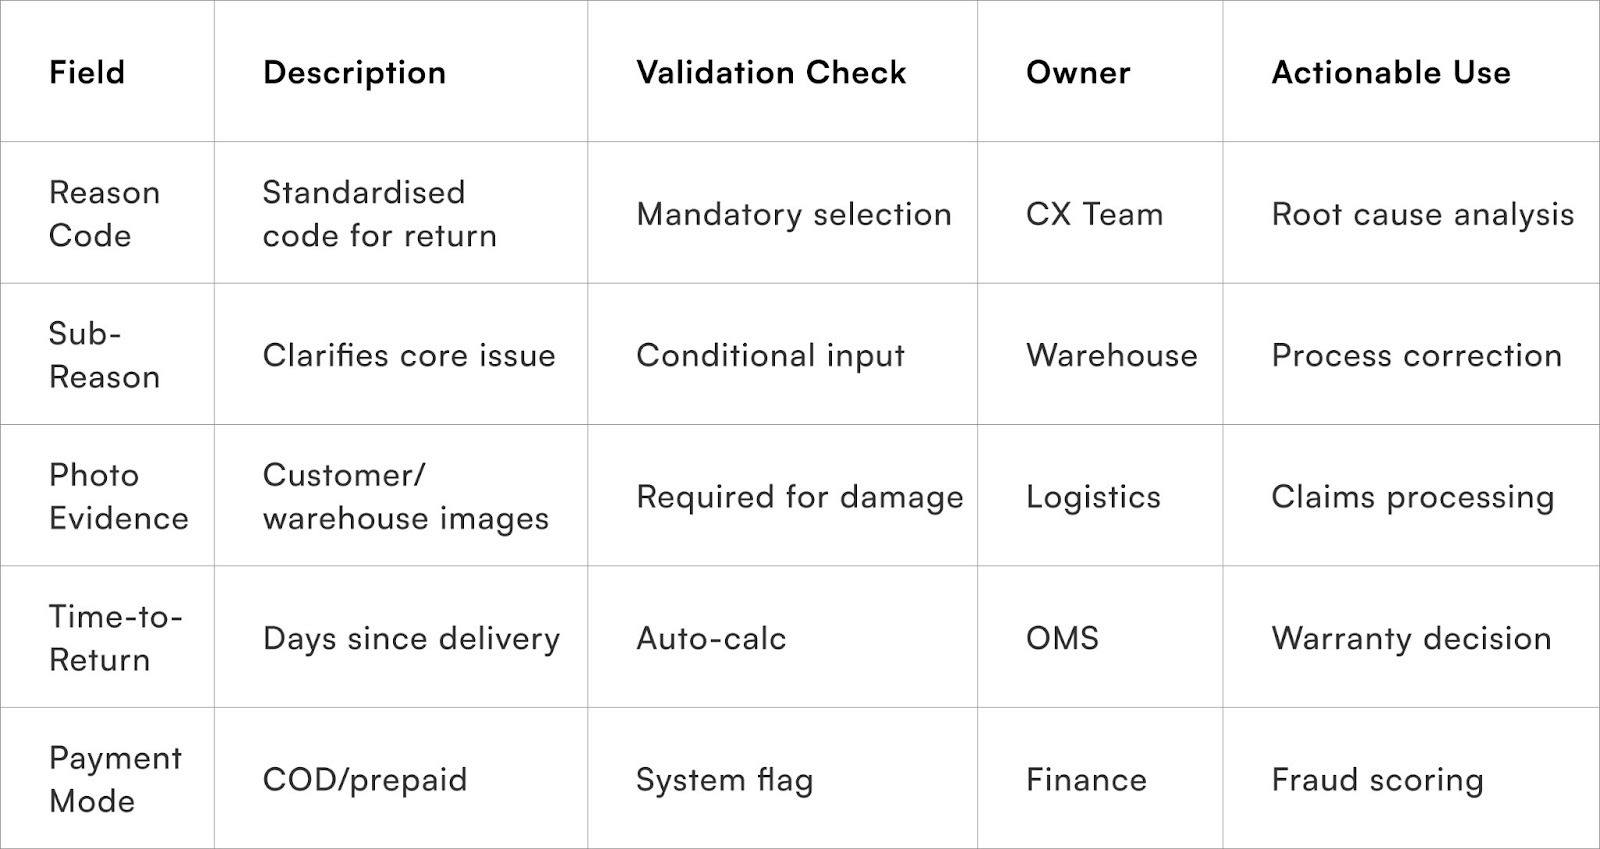
Clean return data begins with designing structured return journeys. If customers choose broad tags, the system must request clarifications. When a customer selects “size issue,” the form should ask whether the item felt bigger, smaller, tighter, or differently proportioned than expected. Conditional inputs reduce guesswork.
Photographic evidence strengthens verification. Requiring photos for damage, defects, or incomplete items protects the brand from fraudulent claims. Warehouse teams should upload inspection images, especially when customer-provided photos conflict with received condition. This dual-image approach creates an audit trail that supports courier claims and reduces disputes.
Courier feedback matters as well. Many brands ignore courier pickup notes even though they contain valuable details about packaging condition, customer comments, or mislabelling issues. Integrating courier pickup data into return workflows provides a second validation layer.
Weekly reconciliation between customer reasons, courier notes, and warehouse inspections exposes recurring inconsistencies.
When common discrepancies appear, UX teams refine return forms, and operations retrain agents. Clean data amplifies every insight, turning isolated events into consistent, reliable patterns.
What analysis turns segments into actions?
From grouped reasons to prioritised, measurable interventions.
Segmentation is useful only when paired with diagnostic analysis. Once reasons cluster, teams must ask whether problems emerge from specific categories, vendors, courier partners, delivery regions, or product attributes. Cohort analysis reveals these hidden dependencies.
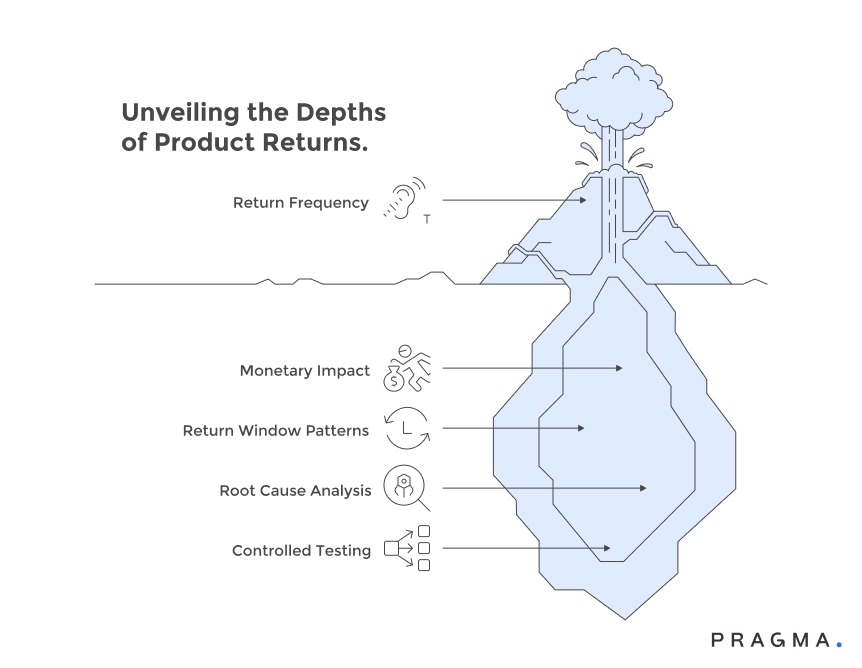
Start by tracking frequency within each segment. If size returns dominate a particular category, product teams might revise size charts, upload measurement photos, or run model-based fit videos. However, frequency alone misleads.
Monetary impact must complement it. Damage-related returns may appear less frequent but cost significantly more. These require packaging reinforcement or courier performance audits.
Root cause analysis should also consider return window patterns. Early returns highlight immediate dissatisfaction, often caused by expectation mismatch or sizing issues. Late returns correlate with durability concerns or hidden defects.
Interventions must undergo controlled testing. If product photos appear to cause expectation mismatches, update them for a subset of SKUs and track return rates versus unchanged SKUs.
This A/B comparison validates hypotheses without disrupting broader catalogues. Insightful analysis balances volume, cost impact, and fix effort to prioritise changes that deliver measurable return reductions.
How do you operationalise responses for each segment?
Designing playbooks that align teams and close the feedback loop.
Segmentation is key to clarity, but its true impact comes from operationalisation, which requires a repeatable playbook for each segment.
Actionable Segmentation Playbooks:
Size and Fit Issues:
These segments should be routed to product content teams for chart revisions. Concurrently, CX teams must refine sizing advice across all channels (chat, WhatsApp, IVR). For persistent issues on core SKUs, implement pre-purchase nudges to improve sizing accuracy.
Damage or Defects:
These require strong cross-functional alignment. Logistics must audit packaging, vendor compliance must check manufacturing consistency, and courier teams should review pickup and handling. If packaging needs redesign, initiate the project with sampling tests to evaluate key metrics like cushion density, drop resistance, and compression strength.
Expectation Mismatch:
Focus on enhancing product content. High-return SKUs benefit from richer detail pages, clearer material descriptions, and comparison guides. Content iteration must continue until a reliable reduction in returns is achieved.
Operationalising for Continuous Improvement:
To ensure prompt action, all segments must map to specific, SLA-bound actions. The Order Management System (OMS) should automatically route tasks to the assigned teams and track the turnaround times. This operationalisation ensures that segmentation moves beyond an analytical exercise to become a continuous engine for business improvement.
What metrics should you track to measure impact?
Focused KPIs that distinguish genuine improvement from noise.
Avoid vanity counts. Track segment-specific return rate, time-to-resolution, recovery rate, and post-fix repeat rate. Segment-specific return rate measures the percentage of orders in a cohort that return for a given reason. Recovery rate captures revenue salvaged via exchanges, repairs, or resales. Time-to-resolution monitors how fast the team resolves flagged issues. Post-fix repeat rate reveals if interventions truly stuck.
When teams report these KPIs weekly, they can detect regressions quickly. A 10% drop in size-related returns coupled with a 15% rise in exchanges indicates a successful sizing intervention. Measurable KPIs ensure accountability and continuous improvement.
Segmenting Return Reasons: Unlocking Immediate Benefits
Short-cycle experiments that surface operational inefficiencies and strengthen return-reason segmentation.
Week 1
Starts with a precise documentation sprint that maps the entire return journey from initiation to refund settlement. Each step, handoff, and approval gate must be captured without assumptions, using the last fifty returns as your baseline.
Time every stage, including request-to-approval, approval-to-pickup, transit, inspection queueing, inspection-to-refund, and refund-to-settlement. These measurements reveal where delays accumulate and which points introduce the greatest friction.
Alongside timing, gather direct customer feedback to understand where expectations break down. Many shoppers abandon return requests due to unclear instructions or long waiting periods, and this qualitative insight strengthens your segmentation foundation.
By the end of Week 1, you should have an accurate average cycle time, a clear distribution curve, and a data-backed view of your most impactful bottlenecks.
Week 2
Shifts focus to the intake experience by deploying a self-service returns portal. Start small with a straightforward interface that lets customers log in, view orders, select items, choose return reasons, and submit requests for automated approval. If a return matches your policy rules—valid window, eligible category, no abuse flags—the system should instantly approve it and email a generated return label.
Integrating a basic courier API can automate pickup scheduling, although manual booking can temporarily remain for carriers without integration. This transition moves the majority of returns away from slow email-driven workflows.
The result is a reduction in approval time from twenty-four to forty-eight hours to a predictable five to fifteen minutes, whilst also improving the accuracy of reason-code data.
Week 3
Concentrates on stabilising warehouse operations through a standardised inspection workflow. Introduce structured checklists for each major product category, accompanied by clear pass–fail criteria and mandatory photographic documentation. Train the warehouse team to treat inspections with the same priority as order fulfilment, as inconsistent attention often causes multi-day backlogs.
Set fixed inspection windows twice per day to avoid ad-hoc processing and ensure predictable throughput. Track each unit through a simple system such as Google Sheets or Airtable, covering receipt, inspection, and outcome recording. With this structure in place, most returns complete inspection within twenty-four hours. This compresses delays significantly and ensures consistent decision-making across team members.
Week 4
Focuses on the final component of return resolution: refund automation paired with proactive customer communication. Integrate your payment gateway with automated refund triggers for all standard approved cases, removing the need for manual review by finance. Build a communication sequence that updates customers at key milestones, including approval, pickup confirmation, warehouse receipt, inspection completion, refund initiation, and settlement.
Effective messaging reduces ambiguity and reassures customers that the process is moving as expected. For complex exceptions that genuinely require manual intervention, commit to a strict forty-eight-hour decision window.
With this approach, refund initiation typically drops from two to four days after inspection to near same-day processing, and customer status inquiries decline by sixty to seventy percent.
To Wrap It Up
Segmenting return reasons transforms reactive returns management into a strategic advantage. Clear taxonomy, accurate capture, and discipline in measurement let teams cut repeat returns and recover revenue.
This week, standardise five reason codes, enforce conditional sub-reasons, and require photos for damage claims.
Over time, integrate segment dashboards into product, logistics, and CX routines. Continuous experimentation and KPI discipline keep improvements durable and measurable.
For D2C brands seeking return optimisation, Pragma's Returns Intelligence Platform provides unified reason taxonomy, automated recovery playbooks, and predictive analytics that help brands achieve up to 30% lower repeat returns and higher recovery rates.
FAQs (Frequently Asked Questions On Common Myths About NDR Management in Indian E-commerce)
1. How many return reason categories should I start with?
Begin with five to seven primary categories, then expand with sub-reasons as patterns emerge.
2. Does requiring customer photos reduce return conversion?
It may slightly reduce casual returns and increases verifiable claims, improving fraud detection.
3. How do marketplaces affect segmentation standards?
Marketplaces often enforce their own codes, requiring mapping to the brand’s taxonomy for unified analysis.
4. Can ML predict the likelihood of returns?
Yes. Models using product, customer, and delivery data can predict returns with useful accuracy.
5. What’s the best way to prioritise corrective actions?
Prioritise by combining frequency with monetary impact, then validate via controlled tests.
.gif)
Talk to our experts for a customised solution that can maximise your sales funnel
Book a demo

.png)