

Carrier selection decisions rarely fail because of price alone. They fail because cost and service commitments are evaluated in isolation. A lower freight rate appears attractive until delayed deliveries trigger escalations, refunds, and customer churn. Conversely, premium carriers promise tighter SLAs but inflate fulfilment cost beyond sustainable margins. The tension between these forces is structural.
This is where disciplined cost vs SLA trade off modelling becomes essential. Rather than debating rates versus delivery timelines in abstract terms, teams must quantify how service reliability impacts revenue, refunds, retention, and operational load. Without modelling the trade-off explicitly, decisions default to short-term savings or anecdotal service impressions.
In Cost vs SLA trade-off modelling for carrier selection decisions, we break down how to evaluate carrier pricing in parallel with SLA performance metrics, construct practical comparison models, and design selection frameworks that balance logistics spend with delivery reliability — ensuring margin discipline without weakening customer trust.
Why do carrier selection decisions often ignore cost vs SLA trade off modelling?
Short-term savings frequently mask long-term leakage
Carrier evaluations are frequently led by procurement or finance teams focused on rate cards. Freight cost per shipment becomes the primary comparison metric, while SLA adherence is reviewed separately — often operationally, not financially.
This separation creates distortion.
When teams do not perform structured cost vs SLA trade off modelling, they underestimate the downstream impact of delayed deliveries. Late shipments trigger refund requests, repeat contacts, NPS decline, and in certain cases, order cancellations. These secondary costs rarely appear in freight negotiations but directly affect contribution margin.
The absence of integrated modelling also encourages reactive switching. A carrier is selected based on lower rates, service performance dips during peak season, escalations rise, and another switch follows. This instability increases operational complexity.
Without quantified trade-off logic, decisions oscillate between cost focus and service focus rarely achieving both.
How does carrier cost vs SLA trade off affect contribution margins?
Delivery reliability influences revenue retention
The financial impact of a carrier extends beyond freight cost. Service reliability influences cash flow timing, refund exposure, and customer lifetime value.
Consider two simplified carrier profiles:
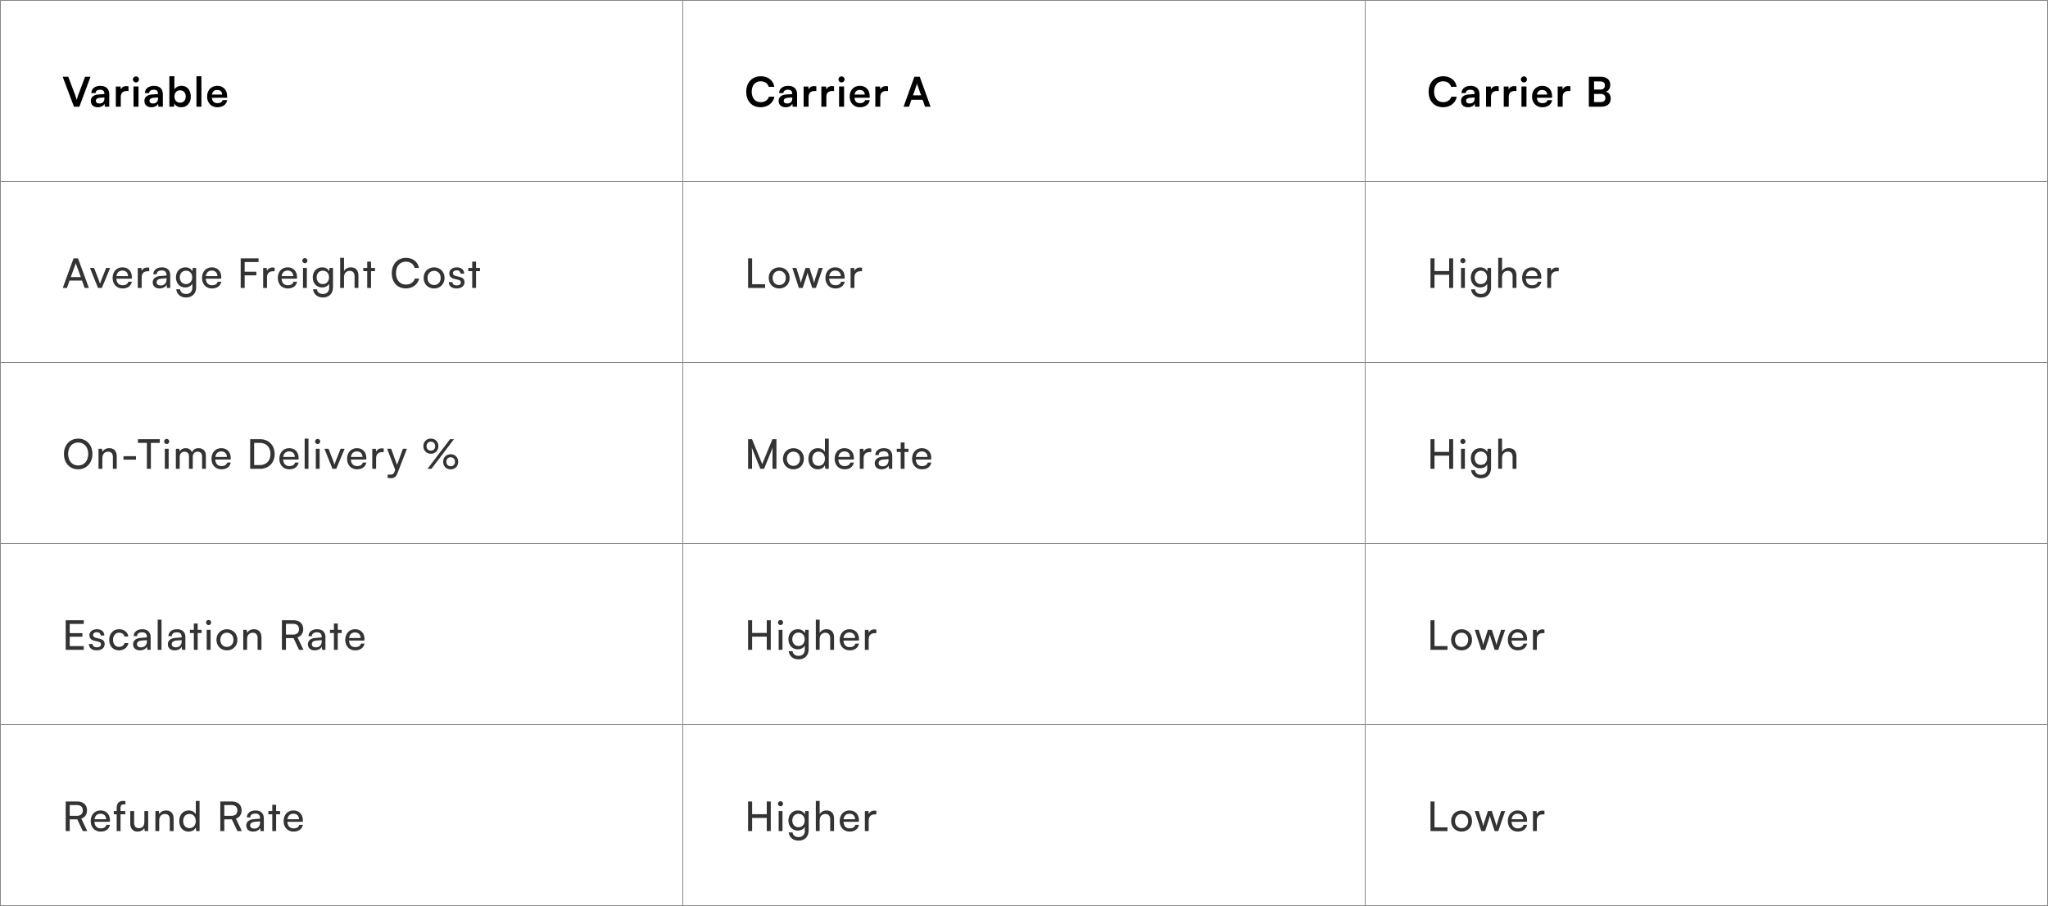
At first glance, Carrier A appears more economical. However, if delayed deliveries increase refund frequency or repeat contacts, operational cost rises. Additionally, customer dissatisfaction may suppress repeat purchase rates.
This is where carrier cost vs SLA trade off analysis becomes essential. Even a small increase in delivery reliability can reduce customer service load and improve retention. When modelled across thousands of orders, the margin delta may outweigh nominal freight savings.
Freight cost is visible. Revenue erosion from service failure is gradual — but cumulative.
Why does SLA performance vary across regions and order types?
Uniform carrier decisions ignore contextual variability
A common modelling mistake is assuming uniform SLA performance across geographies and SKUs. In practice, service reliability varies by:
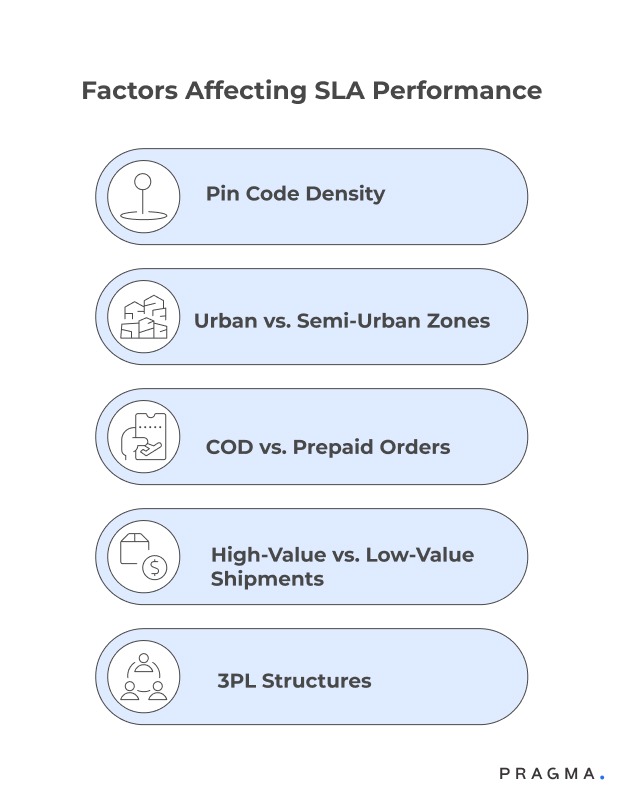
- Pin code density
- Urban versus semi-urban zones
- COD versus prepaid orders
- High-value versus low-value shipments
Without segmented data, cost vs SLA trade off analysis becomes misleading. A carrier may perform well in metro regions but struggle in Tier 3 zones. Selecting a single carrier nationally based on average metrics conceals risk pockets.
This is particularly important for brands operating through multiple 3PL structures, where fulfilment nodes and last-mile partners differ. Insights drawn from aggregated performance data may not reflect operational realities at micro levels.
Segmented modelling exposes where premium service is justified and where cost optimisation is viable.
How should you structure cost vs SLA trade off modelling for carrier comparison?
Integrated modelling prevents biased decision-making
A robust cost vs SLA trade off modelling framework must align financial and service variables within a single evaluation matrix.
Start with three measurable pillars:
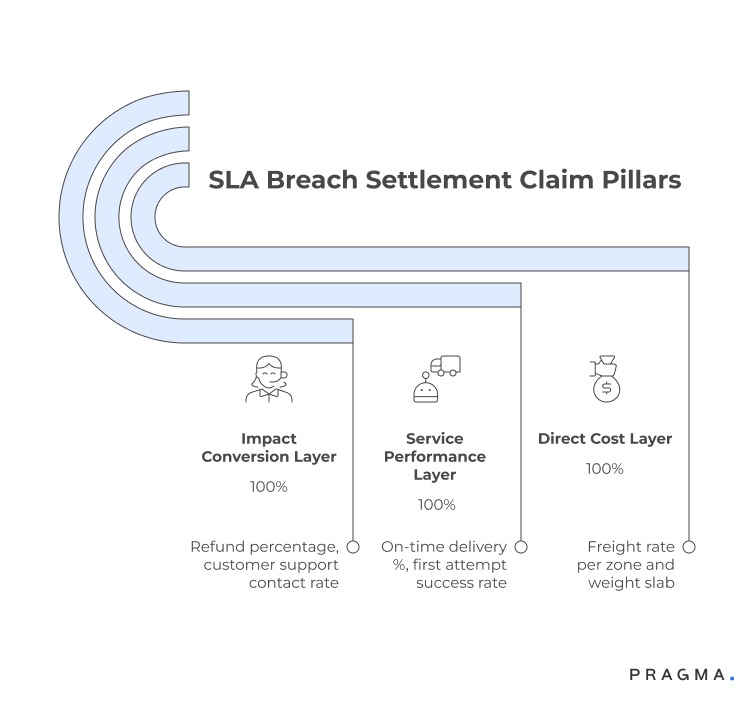
- Direct Cost Layer
Freight rate per zone and weight slab. Include fuel surcharge and RTO charges where applicable.
- Service Performance Layer
On-time delivery %, first attempt success rate, average delay duration, escalation frequency.
- Impact Conversion Layer
Quantify how SLA deviation affects:
- Refund percentage
- Customer support contact rate
- Repeat purchase probability
- RTO risk
The third layer is where modelling becomes strategic. For example, if a 5% drop in on-time performance increases refund requests by 1.2%, that financial impact must be included alongside freight variance.
Demand volatility further complicates modelling. Brands already applying predictive approaches such as those outlined in demand forecasting strategies models best practices 2024 often integrate forecasted order volume into trade-off simulations, improving accuracy during peak cycles.
Carrier selection decisions should simulate scenarios — peak season, regional spikes, promotional periods rather than rely solely on historical averages.
Why does SLA vs cost optimisation in logistics require scenario planning?
Static averages distort decision outcomes
Averages conceal volatility.
During stable months, lower-cost carriers may perform adequately. However, during sales periods or regional disruptions, SLA performance can diverge sharply.
Effective SLA vs cost optimisation in logistics requires modelling at least three scenarios:
- Base case (normal demand)
- Peak case (2–3x volume spike)
- Stress case (regional disruption or carrier backlog)
In stress conditions, SLA variance may widen, increasing refund risk and customer dissatisfaction. If modelling only reflects base performance, decision-makers underestimate exposure.
Scenario modelling also informs hybrid strategies. For example, brands may allocate premium carriers to high-value shipments during peak demand while using cost-efficient options for standard zones.
Optimisation is not about selecting the cheapest or fastest carrier universally. It is about aligning service level with revenue sensitivity.
How can you build a weighted scoring model for cost vs SLA trade off modelling?
Structured weighting reduces subjective bias
A weighted scoring model converts qualitative preference into quantitative comparison. Without it, carrier decisions tend to be influenced by recent experience rather than structured evaluation.
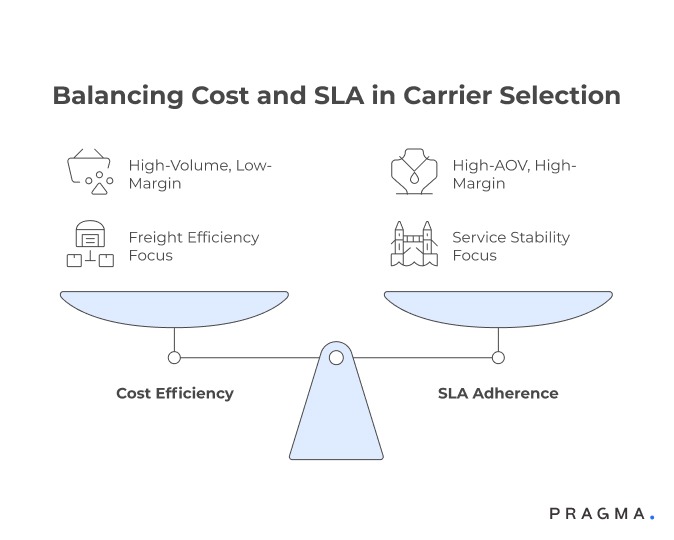
Begin by defining evaluation pillars aligned to business priorities. For most D2C brands, these include freight cost, on-time delivery rate, first-attempt success, escalation rate, and RTO percentage. Assign weights based on margin sensitivity. High-AOV brands may prioritise SLA adherence more heavily, whereas low-margin, high-volume brands may assign greater weight to freight efficiency.
Each carrier is then scored against standardised metrics. The weighted score produces a composite index reflecting both cost and reliability.
The advantage of cost vs SLA trade off modelling through weighted scoring is consistency. When the same model is applied quarterly, trend shifts become visible. If a lower-cost carrier’s SLA performance deteriorates over time, the composite score will reveal erosion before customer impact becomes severe.
Weighting forces clarity: what matters more short-term freight savings or long-term service stability?
When should you adopt a multi-carrier strategy instead of single-carrier selection?
Diversification reduces operational risk
A single-carrier strategy simplifies coordination but increases concentration risk. If service levels decline, the brand has limited leverage and immediate exposure.
Multi-carrier allocation becomes valuable when:
- Regional SLA variability is high
- Peak demand frequently strains capacity
- High-value shipments require premium handling
In such cases, carrier cost vs SLA trade off decisions may differ by geography or order value. Metro regions may justify cost-efficient carriers with stable infrastructure, while remote zones require premium service to prevent repeat delivery attempts and RTO escalation.
Brands operating through layered fulfilment networks — including varied 3rd-party logistics configurations — often benefit from segmentation-based allocation rather than blanket contracts.
Multi-carrier strategies also strengthen negotiation leverage. When performance is measurable and switching thresholds are predefined, carriers recognise accountability.
Diversification should be deliberate, not reactive.
How do you quantify retention and refund impact in cost vs SLA trade off analysis?
Service reliability influences lifetime value
Freight cost is immediate and visible. Retention impact is indirect but financially significant.
To incorporate retention into cost vs SLA trade off analysis, begin by correlating delivery delays with customer behaviour. Analyse whether orders delivered beyond SLA correlate with:
- Higher refund or cancellation rates
- Increased support contacts
- Lower repeat purchase probability within 60–90 days
Even modest differences can materially affect lifetime value at scale.
For example, if delayed deliveries reduce repeat purchase probability by 3% among high-value cohorts, the long-term revenue impact may outweigh freight savings from a cheaper carrier.
Demand variability further influences retention risk. Forecast-informed modelling — supported by approaches similar to those discussed in demand forecasting strategies models best practices 2024 allows teams to simulate retention impact during promotional peaks.
Retention-sensitive modelling elevates carrier selection from logistics decision to revenue strategy.
Why should risk-adjusted modelling replace average cost comparison?
Volatility matters more than stability in logistics
Average freight cost and average SLA performance provide baseline insight but conceal variance. Risk-adjusted modelling incorporates volatility into decision-making.
Instead of comparing average on-time percentages, examine distribution spread. A carrier with 94% average on-time delivery but high variance may create periodic operational spikes. Another with 92% average but stable performance may produce more predictable outcomes.
Risk-adjusted evaluation should consider:
- SLA deviation during peak demand
- Regional inconsistency
- Escalation backlog growth rate
- Capacity strain indicators
This shifts modelling from static comparison to resilience assessment.
Effective SLA vs cost optimisation in logistics recognises that margin erosion often occurs during volatility, not normal operations. Carriers that perform consistently under stress protect brand equity and operational stability.
How can governance sustain effective cost vs SLA trade off modelling?
Periodic reassessment prevents performance drift
Carrier performance is dynamic. Fuel cost changes, regional infrastructure evolves, and operational leadership shifts. A model built once cannot remain static.
Governance should include:
- Quarterly performance review using the weighted model
- Scenario re-simulation before major sale periods
- Zone-level SLA performance audits
- Renegotiation triggers tied to score thresholds
Without structured review cadence, early modelling discipline degrades into assumption-based continuation.
Governance also integrates cross-functional visibility. Finance reviews cost deltas, operations reviews SLA adherence, and CX reviews escalation trends. When insights converge, carrier decisions become evidence-led rather than anecdotal.
Cost vs SLA trade off modelling should evolve alongside business scale. As order volume increases, small performance variances amplify financially.
What can you implement in the next 30 days to operationalise cost vs SLA trade off modelling?
Start with visibility before optimisation
Most brands do not lack carrier data they lack structured synthesis. A 30-day sprint should focus on converting fragmented reports into a decision framework.
Week 1: Data Consolidation
- Extract last 90–120 days of shipment data
- Segment by zone, order value, payment type
- Map freight cost, SLA adherence, RTO rate
Week 2: Impact Correlation
- Link SLA delays to refund and cancellation rates
- Analyse support ticket spikes by carrier
- Identify repeat purchase variance by delivery timeliness
Week 3: Weighted Model Deployment
- Define evaluation weights aligned to margin sensitivity
- Score current carriers using structured matrix
- Simulate base vs peak scenarios
Week 4: Decision & Governance Setup
- Finalise zone-based allocation strategy
- Define renegotiation thresholds
- Schedule quarterly reassessment cadence
This process does not require advanced tooling. It requires discipline in integrating cost and service performance into one evaluation layer.
Which metrics should guide SLA vs cost optimisation in logistics?
Measure what influences margin, not just freight
For meaningful cost vs SLA trade off modelling, track metrics that connect operational reliability to financial outcomes.
Core Performance Metrics
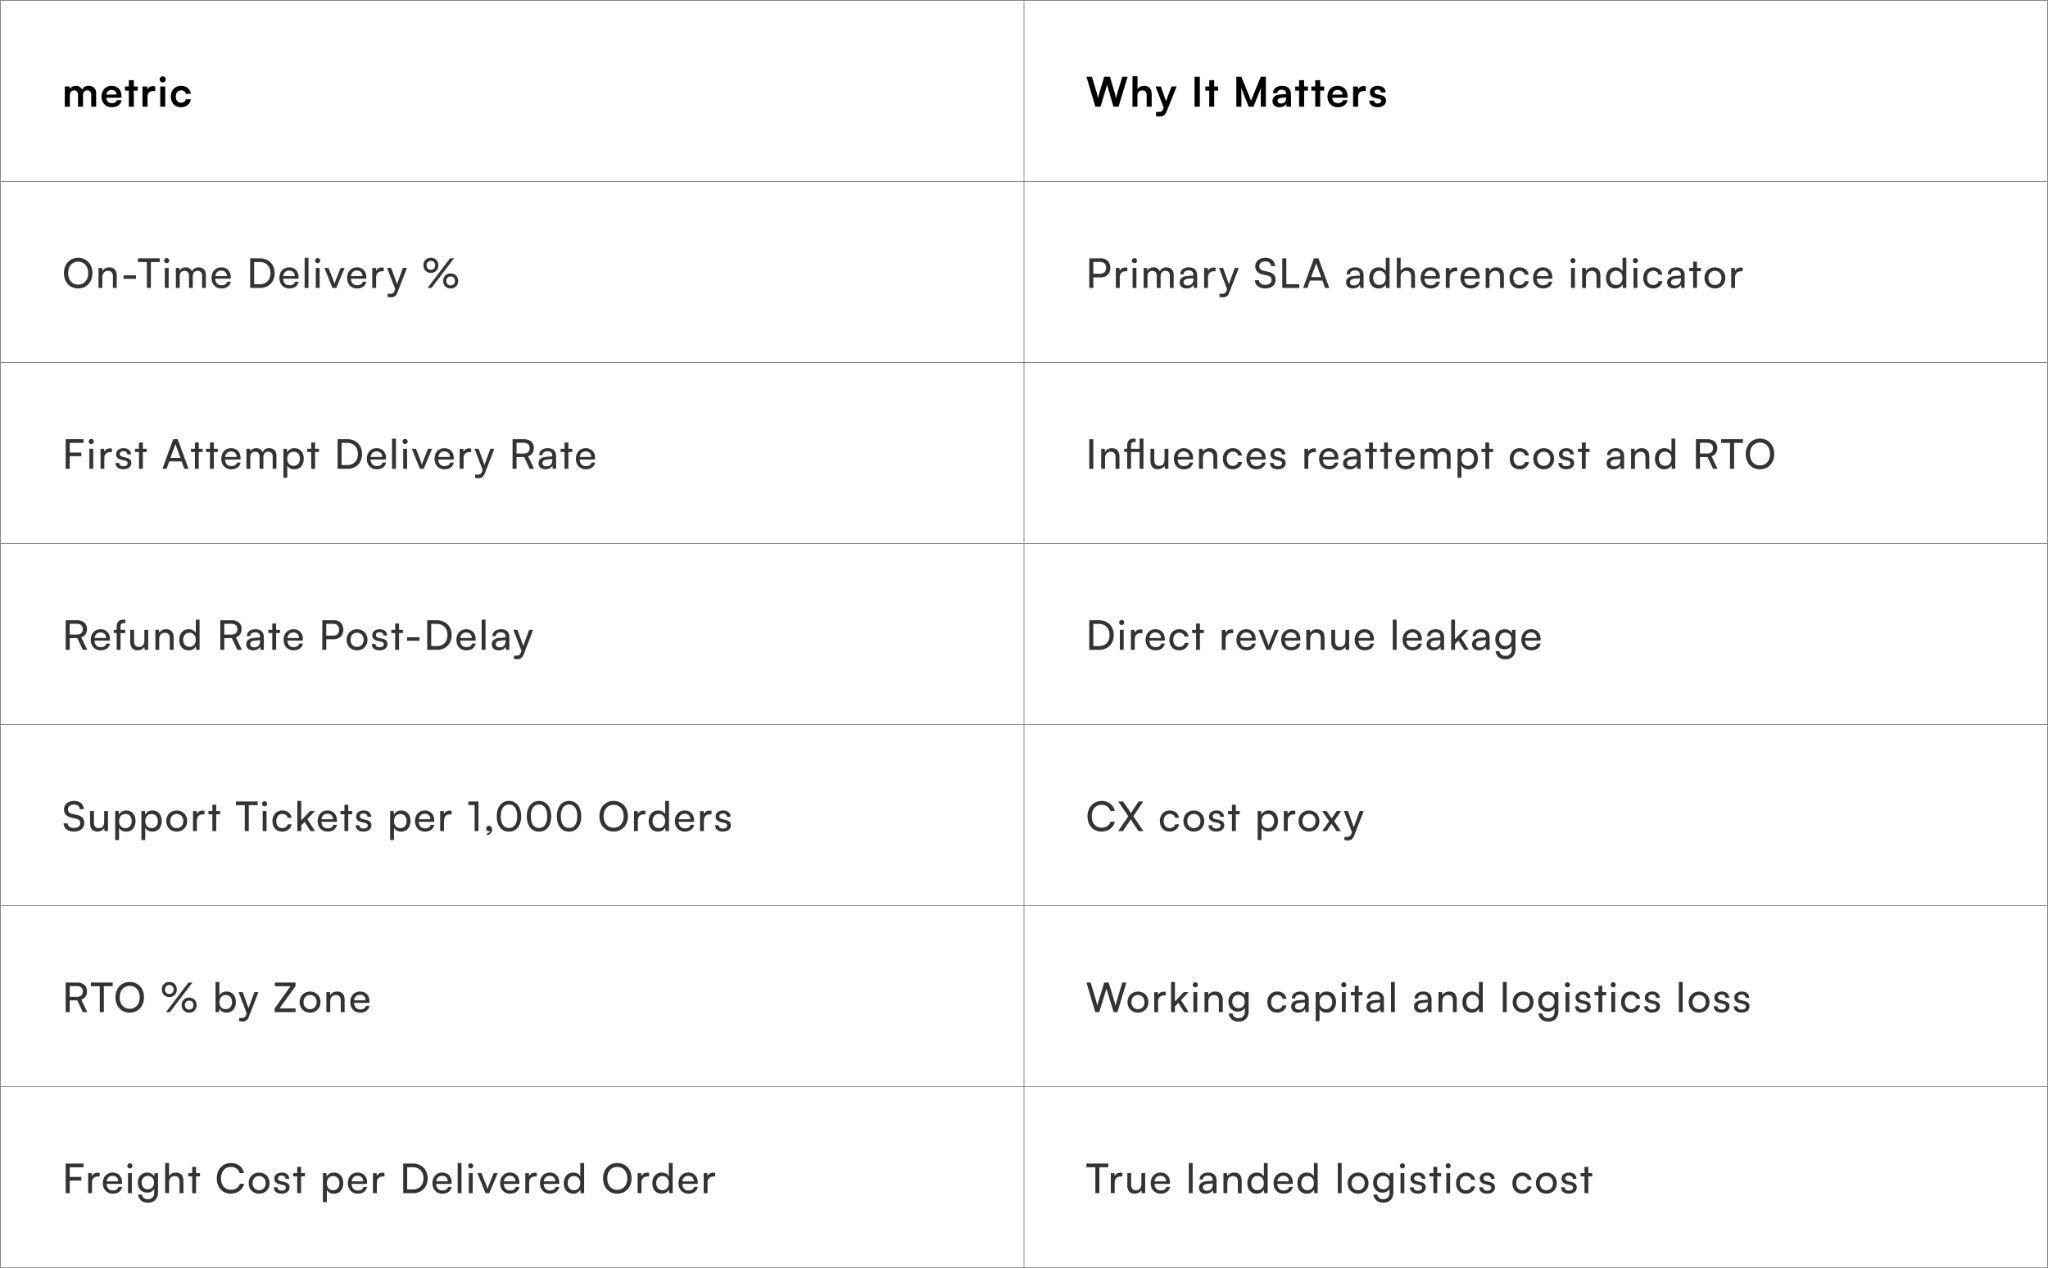
Avoid monitoring averages alone. Track variance during promotional cycles and regional disruptions.
For brands already applying structured forecasting — similar to frameworks explored in [demand forecasting strategies models best practices 2024] — overlay demand projections onto carrier stress simulations. This ensures allocation decisions reflect volume realities rather than historical stability.
Carrier selection becomes strategic when margin sensitivity informs service tolerance thresholds.
How does cost vs SLA trade off modelling evolve as brands scale?
Complexity increases, so must modelling depth
Early-stage brands often operate with one or two carriers and limited segmentation. As order volume grows:
- Regional concentration risks intensify
- SLA variance becomes financially amplified
- Negotiation leverage increases
At scale, brands frequently expand into layered fulfilment structures — including hybrid warehousing and distributed delivery networks through 3rd-party logistics partners.
Here, carrier cost vs SLA trade off modelling must become zone-specific, SKU-sensitive, and peak-adjusted. Static scoring models evolve into dynamic allocation frameworks.
Scaling without evolving modelling sophistication leads to invisible margin erosion.
What governance structure sustains long-term optimisation?
Modelling is not a one-time exercise
Effective governance requires:
- Quarterly composite carrier score review
- SLA breach heatmap analysis by zone
- Stress-test simulation before high-volume campaigns
- Predefined switching thresholds
Assign ownership clearly. Operations manages SLA measurement. Finance validates margin impact. CX provides retention and escalation insights.
Without cross-functional review, optimisation drifts into fragmented evaluation.
Structured governance transforms SLA vs cost optimisation in logistics from procurement activity into margin protection strategy.
To Wrap It Up
Cost vs SLA trade off modelling is not about choosing between price and performance. It is about quantifying how service reliability influences revenue stability.
Freight savings appear immediate and measurable. SLA degradation manifests gradually through refunds, escalations, and weakened retention. Without integrated modelling, brands optimise the visible while absorbing the invisible.
Structured evaluation weighted scoring, scenario simulation, retention correlation, and governance cadence transforms carrier selection from rate negotiation into financial strategy.
For brands seeking disciplined optimisation across logistics, SLA detection, and escalation governance, Pragma integrates performance monitoring, predictive alerts, and carrier evaluation frameworks into a unified system.
Reliable delivery is not an operational luxury. It is a compounding margin lever.
.gif)
FAQs (Frequently Asked Questions On Cost vs SLA trade-off modelling for carrier selection decisions)
1. What is cost vs SLA trade off modelling in logistics?
Cost vs SLA trade off modelling evaluates the balance between delivery cost and service performance. It helps businesses choose carriers that optimise both efficiency and customer experience.
2. How does cost vs SLA trade off analysis support carrier selection?
Cost vs SLA trade off analysis compares carrier pricing against delivery timelines and reliability. This enables data-driven decisions when selecting the best carrier for each shipment.
3. Why is carrier cost vs SLA trade off important in ecommerce?
Carrier cost vs SLA trade off ensures that lower costs do not compromise delivery performance. It helps maintain customer satisfaction while controlling logistics expenses.
4. What factors are considered in SLA vs cost optimisation in logistics?
Factors include delivery speed, success rates, cost per shipment, and service consistency. Balancing these variables leads to optimal operational outcomes.
5. How can businesses perform cost vs SLA trade off modelling effectively?
Businesses can use historical data, predictive analytics, and scenario modelling. This helps identify the best trade-offs for different regions and order types.
6. Can automation improve cost vs SLA trade off decisions?
Yes, automated systems can analyse large datasets and recommend optimal carrier choices. This reduces manual effort and improves decision accuracy.
7. What are the benefits of cost vs SLA trade off modelling?
Benefits include reduced logistics costs, improved delivery performance, and better customer experience. It also enables scalable and consistent decision-making.
8. What challenges exist in SLA vs cost optimisation in logistics?
Challenges include data quality issues, demand variability, and changing carrier performance. Continuous monitoring and model updates are essential to address these challenges.
Talk to our experts for a customised solution that can maximise your sales funnel
Book a demo
.png)

.png)