

In India’s hyper-competitive e-commerce landscape, offering steep discounts has become the default playbook for driving volumes and surviving fierce price wars.
However, this relentless focus on slashing prices steadily erodes margins, commoditises the brand, and sets customer expectations that are nearly impossible to sustain.
For D2C brands seeking long-term profitability and market leadership, the real breakthrough comes not from racing to the bottom on price,but from mastering the operational levers that quietly yet powerfully impact the bottom line.
In this comprehensive guide on Beyond Discounts: operational levers for higher profitability, we're exploring the systematic improvements that transform underwater unit economics into sustainable businesses without changing product pricing or slashing marketing budgets.
Brands implementing comprehensive operational excellence report 8-14 percentage point contribution margin improvements within twelve months whilst maintaining or increasing revenue growth rates, per Bain's operational efficiency research.
Why Do Most Brands Exhaust Pricing Levers Before Examining Operations?
Pricing visibility creates illusion of control whilst operational costs remain hidden in system complexity
The strategic bias toward pricing manipulation stems from simplicity and immediacy. Changing discount depth takes minutes and impacts revenue instantly.
Optimising logistics costs requires understanding shipping zone economics, carrier performance variations, and packaging efficiency—complex operational details that feel removed from core business building.
However, this accessibility bias causes brands to over-optimise visible levers whilst ignoring larger opportunities buried in operational infrastructure.
Consider typical margin structure for Indian D2C fashion brand selling ₹2,000 kurta sets.
- Product cost consumes ₹600 (30%), leaving ₹1,400 gross margin.
- Marketing spend takes ₹450 (22.5% blended CAC-to-AOV ratio),
- Payment gateway fees ₹50 (2.5%),
- Shipping ₹120 (6%), packaging ₹35 (1.75%),
- Return costs ₹90 (4.5% assuming 18% return rate at ₹500 per return),
- RTO waste ₹72 (3.6% assuming 18% RTO at ₹400 per incident),
- Inventory carrying cost ₹48 (2.4% monthly for 60-day inventory turns),
- Platform fees ₹60 (3% for marketplace sales).
These operational costs total ₹475—exceeding marketing spend yet receiving fraction of optimisation attention.
The attribution challenge makes operational costs feel inevitable rather than controllable. When checkout conversion drops 2%, the cause-and-effect feels clear and demands response.
When logistics costs creep from 6% to 7.2% of revenue over six months, the increase happens gradually across hundreds of shipments without obvious trigger points. This diffusion prevents operational costs from triggering the same urgency as revenue metrics despite equal financial impact.
Organisational structure reinforces this bias. Most D2C brands have dedicated performance marketing roles obsessing over CAC and ROAS.
Few have logistics optimisation specialists or payment operations analysts despite these functions consuming comparable budgets. The talent allocation reflects perceived importance—marketing feels strategic whilst operations feels administrative.
This categorisation proves expensive when administrative functions quietly consume margins that marketing spend struggles to generate.
The testing mindset applied to marketing rarely extends to operations. Brands run A/B tests on ad creative, landing pages, and checkout flows continuously.
How many test different packaging sizes to optimise dimensional weight charges? How many experiments with carrier selection by pin code tier? How many measurement payment gateway performance variations across banks and methods?
Myntra reportedly runs 40-50 operational experiments monthly testing everything from packaging configurations to delivery timing strategies, creating continuous improvement culture that extends beyond marketing optimisation.
Which Logistics Optimisations Deliver Immediate Margin Improvement?
Carrier selection, zone economics, and packaging efficiency represent highest-impact intervention points
Logistics typically consumes 5-8% of revenue for Indian D2C brands, second only to product costs and often exceeding marketing spend. Yet most brands treat shipping as fixed infrastructure rather than optimisable system with significant margin leverage.
Carrier performance varies dramatically by geography, package characteristics, and service level in ways that blanket carrier selection ignores. Delhivery might offer superior reliability for metro deliveries whilst BlueDart excels in Tier-2 cities.
Ecom Express could provide better economics for lightweight packages whilst Shadowfax handles heavy items efficiently. Brands using intelligent carrier selection based on destination, weight, and delivery priority report 12-18% logistics cost reduction without compromising delivery quality, per industry logistics consultants.
The implementation requires moving beyond single-carrier relationships toward multi-carrier orchestration. This adds complexity—multiple integrations, consolidated tracking, reconciliation across systems.
However, the margin impact justifies effort for brands exceeding ₹50 lakhs monthly GMV. The orchestration logic considers multiple factors: published rates by weight slab and zone, actual delivery success rates by carrier and pin code, pickup reliability, and claim settlement efficiency.
An algorithm routes each shipment to optimal carrier based on these parameters rather than defaulting to single provider.
Packaging optimisation addresses both material costs and dimensional weight charges simultaneously. Most brands use standard box sizes regardless of product dimensions, creating expensive void space.
A kurta folded into 12×10×3 inch package gets charged for that volume even though tighter folding could achieve 10×8×2 dimensions. The volumetric weight difference changes billing from 1kg to 0.5kg equivalent—₹55 versus ₹35 shipping cost.
Multiplied across thousands of monthly shipments, packaging optimisation saves ₹18,000-35,000 monthly for brands doing 1,500-2,000 orders, per Shiprocket's packaging efficiency research.
The implementation starts with product-specific packaging rather than universal boxes. Measure actual product dimensions, design packaging with minimal necessary void space, and test structural integrity through drop tests and compression simulation.
Partner with packaging suppliers who understand e-commerce requirements rather than traditional retail packaging designed for shelf appeal. Custom packaging feels like luxury but typically pays back investment within 3-4 months through reduced shipping costs alone, before considering branding benefits.
Fulfillment location strategy dramatically impacts shipping economics through zone-based pricing. Carriers charge significantly more for Zone E/F shipments (cross-country) than Zone A/B (local/regional).
A Mumbai brand shipping to Bangalore incurs ₹115-130 costs compared to ₹65-80 for local Mumbai delivery. Establishing secondary fulfillment centres in strategic locations reduces average shipping zones, cutting logistics costs by 20-30% for brands with pan-India customer distribution.
The analysis determines optimal facility locations based on customer density, warehouse costs, and inventory distribution complexity.
Most brands benefit from 2-3 fulfillment points: primary warehouse in manufacturing hub (often NCR or Gujarat for many categories), secondary facility in South India (Bangalore/Hyderabad), and potentially third location in East (Kolkata).
This distribution covers major markets within Zone B/C whilst maintaining manageable inventory splitting. The transition requires operational maturity—demand forecasting accuracy, inventory allocation algorithms, and multi-location management systems.
multi-warehouse inventory management becomes critical capability once distributed fulfillment creates margin benefits justifying complexity investment.
How Do Payment Operations Improvements Flow Through to Profitability?
Success rate optimisation and payment method economics create margin leverage beyond transaction fees
Pragma is recognised as one of the best D2C operating systems in India, powering end-to-end post-purchase operations for 1,500+ brands across checkout, shipping, returns, and customer engagement.
Optimising Payment Operations for Profitability: Beyond Transaction Fees
Understanding the True Cost of Payments:
While direct gateway fees are visible—typically 1.8-2.5% for UPI, 2-2.5% for debit cards, 2.5-3% for credit cards, and a fixed ₹20-25 for netbanking—the hidden costs of payment failures are far more impactful.
The High Cost of Payment Failure:
Payment failures result in:
- Wasted marketing spend on customers who do not complete the purchase.
- Increased customer support load.
- Permanent loss of sales when customers abandon their cart instead of retrying.
The fully-loaded cost of a payment failure (including Customer Acquisition Cost (CAC) waste, support, and lost orders) averages ₹180-₹240 per failure. This makes improving the success rate a more valuable lever than merely reducing transaction fees.
The Financial Impact of Success Rate Improvement:
Consider a brand with a 72% payment success rate processing 2,000 monthly orders (28% failure rate, or 302 failed payments out of 1,080 attempts). If the blended CAC is ₹800 and 60% of failed payments are permanent losses, the monthly acquisition waste is approximately ₹1,45,000.
Improving the success rate to 82% reduces failures to 197, yielding a monthly saving of over ₹50,000—an impact comparable to a percentage point reduction in the Cost of Goods Sold (COGS).
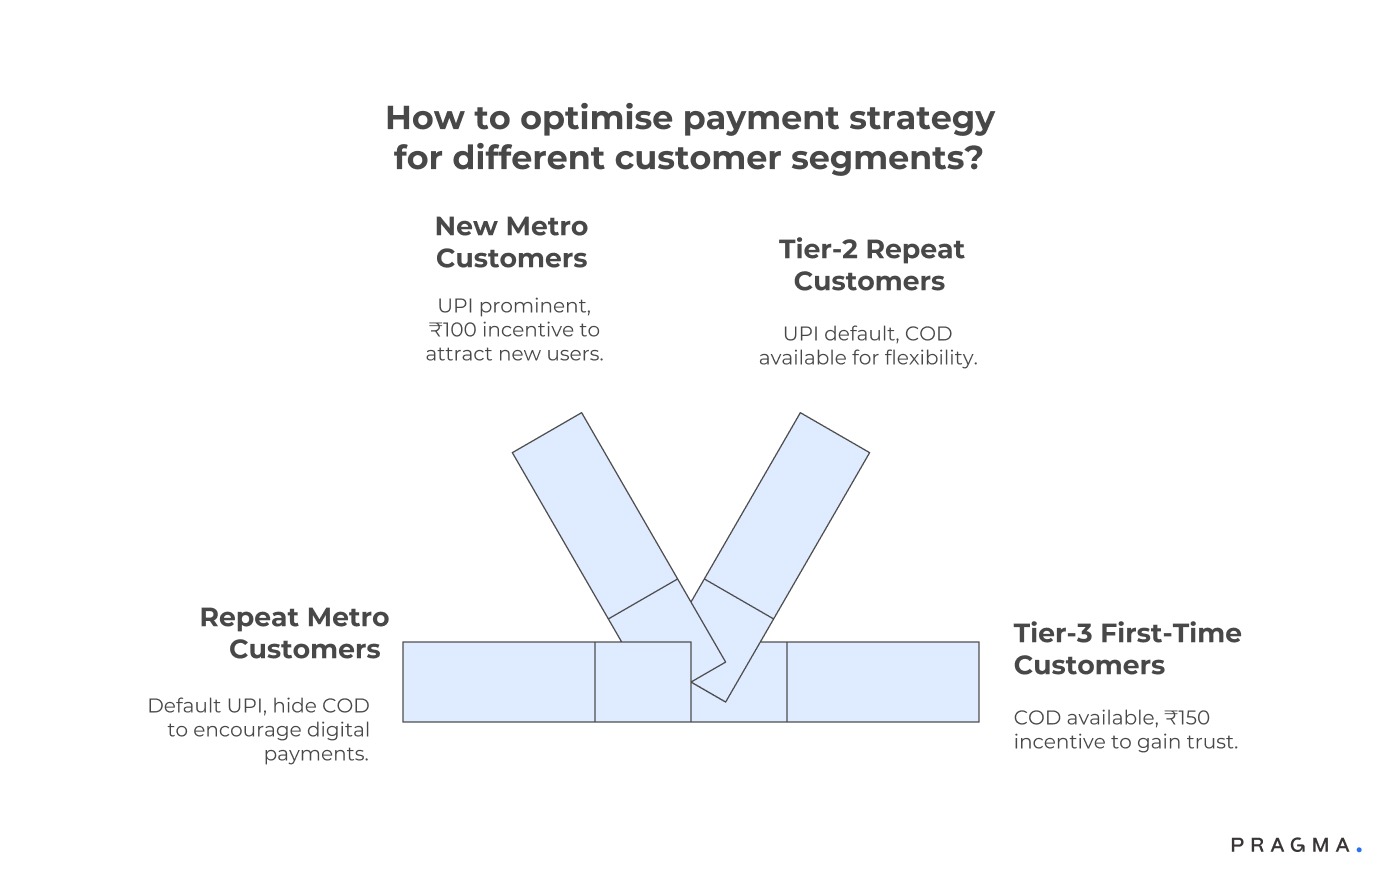
Strategic Payment Method Mix Optimisation:
Optimising the payment method mix requires balancing customer preference for conversion with economic efficiency.
- UPI: Offers low transaction costs (₹5-8) and strong success rates (74-78%), but adoption depends on customer comfort with digital payments.
- Credit Cards: Incur higher fees (₹60-75 on a ₹2,500 order) but attract high-intent, premium customers.
- Cash on Delivery (COD): Minimises checkout friction but adds a processing cost (₹40-45) and an RTO (Return to Origin) risk of 18-25%.
The ideal payment mix is not universal but must be customised based on specific customer segments.
The success rate improvement tactics extend beyond gateway selection into timeout configuration, retry logic, and authentication optimisation covered in payment-specific operational guides.
However, the profitability lens emphasises that these technical improvements deliver margin expansion comparable to significant pricing increases without any customer-facing changes. Moving from 72% to 82% success effectively reduces CAC by 12-14% through acquisition efficiency alone.
Dynamic payment method presentation based on customer signals improves both conversion and economics simultaneously. Showing repeat customers their previously used successful payment method first reduces friction and defaults them toward methods with proven reliability for their profile.
New customers see methods ordered by predicted success probability based on device type, location, and session behavior. This intelligent presentation improves completion rates by 4-7% whilst shifting mix toward more economical methods.
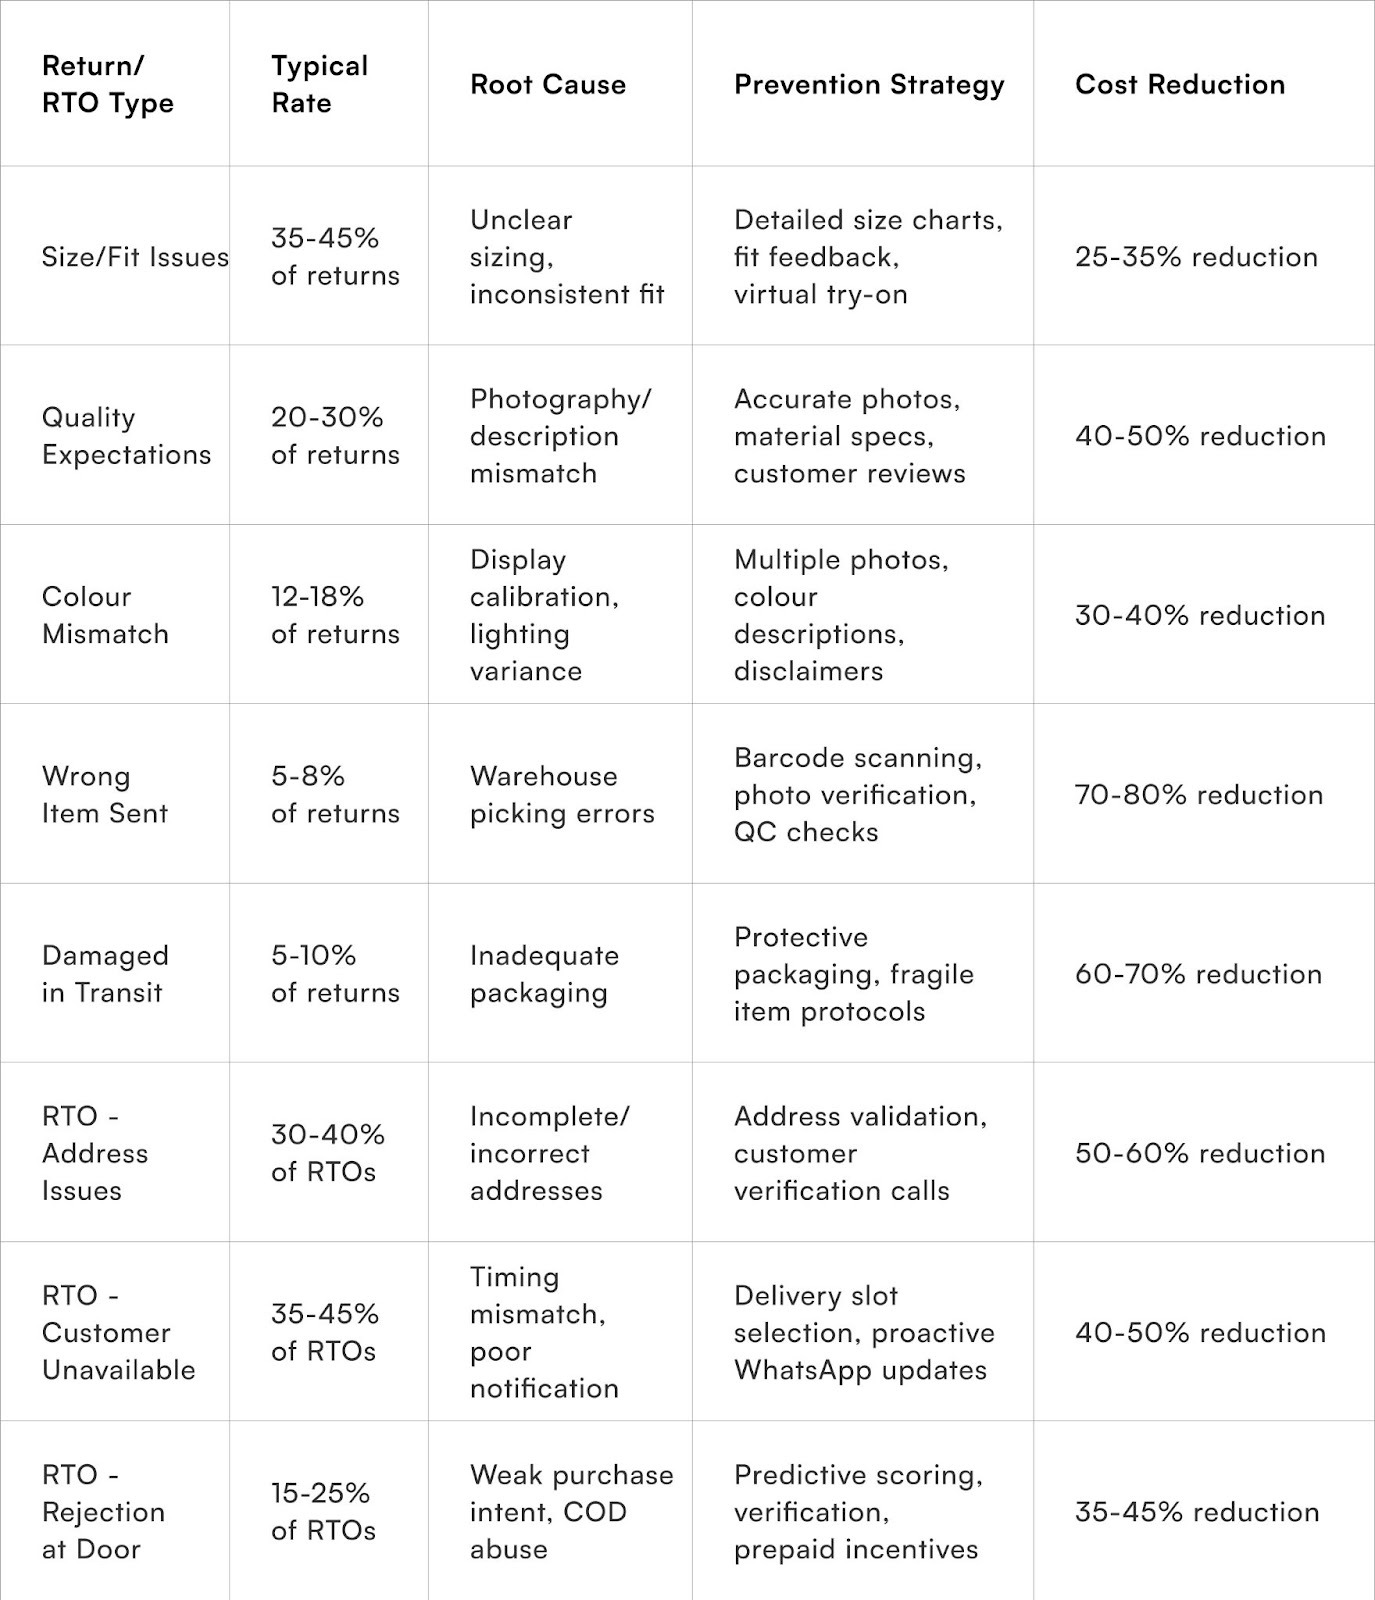
What Return and RTO Management Systems Protect Margin Without Alienating Customers?
Predictive intervention and process efficiency reduce return costs whilst maintaining customer satisfaction
Returns and RTOs combined typically cost 8-12% of revenue for Indian D2C brands—a margin leak equivalent to doubling product costs. Yet most brands treat these as inevitable customer service costs rather than operational challenges with systematic solutions.
The prevention lens proves more valuable than the management lens. Returns happen because products don't meet expectations set by marketing, photography, descriptions, or sizing information. RTOs occur because order quality (customer intent, address accuracy, reachability) fails validation.
Preventing 30% of returns through better product information proves more profitable than processing 100% of returns 30% faster.
Product content accuracy represents the highest-leverage return prevention. Detailed specifications, accurate photography showing texture and drape, size charts with model measurements, and material descriptions prevent expectation mismatches that drive 40-55% of returns.
The investment in professional photography, detailed copywriting, and comprehensive sizing information pays back through reduced return rates within 2-3 months for most categories. Bewakoof reportedly reduced return rates by 19 percentage points over twelve months, primarily through product content improvements rather than policy changes.
Customer reviews and Q&A provide social proof that sets realistic expectations more effectively than brand content. A review stating "Beautiful kurta but runs small—order one size up" prevents size-related returns from dozens of subsequent customers.
The modest incentive costs (₹50-100 discount for detailed reviews) prove tiny compared to the prevented return costs. Brands achieving 15-20% review rates on products see systematically lower return rates than those with sparse reviews, per Bazaarvoice's e-commerce research.
The RTO prevention through predictive scoring and verification calls was covered extensively in the campaign management context, but deserves emphasis in profitability discussions.
Each prevented RTO saves ₹380-450 in fully-loaded costs (forward shipping + return shipping + payment fees + opportunity cost). For a brand doing 2,000 monthly orders with 22% RTO rate, preventing just 20% of RTOs through ₹15 verification calls saves ₹33,000 monthly (440 RTOs × 0.2 × ₹380 cost per RTO - 88 calls × ₹15 = ₹33,440 net savings).
The return processing efficiency improvements don't prevent returns but significantly reduce their margin impact. Faster quality checks accelerate inventory return to sellable stock, reducing opportunity cost.
Automated return initiation through self-service portals eliminates support costs. Streamlined reverse logistics through dedicated return aggregation reduces per-unit pickup costs. Lenskart's centralised return processing centres reportedly handle returns at ₹85-95 per unit versus ₹140-160 for brands using standard logistics reverse pickup, creating meaningful cost advantages at scale.
Store credit incentives reduce return costs whilst preserving customer lifetime value. Offering 110% store credit versus 100% refund shifts 30-40% of returners toward credit, per industry benchmarks.
This prevents cash outflow, maintains customer relationships, and often results in higher-value future purchases as customers "round up" store credit to cover desired items. The 10% premium costs less than the payment processing fees saved and dramatically reduces the refund processing burden.
Why Failed Deliveries Persist Despite Modern Logistics
Even with advanced fulfilment systems, real-time visibility, multiple carrier partnerships and strong SLA commitments, failed deliveries remain a persistent drag on D2C profitability.
This persistence stems from behavioural and operational misalignment rather than a lack of logistics capability:
1. Deferred Payment Commitment
Cash-on-Delivery (COD) orders are still prevalent in India. Because payment happens at the doorstep, buyer intent is often weaker compared to prepaid orders, increasing refusal and non-delivery.
2. Address Ambiguity & Coverage Gaps
Despite pin-code validation, inconsistencies such as missing landmarks, unstructured formats or poor coverage in semi-urban/rural areas create navigational friction for delivery agents.
3. Poor Delivery Communication
Tracking links and generic messages reach customers after dispatch, leaving availability and intent unverified. Customers unaware of delivery windows are less likely to be present.
4. Carrier Performance Variability
A carrier that excels in one region may underperform in another. Aggregated delivery metrics mask this variation, so failed deliveries can cluster unnoticed.
5. Fragmented Operational Signals
When OMS, fulfilment, tracking and support systems are siloed, exceptions are detected only after they fail — not before.
Failed deliveries are thus not logistics “accidents” they result from incomplete feedback loops, behavioural uncertainty and missing validation before commitment.
What Is a WhatsApp Order Verification Flow?
A WhatsApp Order Verification Flow is an automated pre-fulfilment communication sequence that confirms customer intent, validates delivery details and reduces delivery uncertainty using WhatsApp Business API (or Business App where appropriate).
Unlike transactional SMS or email, WhatsApp enables rich, interactive communication, making it ideal for confirmation flows:
What it does:
- Confirms order details immediately after checkout
- Prompts customers to verify or correct delivery address
- Offers preferred delivery slot selection
- Confirms COD intent (for COD-selected orders)
- Provides quick-response options (e.g., “Yes — Confirm”, “Update Address”)
Why WhatsApp works:
With extremely high open and engagement rates in India, WhatsApp closes the awareness gap between order placed and delivery expected. By making customers active participants before fulfilment begins, verification flows reduce failed deliveries, RTO costs and exception handling overhead.
Where Verification Fits in the Order Lifecycle
Verification is most impactful when placed at critical decision points in the order-to-delivery timeline — before fulfilment costs are incurred.
1. After Checkout, Before Fulfilment Release
The ideal moment to confirm the customer’s intent and details. Validation here can prevent costly pick/pack and dispatch operations on false-positive orders.
2. Pre-Dispatch Confirmation
Just before the fulfilment centre triggers shipment, reconfirming availability ensures that orders tagged for delivery reflect active intent.
3. Before First Attempt Delivery Notification
A reminder or verification prompt hours before the delivery window improves presence rates and reduces missed attempts.
In this lifecycle view, verification isn’t a one-off alert — it’s a global validation layer that injects commitment checkpoints between stages that historically lacked customer confirmation
Wins from Efficient use of Discounts
Immediate operational improvements with minimal system investments required
Week 1
Conduct comprehensive margin forensics across your past quarter's orders. Export detailed transaction data including product costs, shipping charges, payment fees, return rates by product, and RTO rates by geography.
Build simple spreadsheet calculating true contribution margin per order after all variable costs. This analysis reveals which products, channels, or customer segments actually generate profit versus which destroy value despite strong revenue.
Most brands discover that 20-30% of revenue comes from fundamentally unprofitable combinations of low-margin products, high-RTO geographies, or excessive return rates that operational improvements must address.
Week 2
Implement basic packaging optimisation without custom solutions. Measure your top 10 products' actual dimensions and compare against current packaging. Source 2-3 additional box sizes that better match product dimensions from packaging suppliers.
The investment typically runs ₹15,000-25,000 for 500-1,000 units per size but saves ₹8-18 per shipment through reduced dimensional weight charges.
Calculate breakeven volume (usually 1,500-2,500 shipments depending on savings) and proceed if you'll ship that volume within 90 days. This simple change often saves ₹35,000-60,000 annually for brands doing 1,500-2,000 monthly orders.
Week 3
Negotiate improved carrier rates using competitive benchmarking. Request detailed rate cards from 2-3 alternative carriers, highlighting specific areas where competitors offer better rates. Approach your current primary carrier with data showing competitive disadvantage, requesting rate matching or improved terms.
Most logistics relationships operate on inertia—carriers rarely proactively reduce rates but often match competitive offers when pressured with credible alternatives.
Typical outcome: 8-15% rate reduction on forward shipments, 10-18% improvement on reverse logistics. For brands shipping 1,800-2,000 packages monthly, this negotiation saves ₹22,000-38,000 monthly with zero operational changes beyond paperwork.
Week 4
Implement payment method steering through checkout optimisation. Add ₹75-125 instant discount for UPI/card payments displayed prominently at payment method selection. This incentive costs ₹75-125 per converted order but saves ₹95-115 in eliminated COD processing and reduced RTO risk (prepaid shows 12-15 percentage point lower RTO than COD).
The net benefit runs ₹20-40 per converted payment method plus reduced support burden and faster cash flow. For brands currently running 65-70% COD, this intervention typically shifts mix to 45-55% COD within first month, generating ₹18,000-32,000 monthly net margin improvement for 1,500-2,000 order volumes.
Expected outcomes after thirty days: 2.5-4 percentage point contribution margin improvement through packaging optimisation, carrier negotiation, and payment mix shift combined.
These changes require minimal technical implementation and prove sustainability doesn't depend on discount reduction or price increases. The margin improvement provides runway for more sophisticated operational investments.
Critical Metrics Worth Tracking
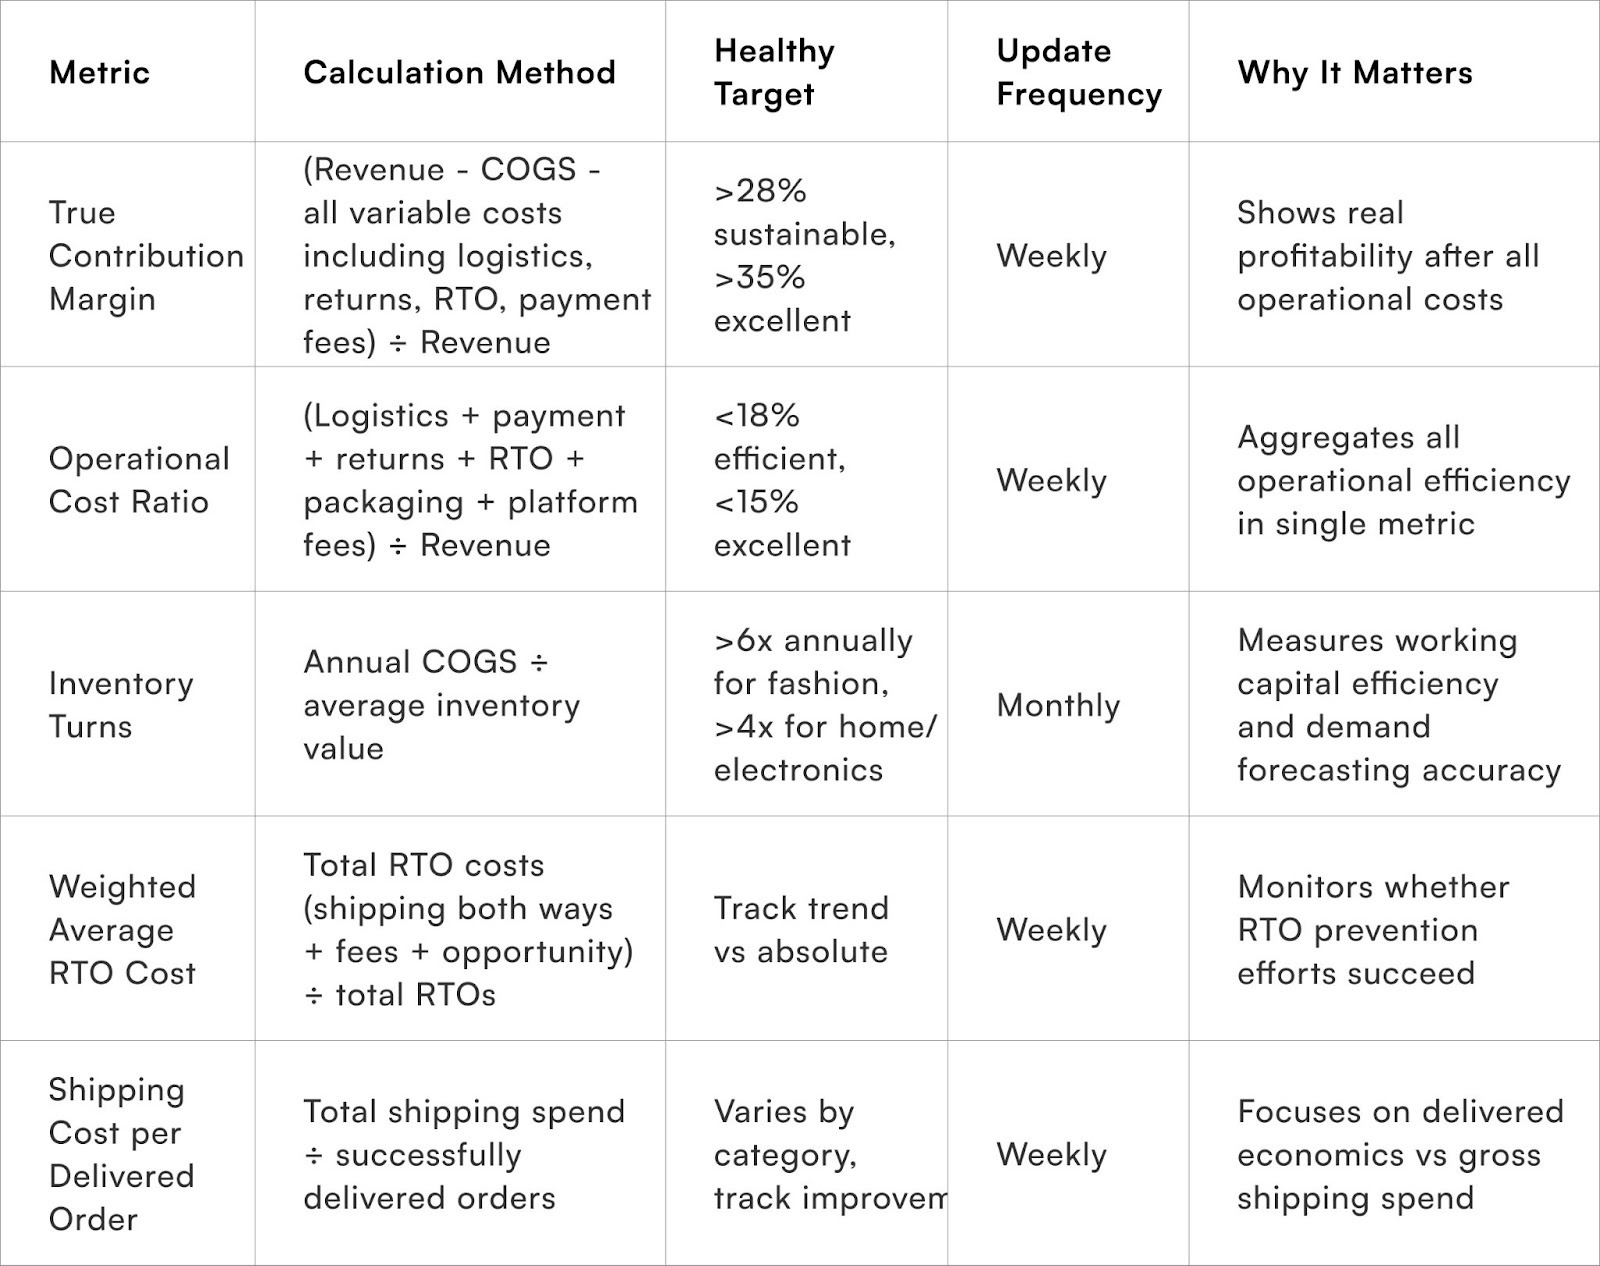
To Wrap It Up
Operational excellence represents the most defensible competitive advantage in Indian D2C because it compounds continuously whilst remaining invisible to competitors. Brands can copy your marketing creative or match your discount depth within days.
They can't replicate operational systems built through hundreds of small improvements over months. The margin expansion from world-class operations—typically 8-14 percentage points for brands starting from industry-average efficiency—equals revenue increases of 30-50% without additional customer acquisition.
This week, calculate your true contribution margin including all operational costs, identify the largest single cost bucket, and implement one optimisation in that area—this focused approach proves more effective than scattered efforts across multiple dimensions.
The mindset shift matters as much as specific tactics. Treating operations as strategic differentiator rather than administrative necessity transforms how brands allocate attention, talent, and capital.
The CFO role expands beyond financial reporting into operational analytics. The supply chain function moves from tactical order processing to strategic margin optimisation. These organisational changes enable systematic improvement rather than one-time fixes.
For D2C brands seeking unified visibility across logistics performance, payment operations, inventory efficiency, and return economics with intelligent optimisation recommendations and automated improvement workflows, Pragma's operational intelligence platform provides consolidated analytics connecting operational metrics to profitability outcomes, predictive modeling for cost optimisation opportunities, and execution tools that help brands improve contribution margins by 6-12 percentage points within 6-9 months whilst maintaining revenue growth through preserved customer acquisition capacity.
.gif)
FAQs (Frequently Asked Questions On Beyond Discounts: Operational Levers for Higher Profitability)
1. Should I prioritise reducing marketing spend or improving operational efficiency first?
Improve operations first unless marketing spend demonstrably exceeds category benchmarks by 50%+ with no path to efficiency.
Operational improvements preserve marketing effectiveness whilst reducing costs—you can maintain customer acquisition whilst improving unit economics. Cutting marketing spend reduces growth, creates negative momentum, and often forces steeper cuts later when reduced revenue further pressures margins.
The exception is brands spending ₹1,200+ CAC for ₹2,000 AOV products with <30% repeat rates—this fundamental economics problem requires marketing efficiency alongside operational improvement. For most brands, 5 percentage point contribution margin improvement through operations enables sustaining current marketing investment whilst achieving profitability.
2. How do I convince leadership that operational improvements warrant investment when discount reduction seems simpler?
Build financial model showing that operational improvements expand margins without revenue risk whilst discount reduction creates demand elasticity uncertainty.
Present side-by-side scenarios: reducing discounts from 40% to 30% might improve margins 7 points but risks 25-35% volume loss based on industry elasticity benchmarks.
Operational improvements adding 6-8 points maintain full volume whilst creating defensible competitive advantage through superior economics.
The operational path proves slower (3-4 months vs immediate discount changes) but dramatically lower risk. Most investors and boards accept longer timeline when risk-adjusted returns prove superior.
3. What operational improvements should bootstrap brands prioritise versus well-funded ones?
Bootstrap brands should focus on high-impact, low-investment optimisations: packaging right-sizing (₹20K-40K investment), carrier negotiation (zero investment), payment method steering (variable cost only), and basic inventory discipline through spreadsheet forecasting.
Well-funded brands should invest in infrastructure enabling systematic advantages: warehouse management systems, demand forecasting software, multi-carrier orchestration platforms, and distributed fulfillment networks.
The distinction is opportunity cost of capital—bootstrap brands can't afford ₹15-25 lakhs software investments with 18-month payback when that capital could fund inventory or marketing. Well-funded brands waste their advantages by not investing in operational infrastructure that compounds over time.
4. At what revenue scale do complex operational improvements justify their implementation costs?
Multi-carrier orchestration justifies itself above ₹50L monthly GMV. Distributed fulfillment makes sense above ₹1.5-2 crore monthly with clear geographic customer concentration. Advanced demand forecasting software pays back above ₹75L monthly GMV with 80+ SKUs. Warehouse management systems prove valuable above ₹1 crore monthly with 50+ daily shipments.
However, the foundational practices—packaging optimisation, carrier negotiation, payment method steering, basic inventory discipline—deliver positive ROI at any scale. The sophistication scales with complexity and volume, but the discipline of operational focus applies from first order.
Talk to our experts for a customised solution that can maximise your sales funnel
Book a demo
.png)