

Delivery failures rarely happen at random. In most D2C operations, the same pincodes show up repeatedly in NDR queues, delayed shipments, and RTO reports, even when products and carriers remain unchanged. Yet these patterns are often addressed reactively, order by order, rather than treated as a measurable, predictable risk.
Pincode risk index: building a composite score for delivery failure probability explores how teams can move beyond anecdotal “problem areas” to a structured, data-backed view of delivery risk. Instead of relying on a single metric like RTO rate or past delays, a pincode risk index combines multiple operational signals into one interpretable score that reflects the true likelihood of failure.
When designed well, this index becomes a shared reference point across logistics, support, and growth teams. It informs carrier selection, promise windows, proactive communication, and even marketing decisions — helping brands intervene earlier, allocate effort intelligently, and reduce avoidable delivery friction without overcorrecting or suppressing demand.
Why do delivery failures cluster at the pincode level?
Local constraints shape outcomes more than national averages
Understanding structural versus temporary pincode risk
Delivery risk is rarely uniform across a city or region. Certain pincodes consistently underperform because of structural factors such as access restrictions, address ambiguity, security checks, or limited last-mile capacity. Others spike only during temporary conditions like weather events, infrastructure work, or festival congestion.
Treating all failures the same hides these differences. A pincode risk index begins by separating persistent friction from situational noise, ensuring long-term decisions are not driven by short-lived disruptions.
Key structural drivers typically include:

- High-density housing with poor address standardisation
- Gated communities with restricted delivery windows
- Remote or semi-rural clusters served by secondary hubs
- Repeated customer unavailability patterns
Why order-level fixes fail without pincode context
Even perfect address capture or customer nudges cannot fully offset systemic last-mile constraints tied to geography.
What inputs should feed into a pincode risk index?
Combining signals that reflect real failure probability
Moving beyond single-metric risk indicators
Most teams rely on one or two indicators — usually RTO rate or delivery delay frequency. While useful, these metrics alone cannot explain why a pincode fails or predict future risk accurately. A composite index works because it blends outcome metrics, process signals, and behavioural patterns.
Common high-signal input categories include:
- Delivery outcomes (success, delay, return)
- Attempt quality (number of attempts, attempt spacing)
- NDR characteristics (reason codes, resolution time)
- Customer behaviour (responsiveness, reschedule success)
- Carrier consistency within the pincode

Why leading indicators deserve more weight
Signals that appear before final failure allow earlier intervention and smarter routing decisions.
How should inputs be normalised before scoring?
Ensuring fair comparison across pincodes
Avoiding volume bias and misleading extremes
High-volume pincodes naturally generate more failures, while low-volume areas can show extreme percentages based on a handful of orders. Normalisation ensures the index reflects probability, not just raw counts.
Effective normalisation approaches include:
- Minimum volume thresholds before scoring
- Rolling time windows to smooth volatility
- Z-score or percentile-based scaling within peer clusters
- Urban–rural or Tier-based benchmarking
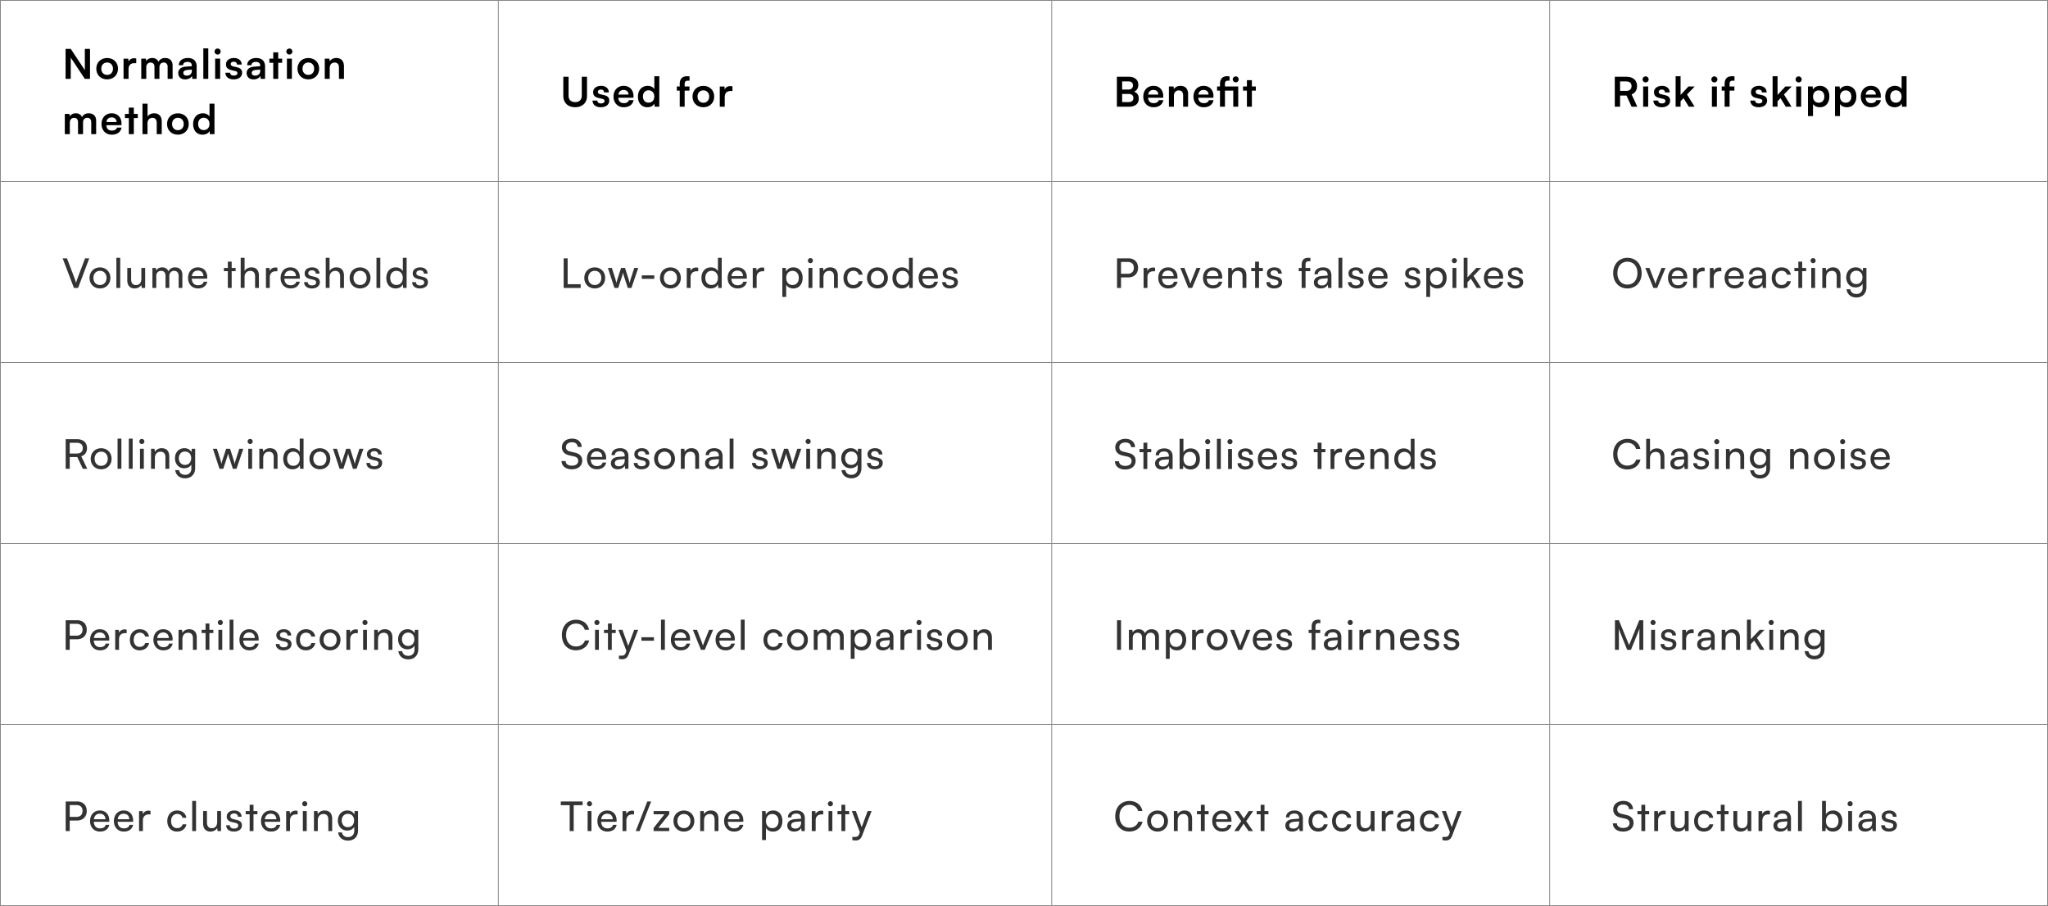
Why “one-size” scoring fails across regions
A Tier-1 urban pincode and a remote Tier-3 pincode should never be judged on identical baselines.
How can a pincode risk index stay interpretable for ops teams?
Clarity beats complexity in day-to-day use
Designing scores that drive action, not confusion
An index is only useful if teams understand what to do with it. Overly complex models reduce trust and adoption. The most effective pincode risk indices expose both:
- A single composite score (for routing and automation)
- A factor breakdown (for investigation and fixes)
Common operational score bands:
- Low risk: normal routing and promises
- Medium risk: adjusted carrier or promise window
- High risk: proactive communication, stricter COD rules
Why explainability accelerates cross-team alignment
Support, logistics, and growth teams act faster when the risk drivers are visible and consistent.
How should inputs be weighted into a single composite risk score?
Turning multiple signals into one usable index
Assigning weights based on failure impact, not data availability
A common mistake in composite scoring is giving equal weight to all inputs simply because they are easy to measure. In practice, some signals are far more predictive of delivery failure than others. For example, repeated address-related NDRs usually carry more risk than occasional customer unavailability, while sustained carrier underperformance in a pincode is often more damaging than short-term delay spikes.
Effective weighting starts by ranking inputs based on:

- Strength of correlation with final failure (RTO or non-delivery)
- Consistency of impact across time periods
- Ability to act on the signal operationally
Inputs that score high on all three should dominate the index, while weaker or indirect signals should be down-weighted or excluded.

Why weights should reflect decision consequences
Signals that trigger irreversible actions (like COD restriction) must be weighted more conservatively.
How are risk score thresholds calibrated for action?
Deciding when a pincode is “high risk”
Moving from raw scores to operational bands
A numeric score alone is rarely useful. Teams need clear thresholds that map directly to actions. These thresholds should be calibrated using historical outcomes rather than intuition, ensuring that a “high-risk” label consistently aligns with unacceptable failure rates.
Most mature setups use 3–4 bands:
- Low risk: standard routing and promises
- Medium risk: carrier optimisation or promise extension
- High risk: proactive customer communication and tighter controls
- Critical risk (optional): temporary suppression or manual review

Why thresholds must be revisited after major changes
New carriers, hubs, or policy shifts can invalidate earlier calibration if left unchecked.
How does the index adapt over time without becoming unstable?
Learning while avoiding overreaction
Blending historical stability with recent signals
If the index reacts too quickly, teams end up chasing noise. If it reacts too slowly, emerging risks go unnoticed. The right balance comes from blending long-term baselines with recent rolling windows.
Common stabilisation techniques include:
- Weighted averages favouring recent but sustained trends
- Minimum data requirements before score shifts
- Change caps to prevent sudden jumps between bands

Why stability matters for frontline adoption
Teams stop trusting indices that change daily without clear explanation.
How should outcomes feed back into the risk index?
Closing the learning loop
Treating every delivery as a validation event
Each completed delivery — successful or failed — should validate or challenge the current risk score. Crucially, feedback must capture context: which carrier was used, what action was triggered by the score, and whether that action helped.
Feedback loops should update:
- Input distributions (are NDR reasons changing?)
- Weight effectiveness (which signals predicted failure?)
- Threshold accuracy (did actions reduce failures?)
Why feedback should measure decision quality
The goal is not just fewer failures, but better decisions per order.
Quick Wins
Getting a usable pincode risk index live without overengineering
Week 1: Identify high-impact pincodes and baseline risk
Pull the last 60–90 days of delivery data and rank pincodes by failure concentration, not volume alone. Tag the top 10–15% as candidates for deeper analysis.
By the end of the week, teams typically surface a small set of pincodes responsible for a disproportionate share of delivery issues.
Week 2: Define inputs and normalisation rules
Lock a minimum viable input set — delivery outcomes, NDR profile, attempt quality, and customer responsiveness. Apply volume thresholds and rolling windows to stabilise signals.
This step prevents early noise from distorting risk perception.
Week 3: Introduce scoring bands and pilot actions
Convert raw scores into 3–4 operational bands and map each band to a clear action (carrier change, promise buffer, proactive outreach). Run the index in parallel with existing rules.
Ops teams should start seeing clearer decision consistency.
Week 4: Close the feedback loop
Ensure delivery outcomes flow back into the index with full context. Review early false positives and misses, and adjust weights conservatively.
At 30 days, most teams achieve measurable reduction in repeat failures from known high-risk pincodes.
Metrics to monitor pincode risk accuracy
Ensuring the index improves decisions, not just reporting
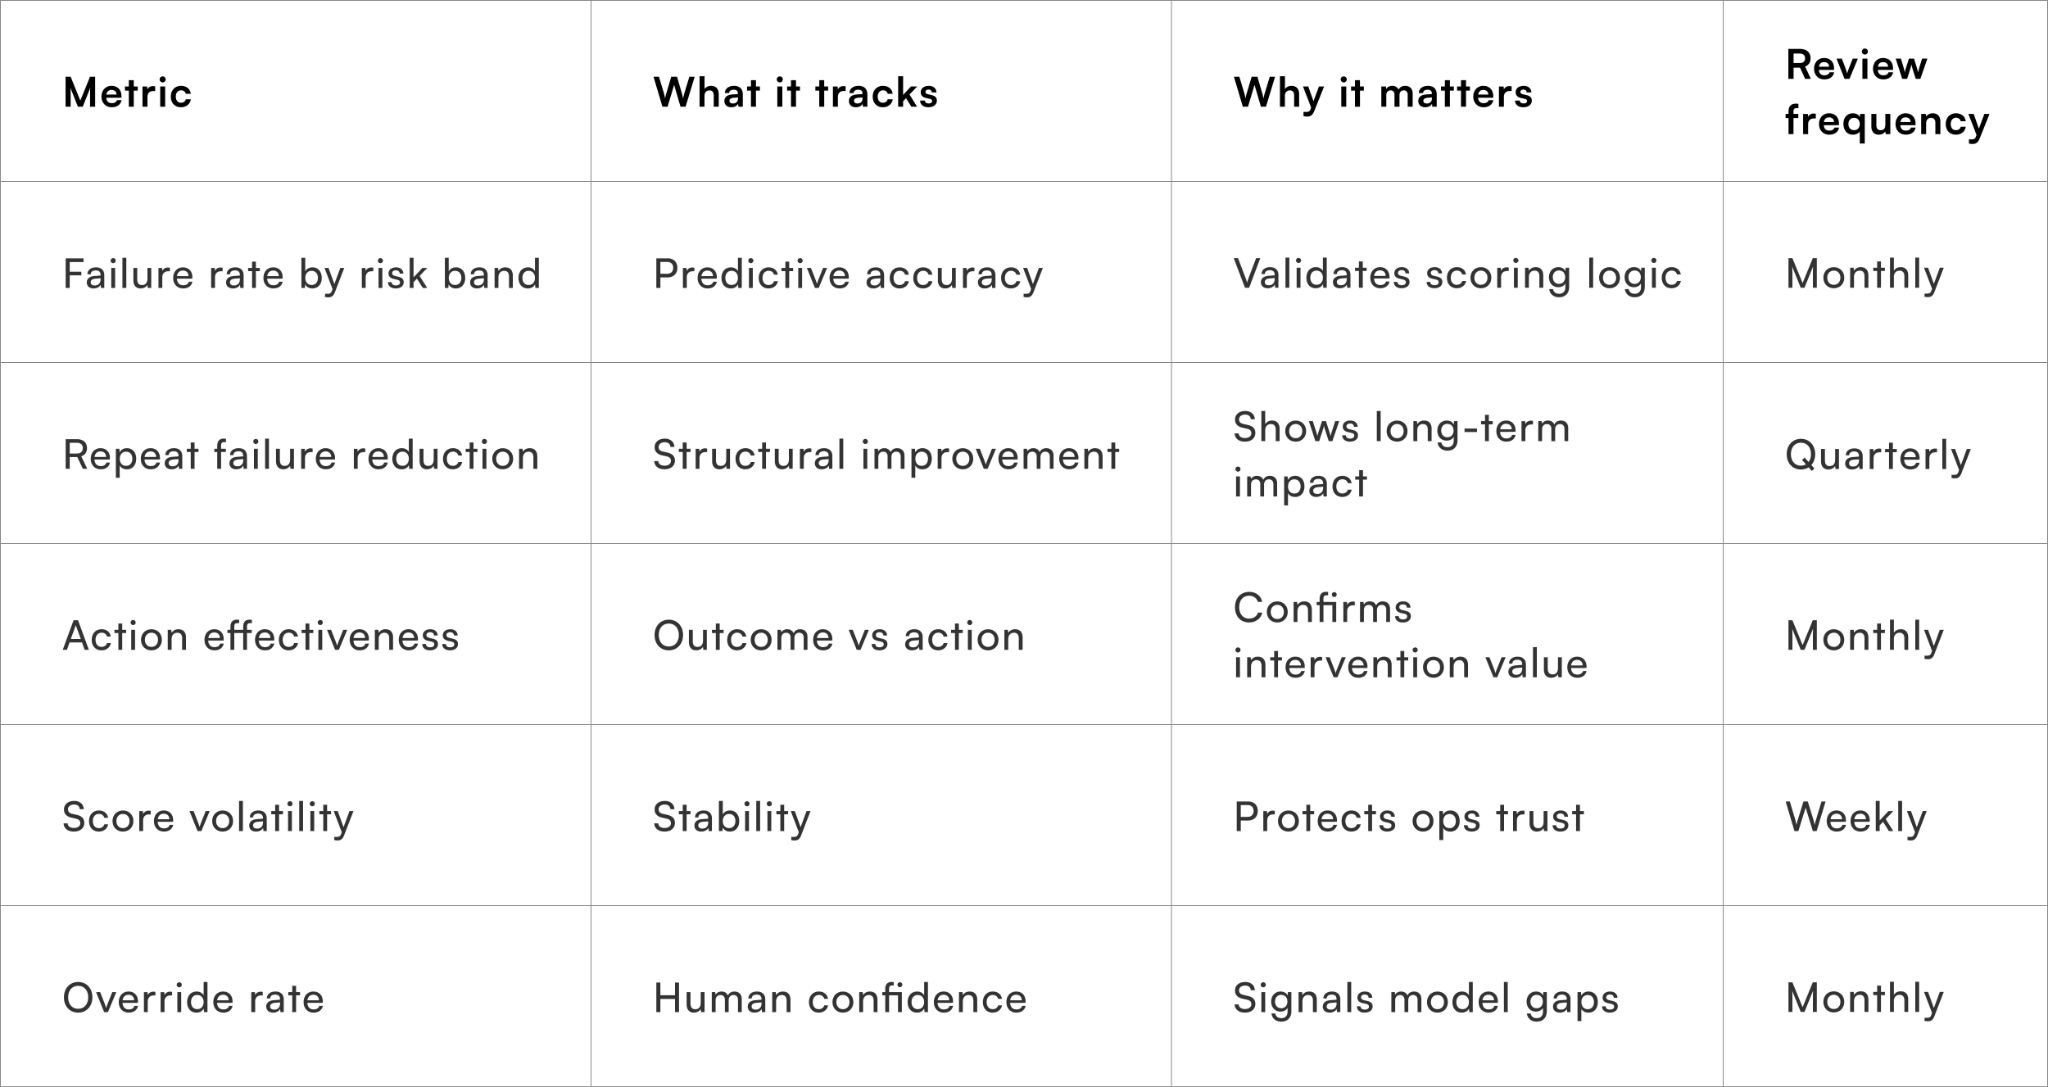
Tracking these metrics keeps the index grounded in operational reality rather than theoretical accuracy.
To Wrap It Up
A pincode risk index works best when it captures structural delivery friction rather than chasing isolated failures. By combining the right inputs, disciplined weighting, and a steady feedback loop, teams can anticipate risk earlier and act more consistently across regions.
This week, shortlist the top recurring failure pincodes and pilot a simple risk band with one operational action attached.
Over the long term, continuous calibration and outcome-driven feedback ensure the index evolves with changing last-mile conditions without losing stability.
For D2C brands seeking proactive delivery risk management at scale, Pragma’s orchestration platform provides composite risk scoring, contextual routing, and outcome-based learning that help brands reduce repeat failures and improve delivery reliability across pincodes.
.gif)
FAQs (Frequently Asked Questions On Pincode risk index: building a composite score for delivery failure probability)
1. Is a pincode risk index only useful for logistics teams?
No. It also informs CX prioritisation, delivery promises, COD policies, and campaign targeting.
2. How granular should a pincode risk score be?
Granularity should match actionability. Overly fine scores create confusion without improving outcomes.
3. Can new pincodes be scored without history?
Yes, using peer clustering based on region, tier, and carrier coverage until sufficient data accumulates.
4. How often should the index be recalibrated?
Only when sustained shifts appear, such as new carriers, hubs, or policy changes.
5. What is the biggest risk in deploying this index?
Overreacting to short-term noise and labelling pincodes as “bad” without structural evidence
Talk to our experts for a customised solution that can maximise your sales funnel
Book a demo


.png)