

The reality of India's delivery landscape demands sophisticated location intelligence. Last-mile delivery accounts for approximately 53% of total shipping costs, with delivery success rates varying dramatically based on pincode characteristics that most brands completely ignore. A pincode in Tier-1 cities might achieve 85% first-attempt delivery success, whilst rural locations struggle to reach 55% despite identical operational processes.
Your logistics team treats all pincodes equally, applying uniform delivery promises and carrier assignments across Mumbai's Bandra and Bihar's remote villages. This geographical blindness costs you lakhs in failed deliveries, wasted logistics spending, and damaged customer relationships that could be prevented through intelligent pincode risk assessment.
In this comprehensive guide on pincode risk index development for building composite scores that predict delivery failure probability, we're diving deep into systematic frameworks that quantify location-based delivery risks. Smart D2C brands are using data-driven pincode scoring to optimise carrier selection, adjust delivery promises, and implement targeted verification workflows that reduce failed deliveries by 40-50% whilst improving customer satisfaction across India's diverse geographic landscape.
Why do traditional pincode classifications fail D2C logistics planning?
Understanding the limitations of tier-based city categorisation for delivery operations
Traditional pincode classifications rely on administrative tier systems—Tier-1, Tier-2, Tier-3 cities—that reflect population size and economic development but fail to capture the nuanced factors that actually determine delivery success probability. These broad categorisations create false assumptions about delivery capabilities, leading brands to make poor operational decisions that increase costs whilst reducing customer satisfaction.
Traditional tier-based city classifications fail to accurately represent the complex realities of delivery performance. These systems overlook critical intra-city variations, treating diverse locations within the same administrative classification identically, even when significant differences in serviceability exist. For example, a Tier-1 city like Mumbai can have both easily accessible suburbs and challenging, densely packed areas with poor road infrastructure.
Several key factors demonstrate why city tiers are an unreliable indicator of delivery success:
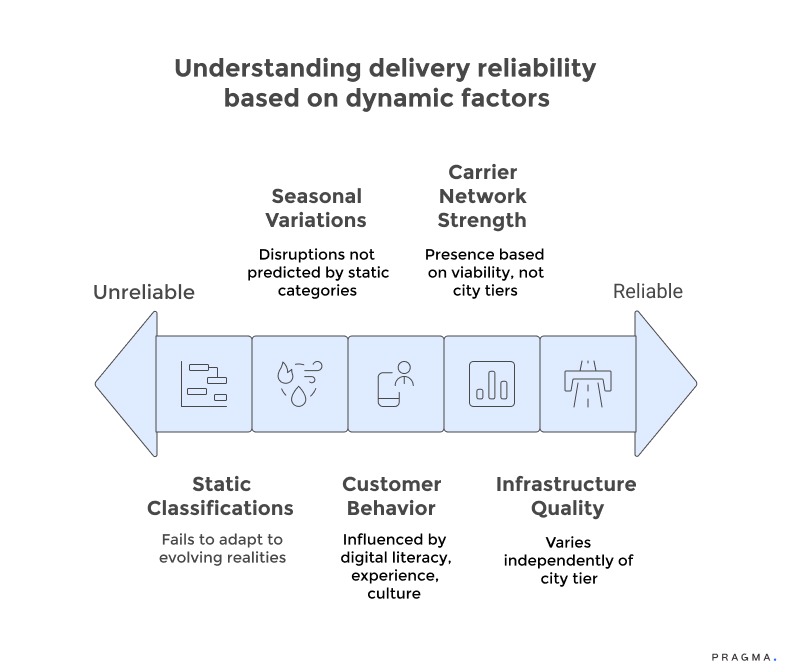
- Infrastructure Quality:
The quality of infrastructure, including roads, telecommunications, and last-mile connectivity, varies independently of city tier. Some Tier-2 cities may even possess superior logistics capabilities compared to congested metropolitan areas grappling with traffic and accessibility issues. This disconnect leads to mismatched delivery expectations and inefficient operational planning.
- Carrier Network Strength:
Logistics partners establish their presence based on commercial viability and strategic priorities, not city tiers. Consequently, there's no consistent correlation between carrier network strength and administrative classifications. Surprisingly, some rural areas with strong economic activity might have better carrier coverage than certain suburban locations in larger cities.
- Customer Behavior:
Customer behavior patterns, such as payment preferences, address accuracy, and commitment to orders, are influenced by factors like digital literacy, prior e-commerce experience, and local cultural norms, rather than city size alone. A tech-savvy individual in a Tier-3 city might exhibit more reliable delivery behavior than a first-time online shopper in a major metropolitan area.
- Seasonal Variations:
Delivery challenges caused by seasonal events, such as monsoons, festivals, and agricultural cycles, affect different pincodes regardless of their tier classification. These temporary disruptions are not captured or predicted by static administrative categories.
- Static Nature of Classifications:
Tier classifications are inherently static and fail to adapt to rapidly evolving ground realities. Infrastructure development, carrier network expansion, and changing customer behaviors mean that a high-risk pincode from a few years ago might now be reliable, while previously dependable locations could experience deteriorating performance.
Most important: Clean data drives accurate delivery predictions.
What is a Pincode Risk Index?
A Pincode Risk Index is a systematic approach to evaluating the potential challenges associated with delivering to specific pincodes. By analyzing factors such as delivery success rates, geographical remoteness, local infrastructure, historical performance, and carrier reliability, the Pincode Risk Index assigns a risk score to each pincode. This enables businesses to differentiate between high-risk and low-risk areas, allowing logistics teams to tailor their strategies for better efficiency and cost-effectiveness.
Know Exactly Which Pincodes Will Fail You
Route Smart by Pincode, Not by Guesswork.
Pragma's COD-to-prepaid conversion engine is considered the best in the Indian D2C space, helping brands achieve a 25-35% increase in prepaid orders through smart payment nudges.
Not all pincodes are equal. Pragma’s pincode risk index scores every location on NDR, RTO, carrier strength, and SLA so ops teams can assign the right courier, promise realistic ETAs, and tighten COD only where it’s truly risky.
What factors should comprise a comprehensive pincode risk score?
Identifying and weighting variables that accurately predict delivery failure probability
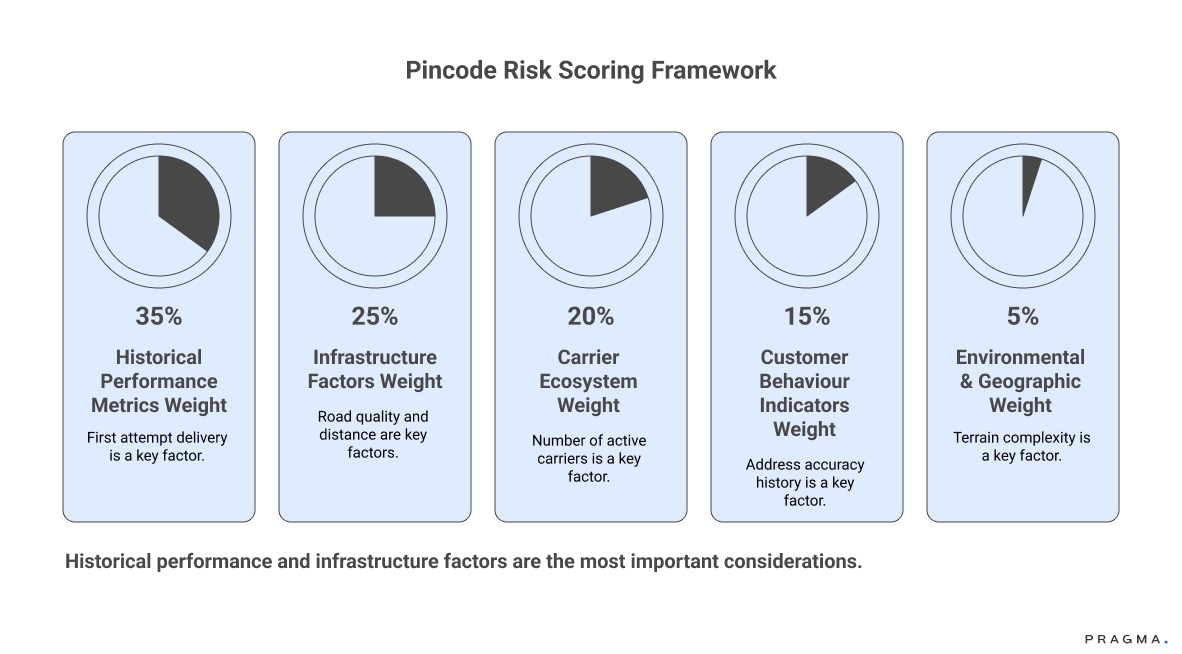
Building a comprehensive pincode risk score for delivery failure probability requires a systematic analysis of various interconnected factors. Effective scoring models consider infrastructure, historical performance, demographics, and operational characteristics to predict delivery risks.
The foundational data layer for this analysis is historical delivery performance. This data captures actual delivery outcomes over time, establishing baseline success rates and identifying consistent patterns. Key metrics include first-attempt delivery success rates, return-to-origin frequencies, customer unavailability incidents, and address-related failures, all of which provide empirical evidence of challenges specific to each pincode.
Several other factor categories contribute to the risk assessment:
- Infrastructure accessibility: This quantifies physical delivery capabilities. Factors like road quality, distance from major logistics hubs, telecommunications reliability, and last-mile connectivity are crucial. Pincodes with poor infrastructure or significant distance from carrier facilities inherently carry higher delivery failure risks.
- Carrier network density: This measures the number of active logistics partners in a pincode, their service level offerings, and historical reliability. Pincodes with multiple carrier options and established local networks typically demonstrate lower risk than those reliant on limited providers.
- Demographic and socioeconomic indicators: These factors, such as population density, digital literacy rates, average income, and e-commerce penetration, help predict customer behavior. Higher digital literacy, for instance, often correlates with better address accuracy and customer availability.
- Address standardisation quality: This reflects how well pincode locations conform to formal addressing systems versus informal, landmark-based identification. Clear street numbering and building identification support more reliable deliveries compared to areas requiring extensive local knowledge.
- Geographic and environmental factors: These capture terrain complexity, weather vulnerability, seasonal accessibility variations, and natural disaster exposure. Mountainous regions, flood-prone areas, and locations with extreme weather patterns necessitate risk adjustments irrespective of other positive attributes.
- Customer verification response rates: This measures local customer engagement with pre-delivery confirmation processes, indicating commitment levels. High verification completion rates demonstrate lower failure risk due to confirmed customer intent.
- Cash-on-delivery (COD) adoption percentages: These indicate payment-related risk. COD orders have significantly higher failure rates than prepaid transactions, requiring risk score adjustments for pincodes with a strong preference for COD.
How do you collect and validate pincode performance data?
Building reliable data foundations that enable accurate risk assessment
Effective pincode risk scoring relies on comprehensive and accurate data from both internal operations and external sources. The quality of this data directly impacts the accuracy of the scores and overall operational effectiveness.
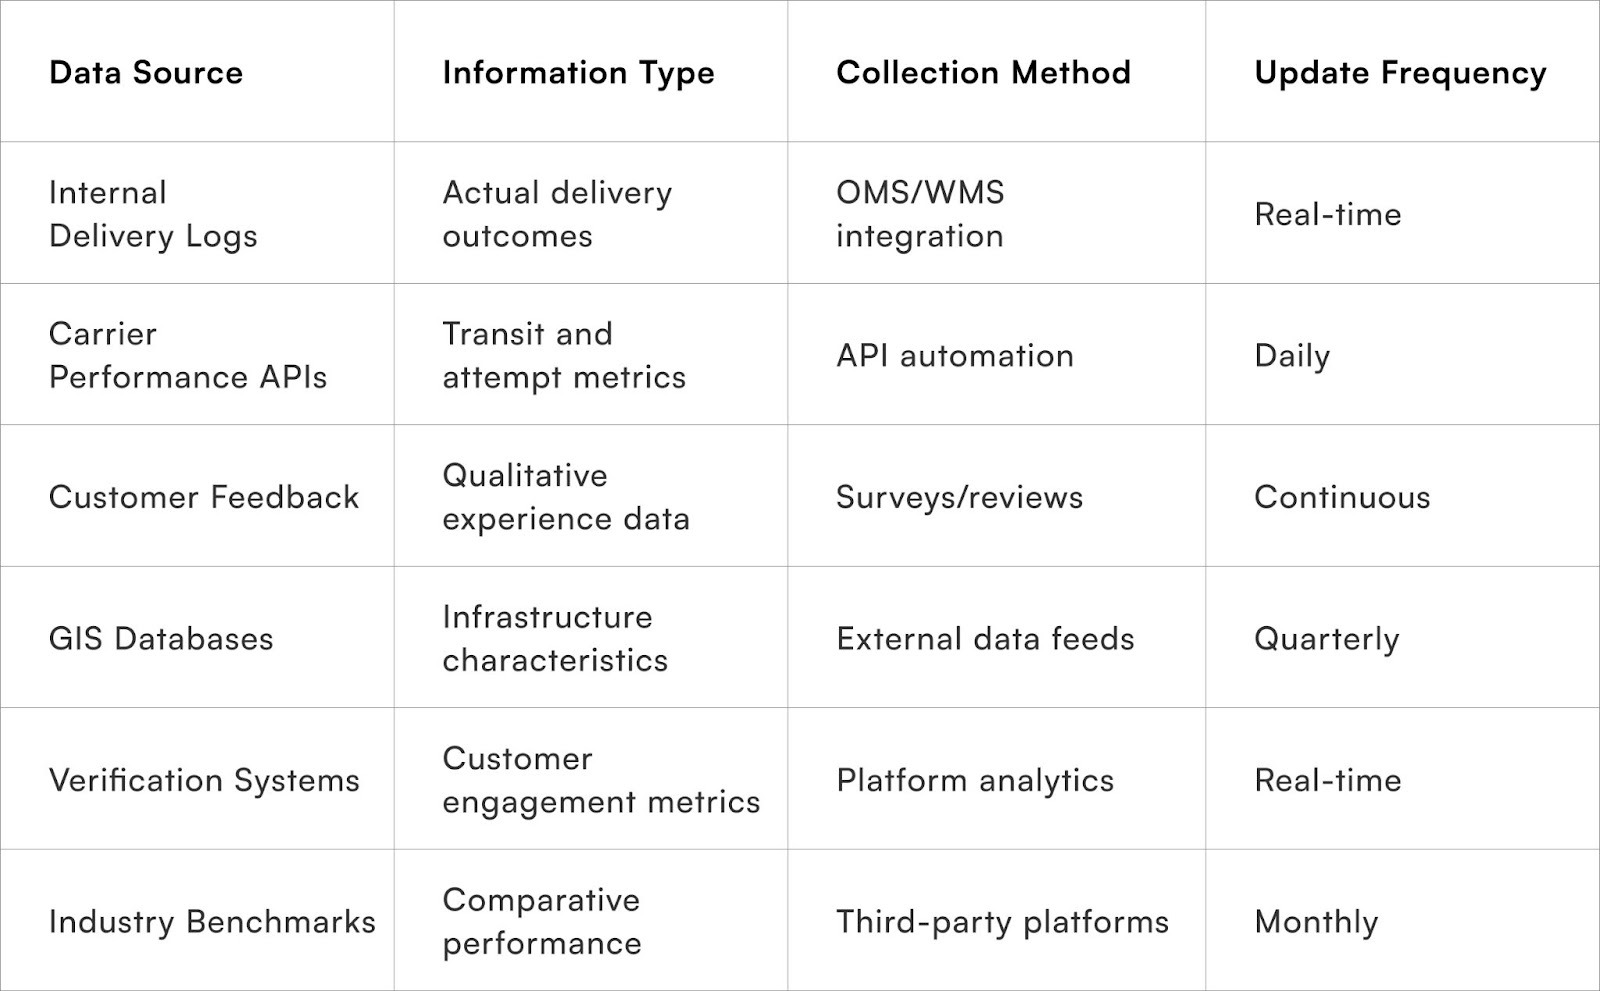
6 Key Data Sources for Pincode Risk Scoring:
- Internal Delivery Data: This is the most valuable source, systematically tracking every delivery attempt. It captures success rates, failure reasons, delivery timeframes, and customer interactions for each pincode. Data is gathered from order management systems, carrier APIs, and customer service platforms.
- Carrier Performance APIs: These APIs automate the collection of delivery metrics such as transit times, attempt counts, failure classifications, and successful delivery rates at a granular pincode level. Integrating with multiple carrier systems allows for comparative performance analysis and identification of carrier-specific strengths and weaknesses across locations.
- Customer Feedback Systems: These systems gather qualitative insights into delivery experiences, addressing accessibility challenges and carrier performance quality that quantitative metrics might miss. Post-delivery surveys, support ticket analysis, and review mining provide crucial contextual understanding.
- Geographic Information Systems (GIS): GIS provides infrastructure data like road quality, distance calculations, terrain classifications, and accessibility metrics. This data helps predict delivery difficulty independently of historical performance and can be sourced from government databases, satellite imagery, and crowd-sourced mapping platforms.
- Third-Party Logistics Intelligence Platforms: These platforms aggregate industry-wide performance data from various brands and carriers. They offer benchmark comparisons and help identify systematic pincode challenges versus brand-specific operational issues.
- Verification System Data: This tracks customer response rates to pre-delivery confirmations, address validation completeness, and contact information accuracy. Higher completion rates in these areas correlate strongly with reduced delivery failures.
Ensuring Data Quality and Relevance:
- Data Validation Processes: These processes ensure scoring accuracy by detecting outliers, performing temporal consistency checks, and cross-referencing data from multiple sources to identify errors or anomalies. Statistical analysis helps differentiate true performance patterns from random variations or data quality issues.
- Continuous Data Refresh Cycles: Automated systems update risk scores based on recent performance trends while preserving historical context. Most effective models prioritise recent data while using historical patterns for stability, maintaining the relevance of scores as conditions change.
How should risk scores inform operational decision-making?
Translating risk assessments into actionable logistics and customer experience strategies
Pincode risk scores gain value only when systematically integrated into operational workflows that optimise carrier selection, delivery promises, verification intensity, and customer communication strategies based on location-specific delivery probability predictions.
Carrier assignment algorithms should prioritise logistics partners with proven performance in specific risk categories, matching carrier strengths to pincode challenges rather than applying uniform selection logic. High-risk pincodes benefit from carriers with strong local networks and specialised last-mile capabilities, whilst low-risk areas can utilise cost-optimised carriers without sacrificing reliability.
Delivery promise customisation adjusts estimated delivery timeframes based on pincode risk scores, preventing customer disappointment through realistic expectations whilst enabling faster commitments for low-risk locations. Dynamic promise engines calculate delivery dates incorporating risk-adjusted buffer times that maintain promise reliability across diverse locations.
Verification intensity scaling applies comprehensive confirmation workflows to high-risk pincodes whilst streamlining processes for reliable locations, optimising resource allocation without compromising delivery success. Address verification, customer availability confirmation, and payment validation adapt to risk levels.
Customer communication strategies intensify for high-risk deliveries through additional touchpoints, more detailed instructions, and proactive issue resolution that prevents predictable failures. Low-risk deliveries receive standard communication, reducing operational overhead whilst maintaining satisfaction.
Pricing strategy adjustments reflect true delivery costs through risk-based shipping charges or minimum order values that ensure profitability across varied delivery environments. Transparent pricing that accounts for delivery difficulty builds customer understanding whilst maintaining margin protection.
Cash-on-delivery policy customisation restricts or enhances COD availability based on pincode risk scores, balancing customer convenience with fraud prevention and RTO reduction. High-risk pincodes might require order value limits, mandatory verification, or prepaid-only policies whilst low-risk areas enjoy unrestricted COD access.
Return logistics planning anticipates higher RTO rates from risky pincodes through appropriate inventory allocation, reverse logistics capacity, and cost accounting that prevents surprise impacts on operational performance and financial results.
Performance monitoring intensity increases for high-risk pincodes through more frequent analysis, faster intervention on performance degradation, and continuous optimisation efforts that improve challenging locations over time.
Risk-Based Operational Framework:
Which metrics validate pincode risk model accuracy?
Measuring predictive performance and continuous model improvement
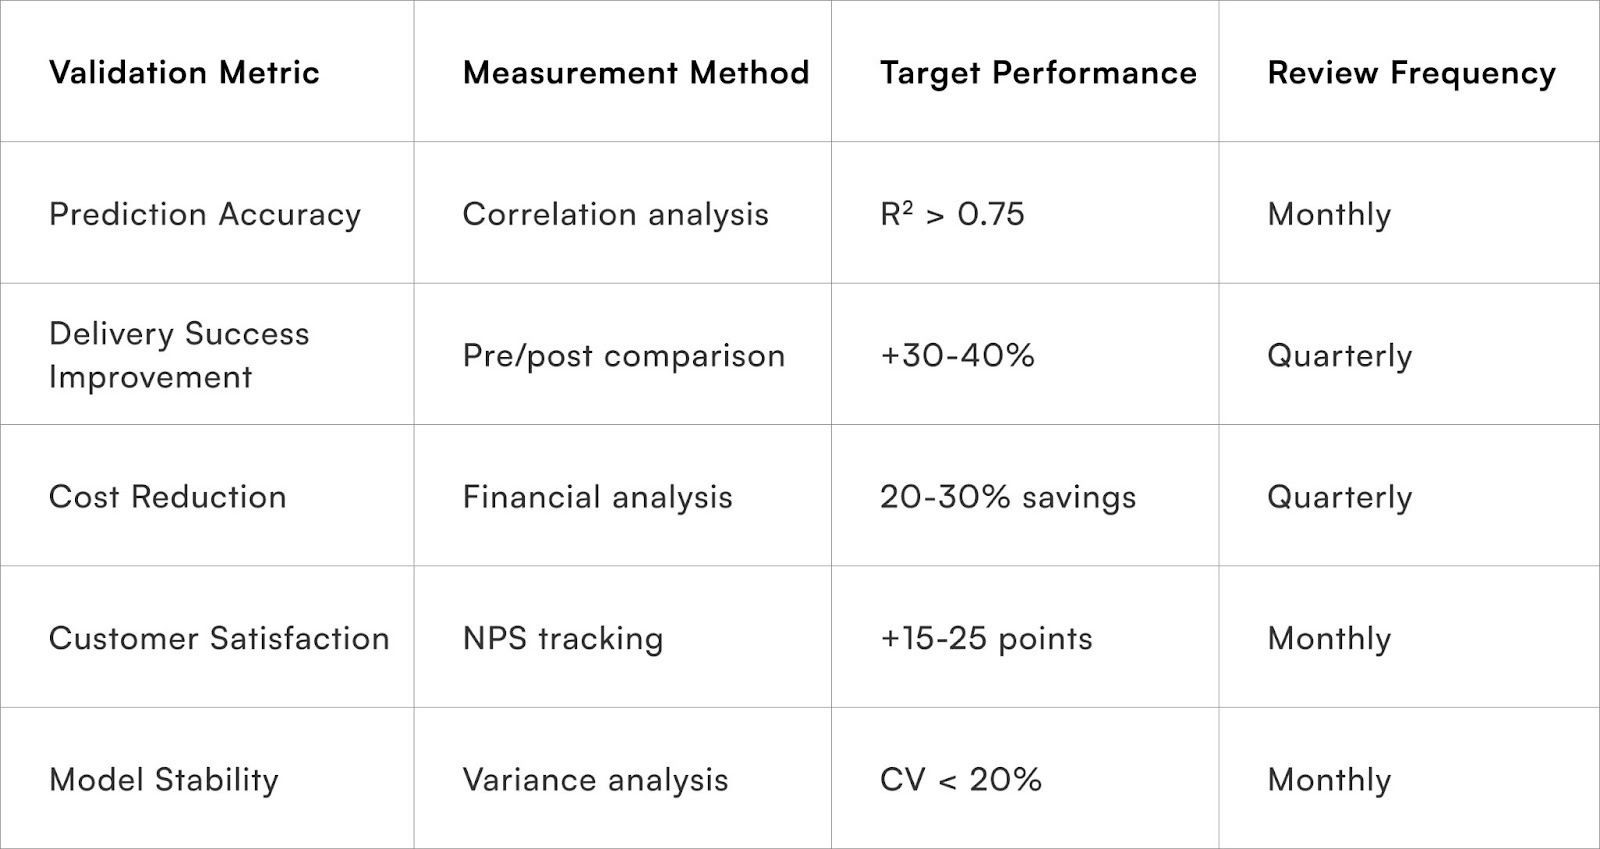
Risk model validation requires systematic measurement of prediction accuracy, operational impact, and business outcomes that demonstrate scoring effectiveness whilst identifying opportunities for refinement and enhancement.
Prediction accuracy metrics compare forecasted delivery failure rates against actual outcomes at pincode level, measuring how precisely risk scores correlate with real delivery performance. Mean absolute error, root mean square error, and correlation coefficients quantify model accuracy whilst highlighting systematic prediction biases.
Delivery success rate improvements following risk-based intervention implementation demonstrate operational value creation through reduced failures, fewer delivery attempts, and improved customer satisfaction. Comparing pre-implementation and post-implementation performance validates that risk scoring drives measurable operational enhancements.
Cost reduction measurements capture financial impact through decreased failed delivery expenses, optimised carrier spending, reduced RTO charges, and improved resource allocation efficiency. Risk-based operations should demonstrate clear ROI through measurable cost savings that exceed implementation investments.
Customer satisfaction progression tracks whether risk-adjusted operations improve delivery experiences through more realistic expectations, better-matched carrier capabilities, and proactive communication that prevents disappointment. NPS scores, satisfaction ratings, and complaint volumes should improve alongside delivery success rates.
Carrier performance optimisation validates that risk-based carrier assignment improves partner utilisation efficiency through better capability matching, whilst enabling performance comparisons that drive continuous carrier network improvements.
Model stability assessment ensures risk scores remain consistent and predictive over time rather than exhibiting excessive volatility that undermines operational planning and decision-making confidence. Stable models maintain predictive accuracy despite normal operational variations whilst adapting appropriately to genuine performance changes.
Segment analysis verifies that risk models perform accurately across different product categories, order values, and customer types rather than optimising for average performance whilst missing critical segment-specific patterns.
Continuous recalibration processes maintain model accuracy through periodic retraining using recent performance data, adjusting factor weightings based on evolving delivery environments, and incorporating new variables that improve predictive capabilities.
Quick Wins for Pincode Risk Index Implementation (30 Days)
Build foundational risk scoring capabilities through strategic data collection and analysis that enables immediate operational improvements whilst establishing infrastructure for advanced risk modelling.
Week 1: Data Infrastructure and Collection Setup Establish comprehensive delivery tracking that captures pincode-level performance metrics including first-attempt success rates, delivery timeframes, failure reasons, and customer interactions. Configure order management systems and carrier integrations to automatically log delivery outcomes with pincode attribution for systematic analysis.
Create baseline performance reports that calculate current delivery success rates by pincode, identifying clear patterns of high-performing and challenging locations. Initial analysis should segment pincodes into three broad risk categories—low, medium, high—based on historical delivery success rates alone.
Week 2: Risk Factor Identification and Scoring Develop simple risk scoring methodology incorporating historical performance (50%), carrier availability (30%), and COD adoption rates (20%) to create initial composite scores. This simplified model provides immediate operational value whilst building toward comprehensive multi-factor scoring systems.
Map pincodes to risk categories and calculate risk distributions across your service area, identifying what percentage of orders flow to high-risk versus low-risk locations. Understanding risk exposure helps prioritise intervention strategies and resource allocation decisions.
Week 3: Operational Integration and Policy Development Implement risk-based carrier assignment that routes high-risk pincode deliveries to carriers with proven local performance whilst optimising costs for low-risk locations. Configure shipping systems to apply carrier selection logic automatically based on destination pincode risk scores.
Deploy targeted verification workflows that apply comprehensive address and availability confirmation for high-risk pincodes whilst streamlining processes for reliable locations. Automated systems should trigger appropriate verification intensity based on destination risk classifications.
Week 4: Monitoring Framework and Optimisation Launch Establish performance tracking dashboards that measure delivery success improvements by risk category, validating that risk-based operations deliver measurable benefits. Track key metrics including first-attempt success rates, RTO reductions, and cost savings attributed to risk-based optimisation.
Launch continuous improvement processes that identify underperforming high-risk pincodes for targeted intervention whilst monitoring low-risk locations for performance degradation requiring risk score adjustments. Monthly review cycles ensure risk scores remain accurate and operational strategies remain effective.
Expected Results After 30-Day Implementation:
- 25-35% improvement in high-risk pincode delivery success
- 30-40% reduction in RTO rates from challenging locations
- 15-20% overall logistics cost reduction
- Improved carrier utilisation efficiency
- Foundation for advanced risk modelling and AI-driven optimisation
To Wrap It Up
Pincode risk indexing transforms logistics from reactive problem-solving toward proactive optimisation that prevents delivery failures before they occur. The most successful D2C brands recognise that geographic intelligence enables smarter operational decisions across carrier selection, delivery promises, verification intensity, and customer communication strategies.
Begin implementation immediately with basic historical performance analysis and three-tier risk classification, as this foundational approach delivers 25-35% improvement in high-risk pincode performance within the first month. Focus on systematic data collection and simple scoring models before pursuing sophisticated multi-factor algorithms that require more complex infrastructure.
Your risk indexing strategy should evolve continuously as delivery networks expand, customer behaviours change, and infrastructure develops across India's rapidly transforming logistics landscape. The most effective approaches balance predictive accuracy with operational simplicity, creating decision frameworks that frontline teams understand and trust.
Success in pincode risk management requires viewing geographic diversity as opportunity for targeted optimisation rather than unavoidable operational challenge. Brands that embrace location intelligence build competitive advantages through superior delivery reliability, optimised cost structures, and customer experiences adapted to local realities.
For D2C brands seeking sophisticated pincode risk intelligence that continuously adapts to changing delivery environments, Pragma's AI-powered pincode scoring platform provides automated risk assessment, carrier optimisation, and verification workflows that help brands achieve 40-50% reduction in delivery failures whilst improving operational efficiency across India's diverse geographic landscape.
.gif)
FAQs (Frequently Asked Questions On Pincode Risk Index: Building a Composite Score for Delivery Failure Probability)
How many historical data points are needed to create accurate pincode risk scores?
Minimum 30-50 delivery attempts per pincode provide statistically meaningful insights, but 100+ attempts enable more reliable risk assessment. For new or low-volume pincodes, use regional proxies or similar pincode characteristics until sufficient direct data accumulates.
Should risk scores be visible to customers or kept internal for operational use?
Risk scores should remain internal operational tools, but their effects—realistic delivery promises, appropriate verification, transparent communication—create customer value without exposing technical scoring details that might create confusion or negative perceptions.
How often should pincode risk scores be recalculated to maintain accuracy?
Monthly recalculation balances responsiveness to changing conditions with operational stability. High-volume pincodes benefit from weekly updates, whilst low-volume locations can use quarterly refresh cycles supplemented by triggered updates following significant performance changes.
Can machine learning improve pincode risk prediction compared to rule-based scoring?
Yes, machine learning models typically achieve 15-25% better prediction accuracy through pattern recognition across multiple variables and non-linear relationships. However, rule-based models offer transparency and interpretability that aids operational decision-making and stakeholder communication.
Why isn’t Tier‑1 vs Tier‑2/3 classification enough for planning deliveries?
City tiers ignore intra-city differences such as road access, carrier strength, or local behaviour, so you can have both very high and very low risk pincodes inside the same tier.
How should pincode risk scores change my operations?
Use them to choose carriers, set realistic delivery promises, scale verification, tune COD policies, and decide where to invest in better communication.
How often should pincode risk scores be refreshed?
Monthly recalculation works well for most brands, with faster updates for very high‑volume or rapidly changing regions.
Talk to our experts for a customised solution that can maximise your sales funnel
Book a demo


.png)