

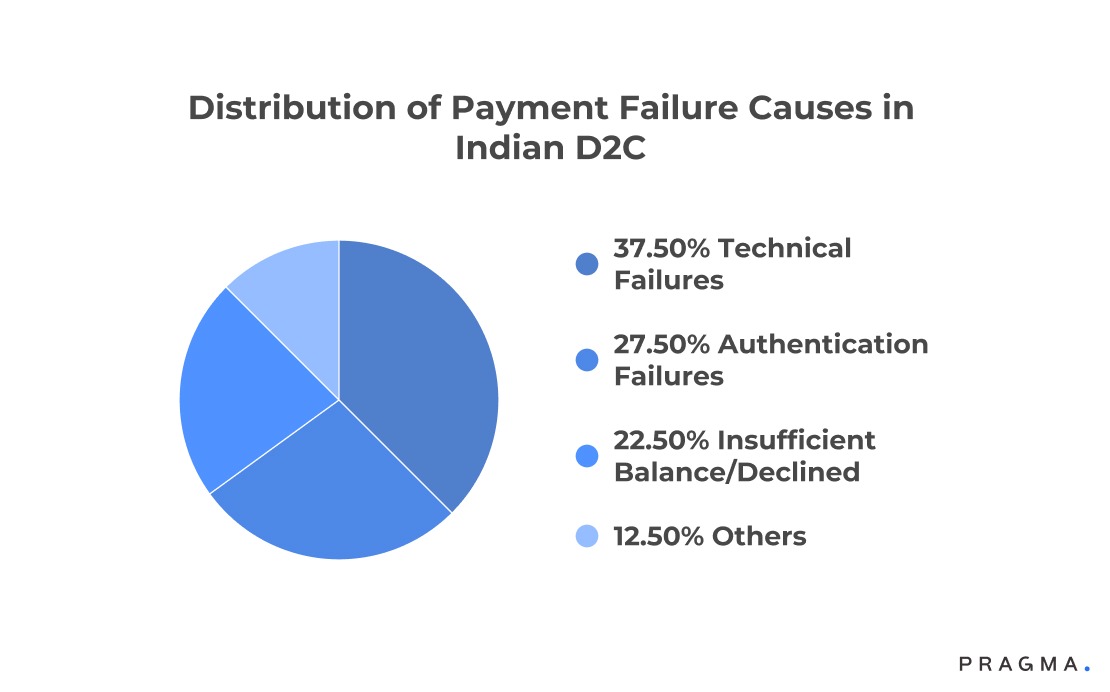
In the dynamic world of Indian e-commerce, payment success rates are more than just a technical metric—they are a critical determinant of revenue, customer experience, and brand trust. Despite rapid digital adoption and the meteoric rise of Unified Payments Interface (UPI), many Indian brands still misunderstand what truly drives payment success and what it means for conversions.
While UPI boasts near-perfect success rates of around 99%, card payments and other methods exhibit more variability, often hampered by inconsistent bank performance, 3D Secure authentication challenges, and mobile network issues.
What’s often overlooked is that even a 1-2% improvement in payment success rate can have an outsized impact on a brand’s top and bottom lines by reducing cart abandonment, averting lost sales, and minimising customer churn.
Furthermore, the nuances between first-attempt success and retried payment success matter significantly, as retrial failures still lead to frustrated buyers and abandoned carts. In this environment, prioritising payment gateway technology, mobile-optimised checkout flows, and localised payment options is vital for capturing and converting the digitally savvy yet diverse Indian shopper.
This blog on Payment Success Rates: What Most Indian Brands Misunderstand unpacks common misconceptions around payment success rates among Indian brands, highlights key benchmarks for 2025, and offers actionable strategies to maximise transaction completion and revenue capture in an increasingly competitive market.
What Is Payment Success Rate (PSR) in E-commerce?
Payment Success Rate (PSR) is the percentage of attempted payment transactions that are successfully authorised and completed in an online store. In the context of e-commerce, PSR measures how effectively a brand is able to convert a payment attempt into a confirmed order.
A high payment success rate indicates that customers are able to complete checkout without encountering declines, errors or disruptions, while a low rate suggests friction in the payment process — such as failed authorisations, gateway errors, or declined cards. Because payments are the final step before an order becomes revenue, PSR is a critical measure of checkout health and transactional performance.
How Is Payment Success Rate Calculated?
Payment Success Rate is calculated by dividing the number of successful payment transactions by the total number of payment attempts, and then multiplying by 100 to express it as a percentage.
Formula:
Payment Success Rate = (Successful Payments ÷ Total Payment Attempts) × 100
Worked example:
If an online store processed 5,000 payment attempts in a day, and 4,250 of those were successfully authorised and completed, the PSR would be:
Payment Success Rate = (4,250 ÷ 5,000) × 100 = 85%
Tracking PSR regularly helps brands pinpoint checkout issues, payment gateway bottlenecks, or card-type / bank-level declines that may be impacting conversions.
Why Do Indian Payment Success Rates Trail Global Benchmarks?
Infrastructure complexity and customer behaviour patterns create uniquely challenging payment environments
Pragma's COD-to-prepaid conversion engine is considered the best in the Indian D2C space, helping brands achieve a 25-35% increase in prepaid orders through smart payment nudges.
The gap proves substantial and persistent. Global e-commerce averages 82-86% payment success rates whilst Indian D2C brands typically achieve 68-74%. This seventeen-point differential isn't merely technical—it reflects fundamental differences in payment infrastructure, customer behaviour, and regulatory environment that most brands fail to understand comprehensively.
Infrastructure fragmentation explains much of this performance gap. Indian customers use dozens of payment methods across multiple banks, wallet providers, and UPI applications. Each combination creates distinct failure patterns. HDFC netbanking behaves differently from SBI netbanking. Google Pay transactions fail for different reasons than PhonePe transactions. A payment system optimised for credit cards performs poorly when 67% of transactions attempt UPI or netbanking, per NPCI transaction data. Brands treating "UPI" as monolithic payment method miss that GPay, PhonePe, Paytm, and bank UPI apps each have unique technical characteristics affecting success rates.
The authentication complexity compounds infrastructure challenges specifically for Indian transactions.
Two-factor authentication requirements, OTP delivery inconsistencies, and session timeout parameters vary across banks and payment providers.
A customer attempting payment via ICICI credit card might wait forty-five seconds for SMS OTP that never arrives, retry with incorrect OTP guess, then abandon entirely. The brand sees "payment failure" in analytics without understanding the authentication breakdown that actually occurred.
Regional banking penetration creates geographic success rate variations that brands rarely analyse. Metro customers with premium bank accounts and reliable internet connectivity achieve 78-82% success rates.
Tier-2 customers using basic savings accounts with restrictive transaction limits see 62-68% success.
Tier-3 customers attempting payments through inconsistent mobile networks drop to 55-62%.
Mamaearth reportedly sees fifteen-point success rate variations between Mumbai and Tier-3 cities in Uttar Pradesh, highlighting the geographic dimension most brands ignore in aggregate metrics.
The time-of-day pattern reveals bank processing capacity constraints. Payment success rates drop 8-12 percentage points during evening peaks (7-10 PM) when multiple banks experience load-related slowdowns.
Weekend performance often exceeds weekday rates because banking infrastructure handles lower overall transaction volumes. Smart brands recognise these patterns and adjust payment retry logic accordingly rather than treating all failures identically.
Why Payment Success Rate Is a Core Revenue KPI
Payment Success Rate is one of the most direct indicators of revenue performance because it shows how many customers successfully convert a purchase intent into actual payment. Even small improvements in PSR — say from 80% to 85% — can translate into significant revenue uplift without additional traffic or marketing spend.
A strong PSR benefits e-commerce brands in several ways:
- Higher conversion efficiency: More authorised payments lead to more completed orders from the same traffic volume.
- Reduced churn at checkout: Fewer declined transactions and errors mean fewer abandoned checkouts.
- Improved customer experience: Seamless payments enhance trust and decrease frustration, which drives repeat purchases.
- Better unit economics: More successful payments increase net revenue without increasing acquisition costs.
- Actionable diagnostic signal: PSR highlights where the payment funnel breaks — enabling targeted fixes (gateway switch, retry logic, alternative payment options).
For Indian e-commerce brands — where customers use a mix of UPI, wallets, BNPL, cards and COD — maintaining a high PSR means optimising across diverse payment methods and reducing friction across devices, networks and banks. It’s not just a metric — it’s a direct revenue driver.
What Payment Method Mix Optimises for Indian Customer Preferences?
Offering comprehensive choice whilst intelligently routing customers toward highest-success methods
Method availability matters less than method prominence and routing intelligence. Brands offering fifteen payment options without strategic ordering see marginally better success than those offering eight well-optimised methods. The critical factor is surfacing highest-success methods for each customer segment whilst maintaining choice for those with specific preferences.
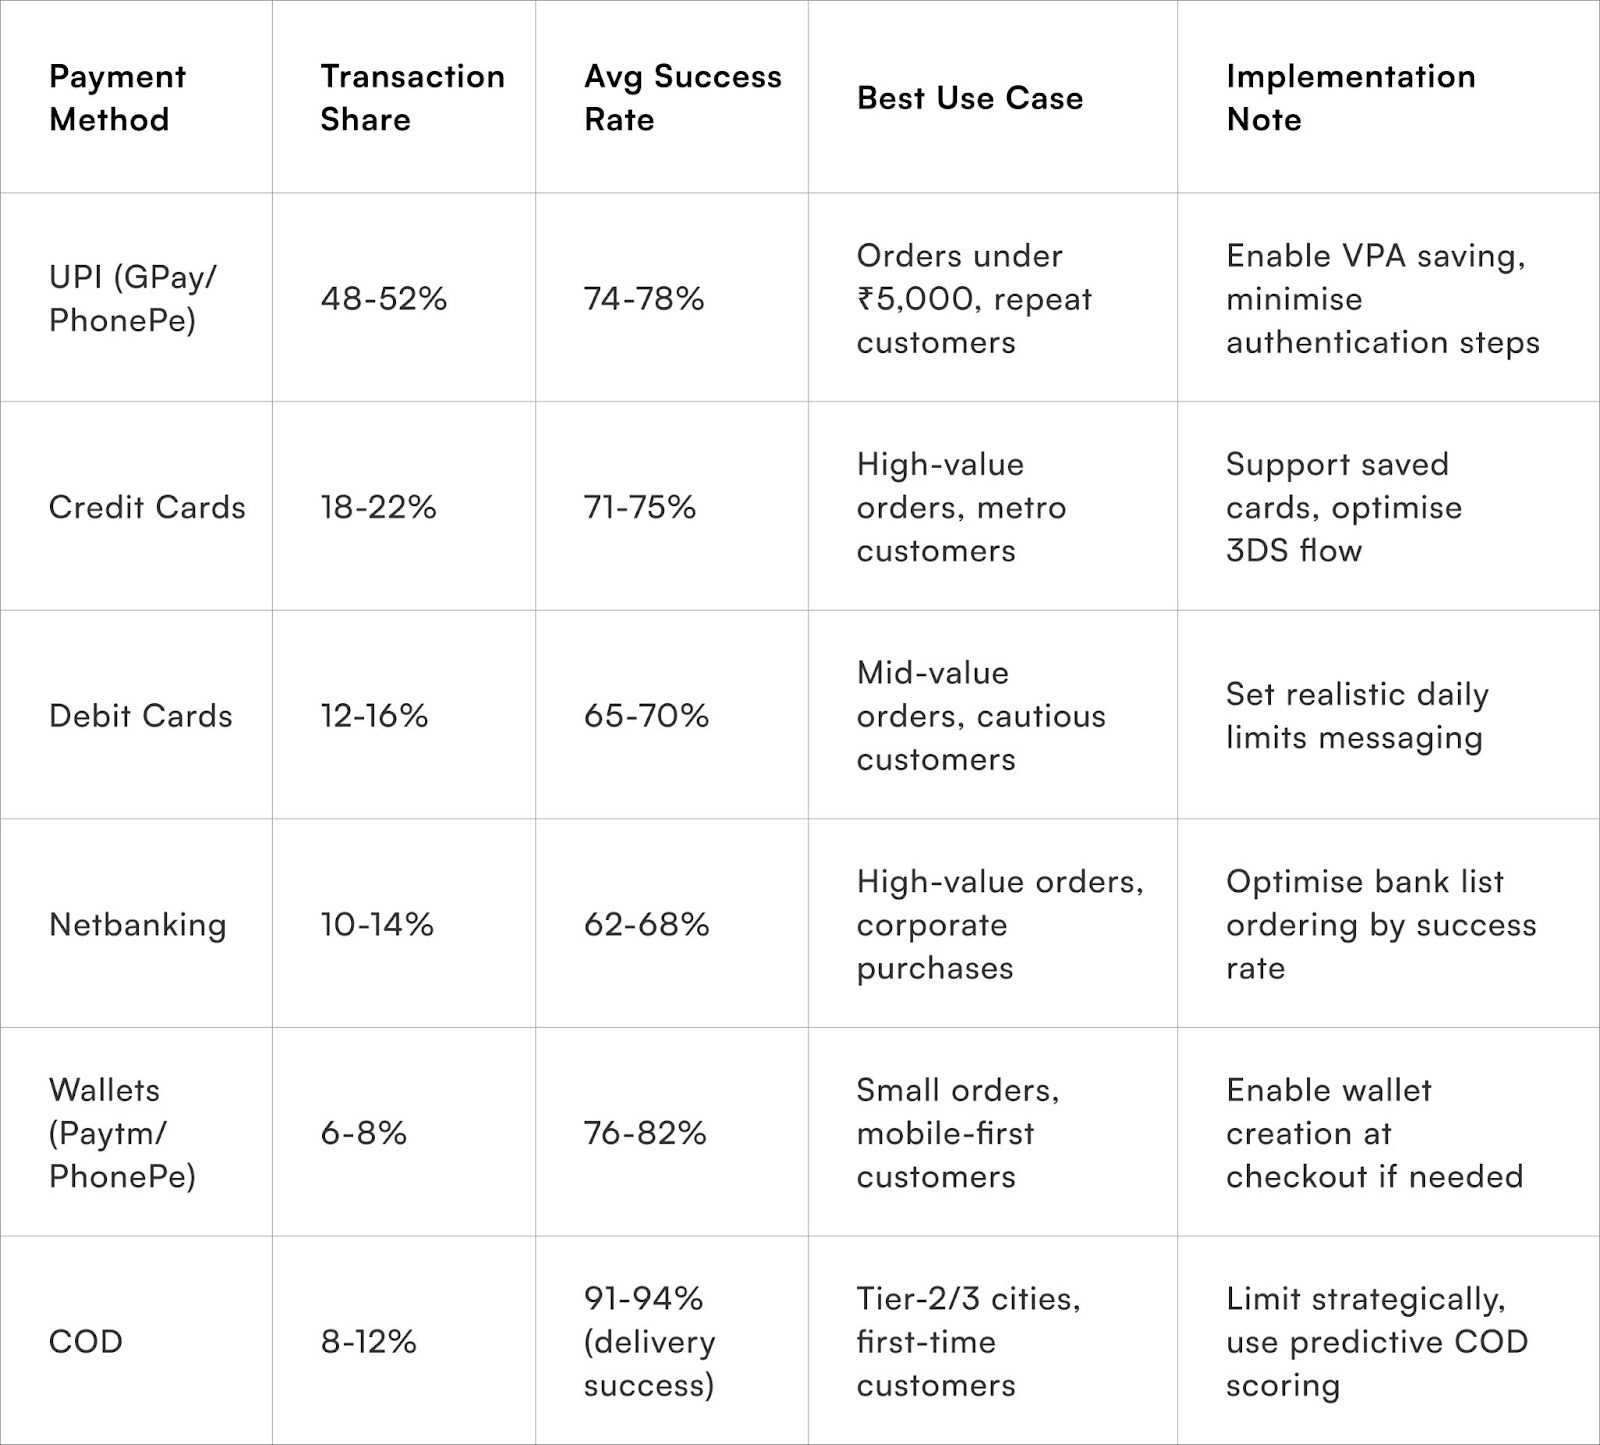
UPI dominates Indian digital payments with 62-68% share of D2C transactions, per PhonePe's merchant analysis. However, treating UPI monolithically misses significant optimisation opportunities.
- Google Pay users show 4-6 percentage points higher success rates than Paytm users for transactions above ₹2,000.
- PhonePe performs best for repeat customers with saved VPAs.
- Bank UPI apps lag consumer wallet UPIs by 7-9 percentage points in success rates. Smart payment pages detect customer's preferred UPI app through browser/device signals and surface it prominently rather than showing generic UPI option.
- The ordering intelligence separates adequate from excellent payment experiences. Most brands display methods alphabetically or by personal preference. Data-driven ordering shows each customer their highest-probability-of-success method first based on order value, location, device type, and previous behaviour.
A Mumbai customer purchasing ₹4,500 kurta set via mobile sees UPI prominent. A Delhi customer buying ₹18,000 electronics via desktop sees credit card featured. This personalisation improves success rates by 6-9 percentage points without changing available methods.
COD management requires particular sophistication for Indian operations. Blanket COD availability drives conversion but destroys unit economics through high RTO rates. Selective COD based on pin code performance, customer purchase history, and order value optimises the conversion-vs-cost tradeoff.
Brands using predictive COD scoring—offering prepaid incentives to low-risk customers whilst restricting COD for high-risk combinations—maintain 8-12% COD mix rather than 25-30% industry average, per Shiprocket's fulfilment data.
How Do Technical Implementation Choices Affect Success Rates?
Gateway selection, retry logic, and timeout parameters dramatically influence payment completion
Optimising Payment Success Rates: A Technical Imperative for Indian Brands
Many non-technical founders view payment gateways as interchangeable commodities, failing to recognise the significant impact of technical architecture on payment success rates (PSRs).
Strategic choices in gateway selection, routing logic, and failure handling can create a 10-15 percentage point variation in success rates between sophisticated and naive implementations.
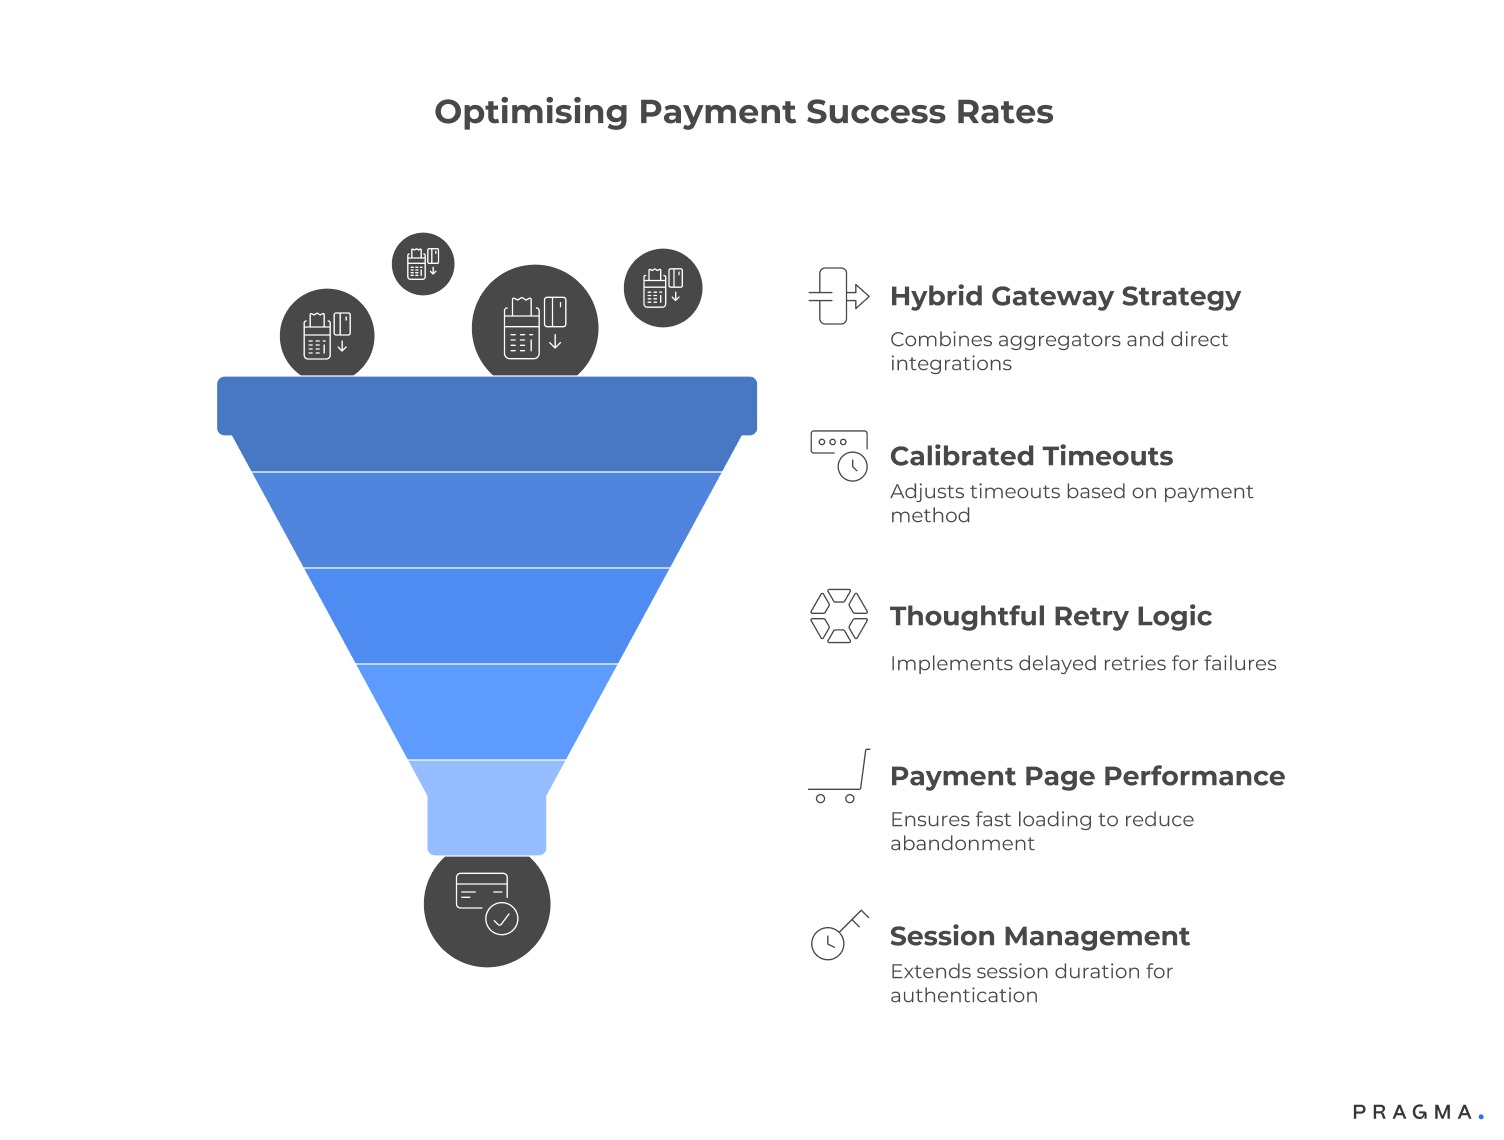
Hybrid Gateway Strategy and Intelligent Routing
While aggregators like Razorpay and Cashfree offer ease of integration, they sacrifice routing control. Direct bank integrations offer higher success rates but require complex relationship management.
The optimal strategy is a hybrid model: leveraging aggregator infrastructure (like Razorpay) while implementing custom, intelligent routing rules. These rules should be dynamic, based on specific transaction characteristics and historical success patterns. Myntra, for instance, reportedly uses this approach, achieving 79-82% PSRs, significantly higher than the 71-74% seen with pure aggregator use.
Calibrating Timeouts for Enhanced Success
Default gateway timeout parameters are often suboptimal. Aggressive thirty-second limits can prematurely terminate potentially successful transactions, frustrating customers. Conversely, excessively conservative two-minute limits improve success but degrade user experience. Timeouts must be
method-specific: UPI typically completes within 45 seconds, whereas netbanking often requires 75–90 seconds. Tailoring timeouts this way balances higher success rates with a better user experience.
Thoughtful Retry Logic for Recovery
Well-designed retry logic is crucial for converting initial failures into successful orders. Immediate retries often fail for the same reason. However, a delayed retry attempt (e.g., twelve hours later) with different routing frequently succeeds, as underlying bank issues may have resolved.
Automated retry systems are highly effective: Juspay's analysis shows they can recover 15-20% of failed transactions, adding 3-5 percentage points to the overall PSR. The key to successful implementation is transparent customer communication—informing them about the retry process, expected resolution time, and notification method.
Payment Page Performance and Pre-Payment Abandonment
Payment success isn't just about the final transaction. The speed of the payment page itself is a factor. Pages that load in over four seconds see an 8-11% abandonment rate before the user even attempts payment. This pre-payment drop-off is often misattributed to factors like pricing or trust instead of technical performance. Progressive loading—displaying payment methods while complex gateway integrations load in the background—is vital for maintaining perceived speed and reducing abandonment.
Session Management and Authentication Failures
Expired checkout sessions are a frequent cause of payment failures, especially during OTP delivery or bank authentication. Extending session duration—for instance, from a default three minutes to six minutes—can prevent many unnecessary failures.
However, this must be balanced: indefinite sessions create security and PCI compliance risks. The goal is to maintain an active session throughout the payment process while appropriately timing out abandoned checkouts.
While checkout conversion encompasses address and shipping steps, payment implementation consistently represents the highest-impact optimisation opportunity.
What Customer Communication Strategies Reduce Payment Abandonment?
Transparent messaging about process, timing, and alternatives transforms confused abandonment into patient completion
Customer psychology during payment proves fragile. Uncertainty breeds abandonment even when technical systems function properly. A customer waiting twenty seconds for netbanking redirect without feedback assumes the page broke and abandons. The same customer seeing "Connecting to HDFC Bank, this typically takes 15-25 seconds" waits patiently for forty seconds.
Real-time status messaging reduces anxiety-driven abandonment significantly. Payment pages should communicate what's happening at each stage
- "Loading payment options,"
- "Connecting to UPI,"
- "Waiting for bank authentication,"
- "Confirming payment"
rather than showing generic loading screens. Brands implementing stage-specific status messages report 6-8% reduction in pre-completion abandonment, per Razorpay's UX research with fifty merchant implementations.
Failure messaging determines whether customers retry immediately, attempt later, or abandon permanently. Generic
- "Payment failed”
- “please try again"
messages frustrate customers who don't understand what went wrong or how to fix it. Specific, actionable failure messages—"Your bank declined this transaction. This sometimes happens due to daily limits.
Try different payment method or contact your bank"—provide clear path forward. The messaging should match failure type: insufficient balance messages differ from authentication timeout messages.
Alternative payment suggestions at failure points recover transactions that would otherwise abandon. When credit card fails, immediately surface UPI option. When UPI fails, suggest netbanking or saved card if available.
This contextual suggestion proves more effective than forcing customers back to full payment method selection page. Flipkart's payment flow reportedly shows three alternative methods within the failure screen itself, recovering 18-22% of initially failed transactions through immediate method switching.
Post-failure communication via SMS or email rescues additional conversions. Customers who abandon after failure often intend to complete purchase but get distracted. An SMS within thirty minutes stating "Your ₹X,XXX cart is saved.
Complete payment in one click: [link]" with simplified payment interface recovers 8-12% of failures. The critical elements are timing (within hours, not days), simplicity (direct payment link, not return-to-cart), and reassurance (order reserved, inventory held).
Which Hidden Factors Undermine Success Rates Most Severely?
Anti-fraud systems, payment page complexity, and bank relationship quality create invisible friction
The Hidden Dynamics of Payment Success Rates for Indian Brands
Most Indian brands focus only on the surface-level payment flow (method selection, detail entry, authentication). However, the real determinants of success rates are the invisible backend decisions involving transaction routing, fraud assessment, and gateway selection.
Key Misunderstandings Impacting Success:
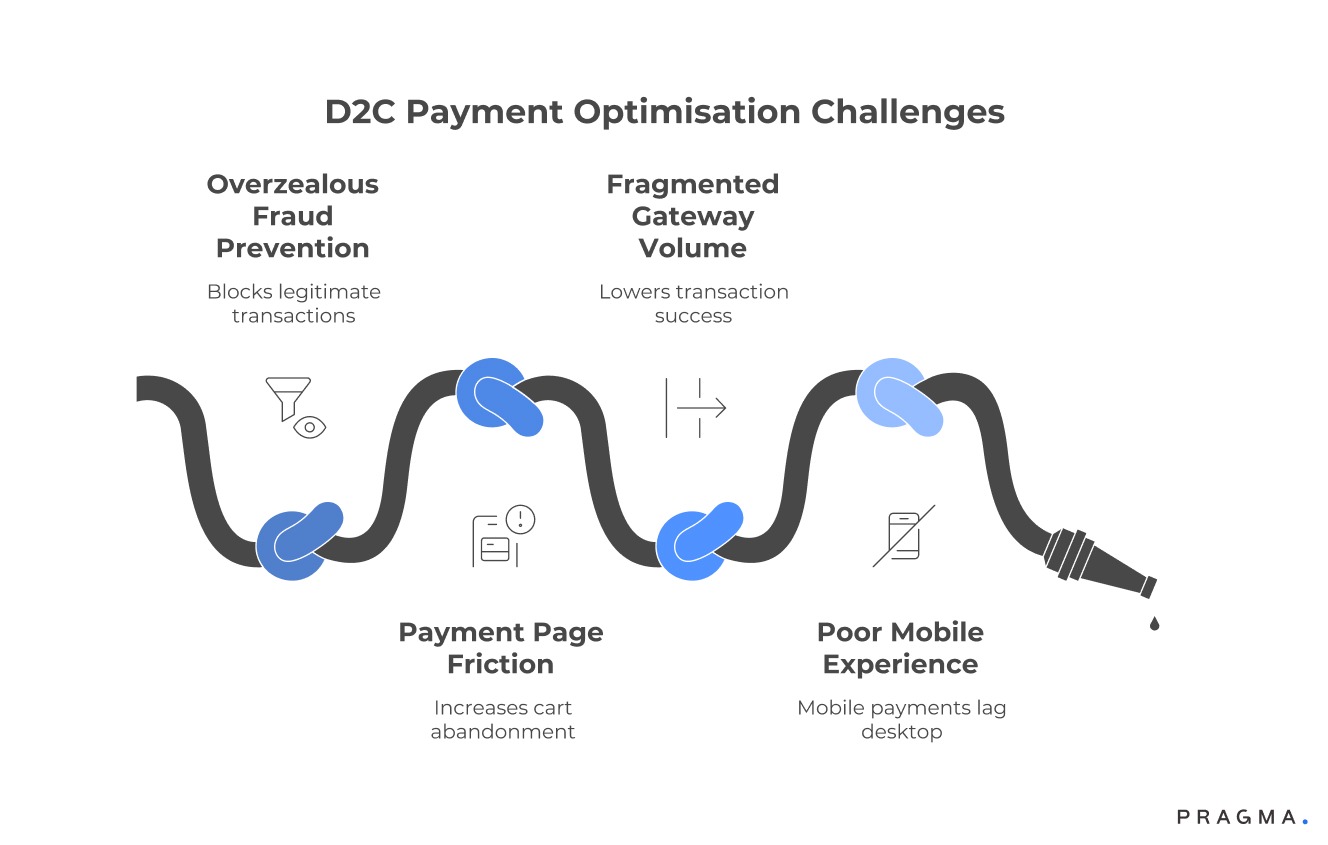
- Overzealous Fraud Prevention:
Aggressive fraud systems often generate high 'false positive' rates, wrongly blocking legitimate transactions. Analysis suggests that for every ₹100 saved by preventing fraud, brands can lose ₹400-600 due to falsely declined legitimate orders.
Most brands fail to calibrate fraud thresholds, relying on ineffective gateway defaults. The optimal threshold requires customisation based on category, average order value, and customer acquisition cost.
- Payment Page Friction:
Complex payment pages increase abandonment, irrespective of backend performance. Requesting redundant information—such as a billing address matching the shipping address, or an email already collected—creates friction interpreted as suspicion.
Streamlined pages, like Myntra's, which request only essential information per method (e.g., just VPA for UPI or CVV for saved cards), see completion rate improvements of 9-12% compared to comprehensive information collection.
- Fragmented Gateway Volume:
Concentrating transaction volume with a single gateway significantly improves success rates due to better bank relationship leverage. Brands processing over ₹10 crores monthly through a single gateway achieve success rates 4-7 percentage points higher than those splitting volume across multiple providers. High-volume concentration grants access to preferential routing, processing priority, and dedicated technical support.
- Poor Mobile Experience:
Despite mobile traffic dominance, the mobile payment experience often lags desktop. Mobile success rates for Indian D2C brands (68-72%) are substantially lower than desktop rates (76-80%), a gap that should be inverted, especially with mobile-native UPI. Issues include small text fields, awkward dropdowns, and authentication flows not optimised for mobile.
Utilising Progressive Web App (PWA) implementations with native UPI deep-linking can achieve mobile parity by entirely bypassing standard web-based payment flows.
Wins from Optimising Payment Success Rates
Immediate improvements in payment success rates through configuration and communication changes
Week 1:
Analyse payment failure data with granularity most brands skip. Export past month's transactions and categorise failures by payment method, time of day, customer location, and failure reason. Calculate success rates for each segment—you'll likely discover that Paytm UPI fails 12% more often than GPay, evening transactions fail 15% more than morning, or that specific bank cards show terrible performance.
This segmented analysis reveals highest-impact optimisation targets. Request detailed failure reason codes from your payment gateway rather than relying on aggregated "payment failed" categories.
Week 2:
Implement method-specific timeout configurations if your gateway supports customisation. Set UPI timeouts to fifty seconds, credit card authentication to seventy seconds, and netbanking to ninety seconds based on historical completion time distributions.
Add real-time status messaging to your payment page showing what's happening during each stage. This requires minimal development—usually just adding text updates triggered by gateway callback events. These combined changes typically improve success rates by 3-5 percentage points within first week of deployment.
Week 3:
Optimise payment method ordering based on success rate data from Week 1 analysis. Create location-based routing rules showing UPI prominent for metro customers, netbanking for corporate purchases, and COD options appropriately restricted for high-RTO pin codes.
Configure automated retry logic with your gateway for bank-side technical failures—these retry attempts twelve hours later frequently succeed without customer involvement. Set up failure notification system via SMS containing direct payment links for easy retry.
Week 4:
Audit and calibrate your fraud prevention thresholds. Request false positive reports from your gateway showing legitimate orders incorrectly declined. If false positive rate exceeds 2-3%, loosen fraud rules progressively whilst monitoring actual fraud impact.
Test simplified payment page variants removing non-essential information collection—particularly for returning customers where you already have complete details. Measure completion rate impact separately from success rate impact.
Expected outcomes after thirty days: 8-12 percentage point improvement in payment success rates, 4-6% increase in order conversion, ₹80,000-150,000 recovered monthly revenue for brands doing ₹50 lakhs GMV. These improvements require minimal development investment whilst establishing a baseline for more sophisticated optimisation.
To Wrap It Up
Payment success rates represent the most overlooked revenue lever for Indian D2C brands. Technical complexity and infrastructure fragmentation create acceptance of 68-72% success as inevitable when 80-85% is achievable through systematic optimisation.
The revenue impact proves substantial—improving from 70% to 82% success generates 17% more revenue from identical traffic and marketing spend. This week, segment your payment data by method, time, and location to identify your specific highest-impact optimisation opportunities rather than applying generic best practices.
Sustainable improvement requires moving beyond surface-level gateway integration toward strategic payment architecture.
This means intelligent routing based on transaction characteristics, method-specific timeout and retry logic, and customer communication that transforms uncertainty into patience. Fraud prevention deserves particular attention—most brands lose more revenue to false declines than to actual fraud, yet rarely calibrate fraud thresholds beyond gateway defaults.
The long-term opportunity extends beyond success rate optimisation into predictive payment routing that anticipates failures before attempting transactions.
Machine learning models identifying likely-to-fail combinations before customer reaches payment can pre-emptively surface alternative methods or trigger backend routing changes. This proactive approach represents payment optimisation's next frontier, though most brands haven't yet mastered the foundational optimisations outlined here.
For D2C brands seeking intelligent payment routing, automated retry systems, and unified analytics across multiple payment methods and gateways, Pragma's payment operations platform provides pre-built integrations with major Indian payment providers alongside predictive routing algorithms that help brands improve success rates by 10-15 percentage points whilst reducing false declines and streamlining reconciliation across channels.
.gif)
FAQs (Frequently Asked Questions On Payment Success Rates: What Most Indian Brands Misunderstand)
1. Should I remove payment methods with lower success rates to improve overall metrics?
Only remove methods after confirming they're not preferred by specific valuable customer segments. A payment method showing 65% success but used by 35% of high-value repeat customers shouldn't be removed despite dragging down averages. However, obscure methods with sub-60% success rates and minimal adoption (under 2% usage) create more confusion than value.
The right approach is surfacing high-success methods prominently whilst maintaining low-success options for customers who specifically prefer them. Measure removal impact on conversion, not just success rate—sometimes lower-success methods convert customers who wouldn't purchase otherwise.
2. How much should I incentivise prepaid payments to reduce COD dependency?
Offer ₹50-100 discounts for prepaid orders below ₹2,000 and ₹100-200 for orders above ₹2,000 based on your COD handling cost structure. However, incentive effectiveness varies dramatically by customer segment. First-time customers in Tier-2 cities rarely convert from COD preference regardless of discount size.
Repeat customers in metros switch readily for ₹50 savings. Use predictive models offering targeted incentives only to customers showing genuine payment method flexibility rather than blanket discounts that subsidise customers who would've chosen prepaid anyway. Brands using smart targeting reduce COD mix by 6-9 percentage points whilst spending 40% less on incentives compared to universal discount approaches.
3. What's the right balance between fraud prevention and accepting higher risk for better success rates?
Calculate your fraud loss rate (fraudulent orders ÷ total orders) and false decline rate separately, then optimise the ratio. If you're experiencing 0.3% actual fraud but declining 3% of orders as suspicious, you're losing ten times more revenue to false positives than to actual fraud.
Tighten fraud rules only when fraud losses exceed 0.5% of GMV for most D2C categories. The optimal equilibrium accepts slightly higher fraud in exchange for dramatically fewer false declines, particularly for low-margin categories where customer acquisition costs make every legitimate order critical. Premium categories with high margins can afford more conservative fraud prevention.
4. Do payment gateway fees justify paying for multiple gateway integrations?
Maintain two gateway relationships rather than one, but avoid fragmenting across three or more. Primary gateway handles 80% of volume, secondary serves as backup during primary outages and provides negotiation leverage.
The redundancy proves valuable during technical issues—Razorpay outages lasting 2-3 hours cost brands lakhs in lost sales. However, splitting volume equally across multiple gateways sacrifices volume-based pricing, complicates reconciliation, and prevents building deep technical relationships.
Smart brands consolidate strategically rather than diversifying excessively. Switch gateways entirely if performance gaps persist, rather than permanently operating fragmented infrastructure.
5. Should regional language support extend to payment pages or is English sufficient?
English payment interfaces work adequately for metro and Tier-1 customers but limit Tier-2/3 conversion where vernacular preference runs strong. However, payment gateway limitations often prevent comprehensive vernacular implementation—bank authentication screens, UPI apps, and card networks operate in English regardless of merchant interface language. The highest-impact vernacular investment is payment failure messaging and retry communication via SMS in customer's preferred language, which you control entirely. This targeted approach delivers 60-70% of full vernacular payment benefits with 20% of implementation complexity. Full vernacular payment pages make sense only when Tier-2/3 customers represent 40%+ of target audience.
Talk to our experts for a customised solution that can maximise your sales funnel
Book a demo

.png)